
Abstract
The fracture characteristics of fractured rock mass have important significance in environmental geotechnical engineering. Taking a single crack rock mass with dip angle of 45° as the research object, we studied the fracture characteristics of fractured rock mass under different seepage water pressures and confining pressures based on Realistic Failure Process Analysis-Seepage. And then, the initial crack strength was derived and the effect of seepage water pressure and confining pressure on the crack propagation of fractured rock mass was analyzed. It was concluded that the mode of the longitudinal splitting failure, the upside-down capital letter “N”-type failure, and the “—”-type failure were proposed in numerical simulation, which were induced by wing cracks, anti-wing cracks, and secondary coplanar cracks, respectively. In addition, there exists the bifurcation phenomenon of cracks under the seepage water pressure. In theoretical analysis, the initial crack strength increases with the increasing confining pressure and decreases with the increasing seepage pressure, which are in good agreement with the experimental results in the literature. Confining pressure has an inhibitory effect on crack initiation. With the increase in the confining pressure, the successive order of inhibition is wing cracks, anti-wing cracks, and secondary coplanar cracks.
Keywords
Introduction
Fractured rock mass, widely encountered in rock engineering, is a kind of complex medium, which is different from other engineering materials.1–2 Fractures are formed by rock mass subjected to stress action. The existence and interaction of a large number of fractures in rock mass have great influence on the mechanical properties of rock materials. The experimental results showed that the failure of rock mass under external loads is due to the interaction among micro-cracks in rock mass and crack initiation, propagation, and coalescence.3–5 For this reason, many scholars, making rich achievements, have studied the crack initiation, propagation, and the fracture mode of fractured rock mass.6–14
With the development of engineering practice, the research on the crack propagation of the fractured rock mass in the seepage field is becoming more and more important in the engineering practice, such as design of fractured rock slope, dewatering depressurization of mine water, prediction of earthquake induced by reservoir, disposal of hazardous nuclear waste, development of oil and geothermal energy, and exploitation and utilization of groundwater resources, which all need to consider the crack propagation of fractured rock mass under seepage water pressure. 15 Therefore, Yu et al. 16 studied the mechanical properties and permeability of sandstone with a single joint filled with gypsum based on the triaxial test. Zhang et al. 17 researched the crack initiation characteristics of elliptical cracks under different confining pressures and pore water pressures. Oda 18 studied the equivalent continuum model under the coupling of seepage field and stress field. Zhao et al. 19 made a detailed research on crack damage and fracture mechanism of compression shear fractured rock mass under seepage water pressure and then damage and fracture mechanics model was established. Li et al. 20 detected the law of opening-mode crack initiation and the evolution of crack tip stress intensity factor considering the combined action of seepage pressure and far-field stress and proposed the damage fracture mechanical model of rock-like material and the evolution equation of the crack tip stress intensity factor. Pang et al. 21 studied the single crack extension mechanical model based on the triaxial seepage experiments, illustrating the mechanism of confined water inrush from coal seam floor. He et al. 22 carried out the experimental investigation of crack extension patterns in hydraulic fracturing with shale, sandstone, and granite cores. Ren et al. 23 attempt to make a detailed discussion on the applicability of several widely accepted fracture criteria to some brittle materials. Guo et al. 24 presented a stress model of micro-cracking element on the basis of damage properties in the tip of main crack in order to explain the mode I and II of rock fracture under compressive loading. Liu et al. 25 studied compression shear fractured rock under high pore fluid pressure to determine an appropriate model for describing the initial cracking law and the evolution law of the stress intensity factor at the tip of a wing crack. Li et al. 26 proposed a novel numerical model on the basis of secondary development in Fast Lagrangian Analysis of Continua (FLAC3D) to simulate the fracture development of jointed rock mass under fracture water pressure, which results were verified by the lab experiments. Wang et al. 27 performed two series of numerical tests in relatively homogeneous and heterogeneous rocks to investigate the influence of pore pressure magnitude and gradient on initiation and propagation of tensile fractures.
Most of the above research achievements based on laboratory tests and theoretical analysis have been playing an important role in the stability of geotechnical engineering. With more and more geotechnical engineering–difficult problems emerging, difficult problems cannot be solved effectively on the basis of the same method. Therefore, there is an urgent need for stronger analytical tools to study and analyze these issues. However, with the rapid development of computer technology, numerical simulation has become an indispensable means to solve the geotechnical engineering problems and to carry out geotechnical-related scientific research. Compared with laboratory tests and theoretical analysis, numerical simulation is characterized by the advantages of audio–visual image, low cost, and simple operation. What’s more, external loads in all directions can be arbitrarily imposed and stress analysis and displacement analysis can be carried out for each region and each measuring point in numerical simulation, which has important value in monitoring, equipment development, optimization, and effect prediction. Therefore, in this article, the fracture characteristics of fractured rock mass with a single crack were studied by numerical simulation under the different seepage pressures and confining pressures.
Numerical modeling
Fundamentals of Realistic Failure Process Analysis-Seepage
Realistic Failure Process Analysis-Seepage (RFPA-Seepage), one of the most widely used numerical software tools employed for rock mechanic calculations being particularly suitable for solving nonlinear large problems in geotechnical mechanical engineering, where stress analysis uses the finite element method based on elastic mechanics while damage analysis uses the revised Mohr–Coulomb criterion to calibrate the damaged cell parameters using the method of stiffness degradation and reconstruction, is a numerical test tool for simulating progressive failure of materials. 28 The seepage process of fractured rock mass in RFPA-Seepage satisfies the Biot’s consolidation theory and the modified Terzaghi’s effective stress principle.29–30 In addition, an important feature of RFPA-Seepage is that the heterogeneity of material properties is considered according to the Weibull distribution,31–32 as shown in equation (1)

where s is the parameter of element (such as Young’s modulus or strength); the parameter s0 is related to the average of the element parameter; the parameter m defines the degree of material homogeneity and is called the homogeneity index, which can be obtained from the statistical distribution of rock mass parameters.31–32 According to the definition of the Weibull distribution, the value of parameter m must be larger than 1.0. In previous paper, 33 the validation of using of Weibull distribution in describing the heterogeneity of rock had been given.
Mechanics concept model
The main research objects of traditional fracture mechanics are three kinds basic crack types: opening type (type I), sliding type (type II), and tearing type (type III). 34 However, because of the influence of rock mass structure, the anisotropy of the rock material, or the seepage water pressure on cracks, the stress field at the crack tip is mostly mixed mode, which most of them are the compression shear cracks. Therefore, taking a single crack rock mass with dip angle of 45° as the research object, we studied the crack propagation of fractured rock mass under the different seepage pressures and confining pressures. Figure 1 shows the mechanics concept model. In Figure 1, the length of the single crack is 2a, and σ1, σ3, p, σn, and τn are the axial stress, confining pressure, pore water pressure, effective compression stress, and shear stress of the crack surface, respectively. The intersection angle between the single crack and the action direction of σ1 is β.
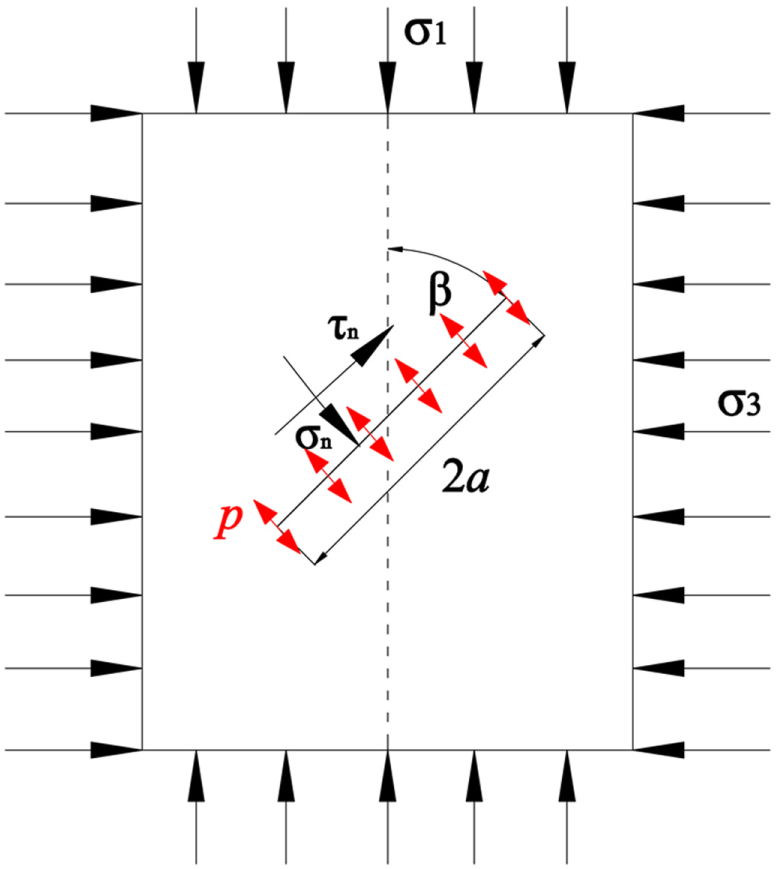
Mechanics concept model.
Experiment schemes
This article simulated the crack propagation process of fractured rock mass with a single crack under different confining pressures and pore water pressures based on single factor variable method. Different constant seepage water pressure values in the crack are p = 0, 0.4, 0.8, 1.2, and 1.4 MPa. Different horizontal confining pressure values of model are σ3 = 0, 5, and 8 MPa. So, the total number of experiment scheme is 15.
Model building
Material properties
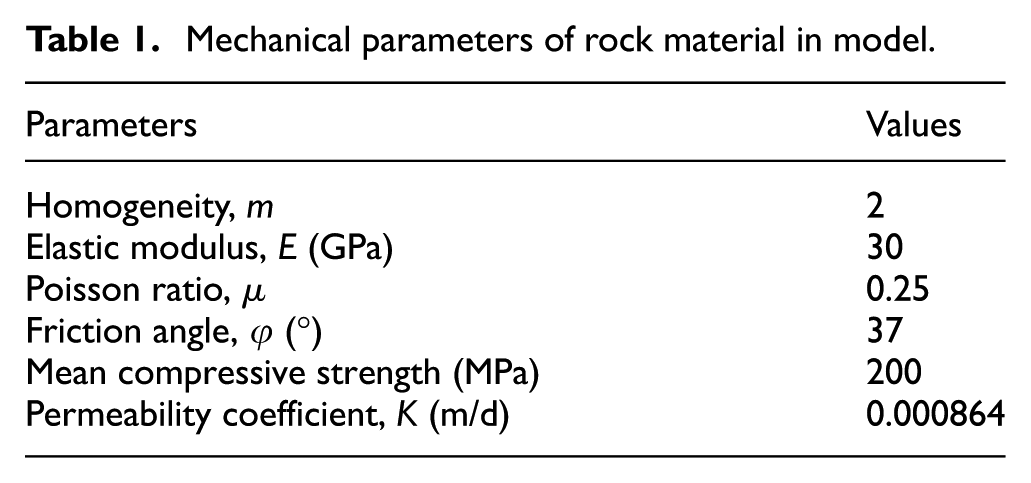
The mechanical parameters of rock mass were used in the model, which were tested based on the aquifuge in floor rock mass of the seventh coal seam in Yangliu colliery, as shown in Table 1.
Mechanical parameters of rock material in model.
Numerical model
RFPA-Seepage simulation model was established based on mechanics concept model, as shown in Figure 2. The two-dimensional (2D) plane stress model was used in the numerical model, and the sample size was 100 mm × 50 mm, which was divided into 200 × 100 units. In the specimen model, a single crack with dip angle 45° was fabricated, and the crack length was 20 mm. The initial condition of the numerical model was that the displacement and velocity of the four sides were set to zero. When the model was going to be calculated, the axial pressure σ1, the confining pressure σ3, and the seepage water pressure p were applied to the numerical model, respectively. Then, the loading mode of stress control was used, and the stress increment was 0.006 MPa.

RFPA-Seepage model.
Constitutive model
The mechanical properties of rock mass are very complex because of the pore water pressure and stress fields. Brace et al. 35 studied the permeability of rock with the stress state for the first time, which made people realize that the failure of rock materials and the evolution of seepage properties are closely related to the evolution of micro-damage evolution and macroscopic cracks formation. The basic equations of seepage–stress coupling model are as follows:36–37
Equilibrium equation

Geometric equation

Principle of effective stress

Seepage equation

Seepage–stress relation equation

where p is seepage water pressure; Q and ρ are Biot constants; δ is Kronecker’s constant; Kij is permeable coefficient tensor; b is coupling coefficient; G is shear modulus; λ is Lamé’s coefficient;
Results
Crack propagation of fractured rock mass under σ3 = 0 MPa
When the confining pressure σ3 is 0 MPa, the simulation test is equivalent to the uniaxial compression simulation.
p = 0 MPa
When the seepage water pressure p is 0 MPa, the shear stress and acoustic emission evolution simulation diagram of fractured characteristics are shown in Figure 3. In evolution simulation diagram, we first made an illustration that steps X–Y means the Yth step in the Xth step, by which we can judge the fracture time. The crack initiation angle is the intersection angle between the tangential direction of initial crack point and the original crack extension direction in crack propagation path. In Figure 3, with the increase in the axial stress, crack tip started fracturing at the fifth step in the 11th step (step 11–5), then wing cracks were produced in the fractured rock mass by crack propagation at step 16–7 (Figure 3(a)), and the initial crack angle of top and bottom wing crack is 71° and 73°, respectively, which is consistent with the theoretical value. 3 At step 11–5, the red circle appeared at the crack tip, which indicated that the rock mass units had been destroyed (Figure 3(b)). From step 16–7 to step 16–55, the direction of wing crack propagation at both ends of the crack tended to the direction of the maximum principal stress, and eventually, the wing crack extended to the upper and lower boundaries of the specimen, leading to the longitudinal splitting failure, which agreed with the simulation results. 38
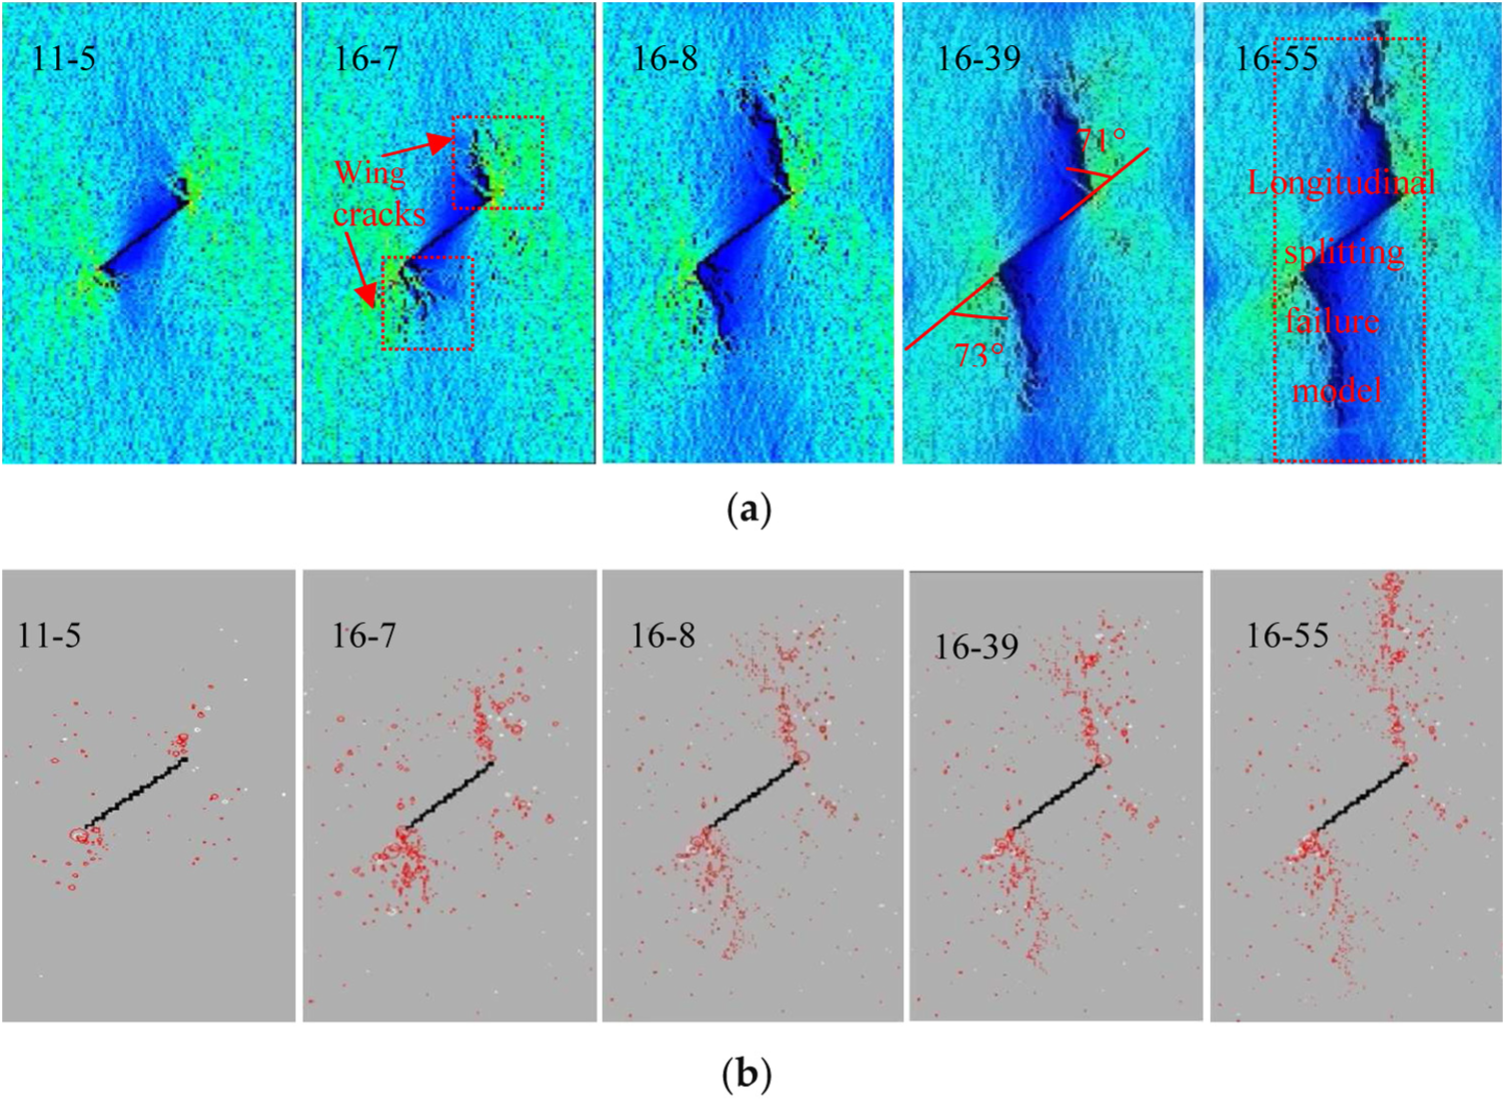
Simulation diagram of fracture propagation when p = σ3 = 0 MPa: (a) evolution diagram of shear stress and (b) evolution diagram of acoustic emission.
p = 0.4 MPa
When the seepage water pressure p is 0.4 MPa, the shear stress, acoustic emission, and pore water pressure evolution simulation diagram of fractured characteristics are shown in Figure 4. In Figure 4, crack propagation evolution diagram was similar to Figure 3, but the initial crack angle of top and bottom wing crack was 79° and 74°, respectively (Figure 4(a)). What’s more, comparing with the failure time of p = 0 MPa (Figure 3), we knew that the time of failure became short, which is consistent with the simulation result based on the improved FLAC3D. 39 At step 14–25, the wing crack tip appeared bifurcated, which induced by non-uniformity damage of the fractured rock mass units under the seepage water pressure, presenting that the fractured rock was totally destroyed, and fracture model was the longitudinal splitting type.

Simulation diagram of fracture propagation when p = 0.4 and σ3 = 0 MPa: (a) evolution diagram of shear stress, (b) evolution diagram of acoustic emission, and (c) evolution diagram of pore water pressure.
p = 0.8, 1.2, and 1.4 MPa
When the seepage water pressure p is 0.8, 1.2, and 1.4 MPa, the shear stress, acoustic emission, and pore water pressure simulation diagram of fractured characteristics before instability are shown in Figure 5. When p = 0.8 MPa, the initial crack angle of top and bottom wing crack was 81° and 76°, respectively (Figure 5(a)). When p = 1.2 MPa, the initial crack angle of wing crack top and bottom was 83° and 80°, respectively (Figure 5(b)). When p = 1.4 MPa, the initial crack angle of wing crack top and bottom was 87° and 82°, respectively (Figure 5(c)). When σ3 = 0 MPa, with the increase in the seepage water pressure, the initial crack angle of wing crack increased and the time of instability became short, which is consistent with the simulation result. 39 In addition, fracture models of rock mass were basically all the longitudinal splitting failure model.
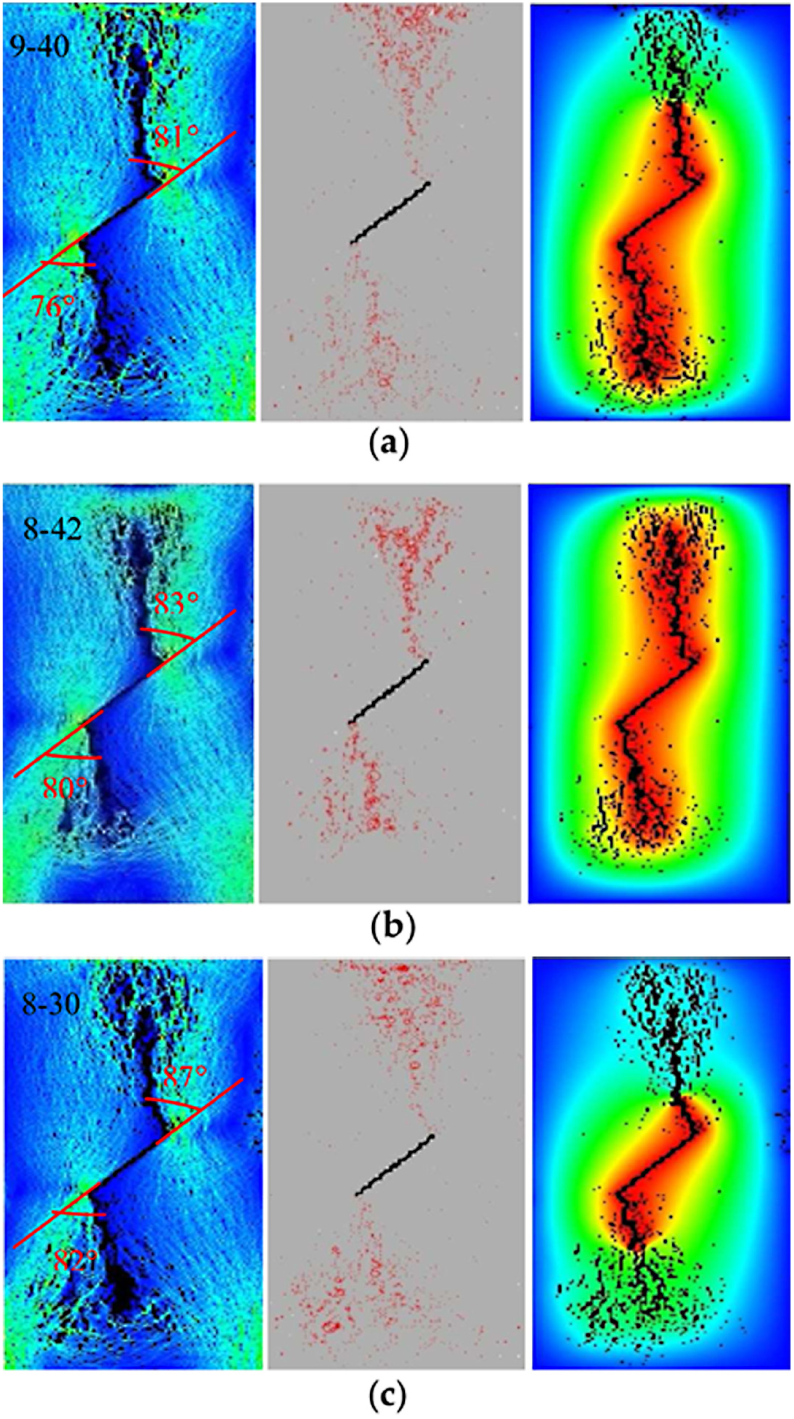
Simulation diagram of fracture propagation when p = 0.8, 1.2, and 1.4 MPa and σ3 = 0 MPa: (a) p = 0.8 MPa, (b) p = 1.2 MPa, and (c) p = 1.4 MPa.
Crack propagation of fractured rock mass under σ3 = 5 MPa
p = 0 MPa
When the seepage water pressure p = 0 MPa and σ3 = 5 MPa, the shear stress and acoustic emission evolution simulation diagram of fractured characteristics are shown in Figure 6. In Figure 6, with the increase in the axial stress, crack tip started fracturing at step 27–1, then anti-wing cracks were produced in the fractured rock mass by crack propagation at step 31–16 (Figure 6(a)), and the initial crack angle of bottom anti-wing crack was 115°. At step 35–5, the bottom anti-wing crack continually extended while the top anti-wing crack started fracturing, which the initial crack angle was 119°. The evolution simulation diagram between shear stress and acoustic emission was corresponding. With the increase in the loading steps, the top anti-wing crack gradually extended to the right boundary of model, which meant that the fractured rock was totally destroyed, and fracture model was the upside-down capital letter “N” type. Under the circumstance, the simulation results on the initial crack angle and fracture model were verified in physical test.3,40
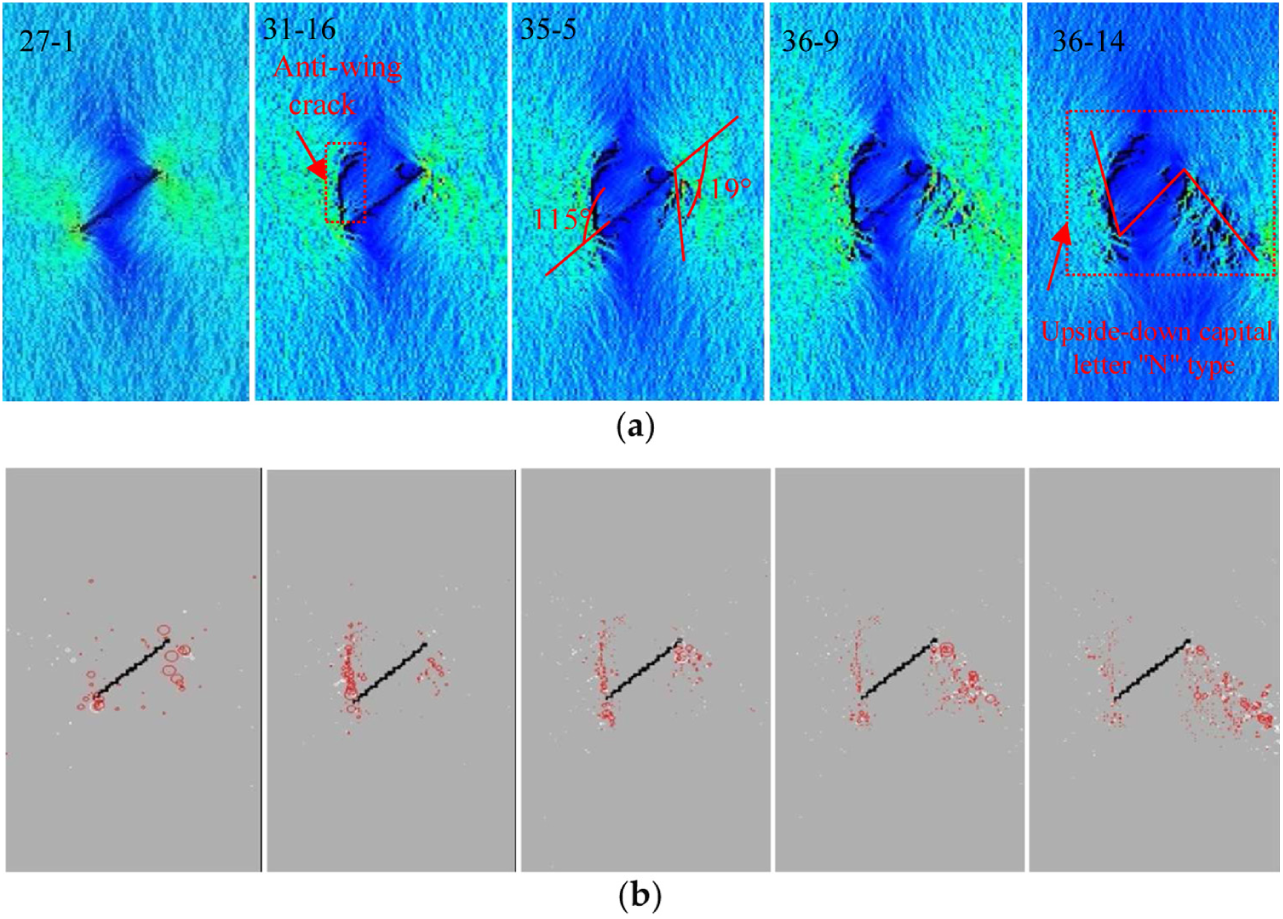
Simulation diagram of fracture propagation when p = 0 MPa and σ3 = 5 MPa: (a) evolution diagram of shear stress and (b) evolution diagram of acoustic emission.
p = 0.4 MPa
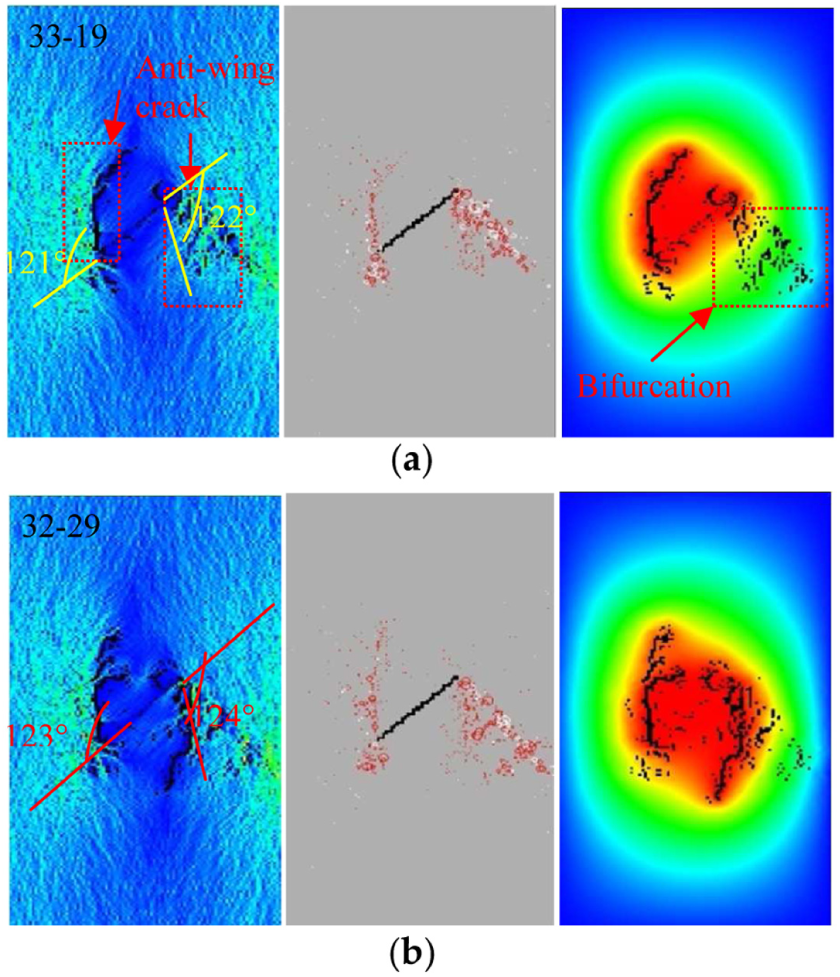
When the seepage water pressure p = 0.4 MPa and σ3 = 5 MPa, the shear stress, acoustic emission, and pore water pressure evolution simulation diagram of fractured characteristics are shown in Figure 7. In Figure 7, crack propagation evolution diagram was similar to Figure 6, but the initial crack angle of top and bottom anti-wing crack was 121° and 119°, respectively (Figure 7(a)). What’s more, compared with the failure time of p = 0 MPa (Figure 6), we knew that the time of instability became short. At step 33–31, the top anti-wing crack tip appeared bifurcated, which meant that the fractured rock was totally destroyed, and fracture model was the upside-down capital letter “N” type.

Simulation diagram of fracture propagation when p = 0.4 MPa and σ3 = 5 MPa: (a) evolution diagram of shear stress, (b) evolution diagram of acoustic emission, and (c) evolution diagram of pore water pressure.
p = 0.8 and 1.2 MPa
When the seepage water pressure p is 0.8 and 1.2 MPa, the shear stress, acoustic emission, and pore water pressure simulation diagram of fractured characteristics before instability are shown in Figure 8. When p = 0.8 MPa, the crack initiation angle of top and bottom anti-wing crack was 122° and 121°, respectively (Figure 8(a)). When p = 1.2 MPa, the initial crack angle of top and bottom anti-wing crack was 124° and 123°, respectively (Figure 8(b)). When σ3 = 5 MPa and p = 0, 0.4, 0.8, and 1.2 MPa, with the increase in the seepage water pressure, the initial crack angle of anti-wing crack increased and the time of instability became short, which is consistent with the simulation result. 39 In addition, fracture models of rock mass were basically all the upside-down capital letter “N” failure model.
Simulation diagram of fracture propagation when p = 0.8 and 1.2 MPa and σ3 = 5 MPa: (a) 0.8 MPa and (b) 1.2 MPa.
p = 1.4 MPa
When the seepage water pressure p = 1.4 MPa and σ3 = 5 MPa, the shear stress, acoustic emission, and pore water pressure evolution simulation diagram of fractured characteristics are shown in Figure 9. In Figure 9, secondary coplanar cracks were produced by crack propagation at step 2–6. With the increase in the axial stress, the propagation direction of secondary coplanar cracks tended to the horizontal direction, until to the horizontal boundaries, which led to the “—”-type failure model.

Simulation diagram of fracture propagation when p = 1.4 MPa and σ3 = 5 MPa: (a) evolution diagram of shear stress, (b) evolution diagram of acoustic emission, and (c) evolution diagram of pore water pressure.
Crack propagation of fractured rock mass under σ3 = 8 MPa
When the seepage water pressure p = 0 MPa and p = 0.4, 0.8, 1.2, and 1.4 MPa, the shear stress, acoustic emission, and pore water pressure evolution simulation diagram of fractured characteristics are shown in Figures 10 and 11, respectively. In Figure 10, secondary coplanar cracks were produced by crack propagation at step 26, and with the increase in the axial stress, the propagation direction of secondary coplanar cracks tended to the horizontal direction, until to the horizontal boundaries, which led to the “—”-type failure model. In Figure 11, with the increase in the seepage water pressure, the instability time became short and fracture models of rock mass were basically all the “—”-type failure model.

Simulation diagram of fracture propagation when p = 0 MPa and σ3 = 8 MPa: (a) evolution diagram of shear stress and (b) evolution diagram of acoustic emission.

Simulation diagram of fracture propagation when p = 0.4, 0.8, 1.2, and 1.4 MPa and σ3 = 8 MPa: (a) 0.4 MPa, (b) 0.8 MPa, (c) 1.2 MPa, and (d) 1.4 MPa.
Discussion
The different fracture models of fractured rock mass were induced by wing cracks, anti-wing cracks, and secondary coplanar cracks based on the above simulation results. The initial crack strength varies under different seepage water pressures and confining pressures, which presents the difference of the initiated crack type. For this reason, the evolution law of the initial crack strength of fractures rock mass was discussed under different seepage water pressures and confining pressures.
Theoretical analysis on the initial crack strength
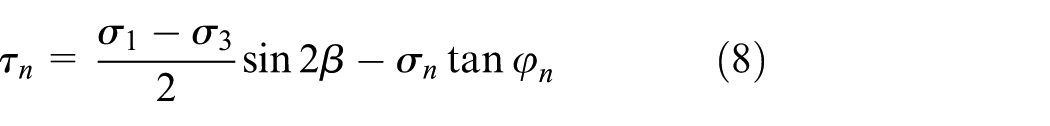
Under the action of the compression shear stress, the effective compression stress of the crack surface was derived based on the mechanics concept model (Figure 1), as shown in equation (7). The following symbolic meanings in equations are the same as those in Figure 1

The driving force of the crack initiation and propagation is the effective shear stress parallel to the crack surface. Considering the friction effect of the crack surface, we supposed that the friction coefficient of the crack surface is fn, the friction angle is φn, and then fn = tanφn. So, the effective shear stress was calculated as follows
According to the theory of fracture mechanics, 34 the stress intensity factors of crack tip type I and type II is KI and KII under the action of the compression shear stress, respectively, as shown in equations (9) and (10)


where a is the half of crack length (mm).
The initial crack strength of fractured rock mass under the joint action of the compression shear stress and seepage water pressure cannot be simply calculated according to the type I or type II crack. Therefore, the crack initiation criterion of composite cracks under compressive shear stress and seepage water pressure was shown in equation (11) 41

where λ12 is the compression shear coefficient and KIIC is the shear fracture toughness under compression. The initial crack strength of fractured rock mass was calculated as shown in equation (12)
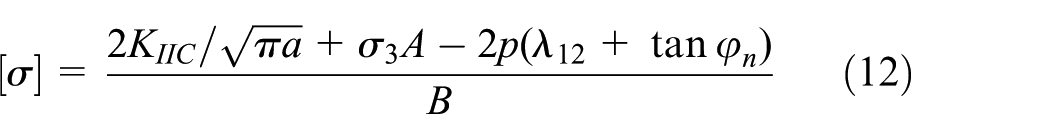
where
Effect of seepage water pressure on fracture characteristics
In equation (12), we took β = 45°, KIIC = 5.5 MPa m1/2, a = 10 mm, tanφn = 0.2, and λ12 = 1 and then calculated the evolution diagram of the initial crack strength, as shown in Figure 12. In Figure 12, the initial crack strength decreased with the increase in the seepage water pressure under the same confining pressure. Combining with the simulation results, when the confining pressure σ3 = 0 MPa, wing cracks were produced in the fractured rock by crack propagation, which required steps decreased with the increase in the seepage water pressure, that is, the wing crack initiation strength decreased with the increase in the seepage water pressure under σ3 = 0 MPa. When σ3 = 5 MPa and p = 0, 0.4, 0.8, and 1.2 MPa, anti-wing cracks were produced by crack propagation, which required steps decreased with the increase in the seepage water pressure; when p = 1.2 MPa, secondary coplanar cracks were produced, compared with p = 0, 0.4, and 0.8 MPa, which required steps were less. When σ3 = 8 MPa, secondary coplanar cracks were produced, which required steps decrease with the increase in the seepage water pressure, that is, secondary coplanar cracks initiation strength decreased with the increase in the seepage water pressure under σ3 = 8 MPa.
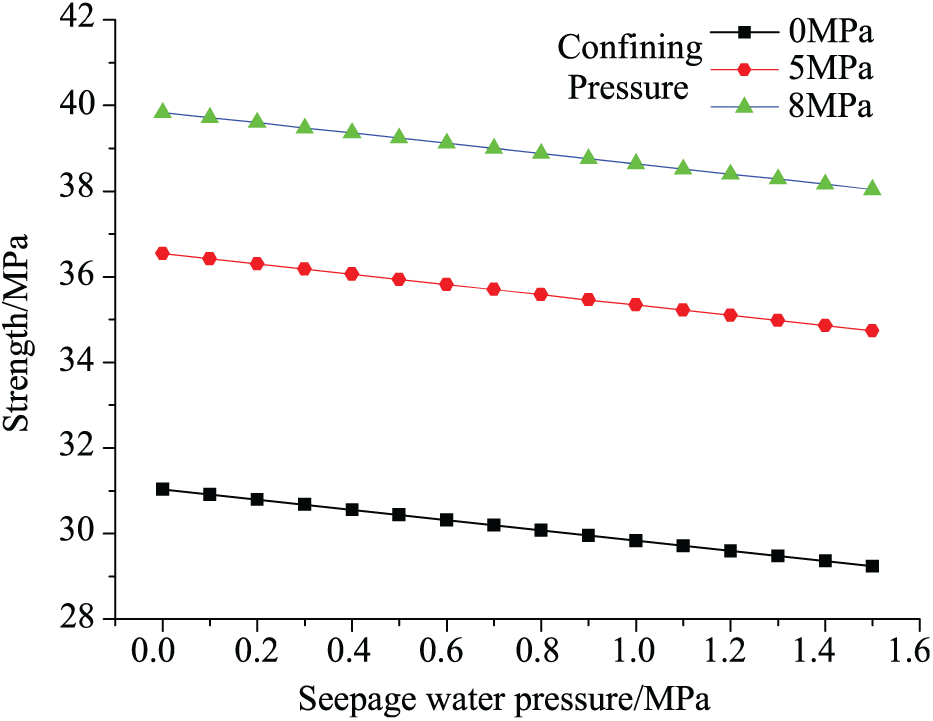
Relationship between the initial crack strength and seepage water pressure, confining water.
Effect of confining pressure on fracture characteristics
In Figure 12, the initial crack strength increased with the increase in the confining pressure, that is, the confining pressure had an inhibitory effect on crack initiation, which is consistent with the physical test results.42,43 Combining with the simulation results, with the increase in the confining pressure, the successive order of inhibition was wing cracks, anti-wing cracks, and secondary coplanar cracks. In other words, wing cracks were more easily to be initiated than anti-wing cracks and secondary coplanar cracks, which required less confining pressure. Anti-wing cracks were more easily to be initiated than secondary coplanar cracks.
Conclusion
In the numerical simulation, when the confining pressure σ3 is 0 MPa, wing cracks were produced in the fractured rock by crack propagating to the upper and lower boundaries of the model, which led to the longitudinal splitting failure model.
When the confining pressure σ3 is 5 MPa and seepage water pressure p is 0.4 or 0.8 or 1.2 MPa, anti-wing cracks were produced by crack propagation, which led to the upside-down capital letter “N”-type failure model. When the confining pressure is 5 MPa, seepage water pressure is 1.4 MPa, and the confining water 8 MPa, secondary coplanar cracks were produced by crack propagation, which led to the “—”-type failure model.
There exists the bifurcation phenomenon of wing cracks, anti-wing cracks, and secondary coplanar cracks under the seepage water pressure. When the confining pressure value is the same, with the increase in the seepage water pressure, the initial crack angle of wing cracks or anti-wing cracks increases.
In theoretical analysis, the initial crack strength increases with the increase in the confining pressure, and decreases with the increase in the seepage pressure, which are in good agreement with the experimental and numerical results in the literature. Confining pressure has an inhibitory effect on crack initiation. With the increase in the confining pressure, the successive order of inhibition is wing cracks, anti-wing cracks, and secondary coplanar cracks.
Footnotes
Handling Editor: Farzad Ebrahimi
Declaration of conflicting interests
The author(s) declared no potential conflicts of interest with respect to the research, authorship, and/or publication of this article.
Funding
The author(s) disclosed receipt of the following financial support for the research, authorship, and/or publication of this article: This work was financially supported by the Fundamental Research Funds for the Central Universities under Grant No. 2017BSCXA26, for which the authors are grateful.