
Abstract
Multistage fatigue tests were conducted on the single-edge-notch tension specimens of Ni-based superalloy GH4169. Fatigue crack growth data at different stages were recorded with the surface replica technique. Continuum damage mechanics incorporating critical distance theory was used to evaluate fatigue crack initiation life. Then, small and long fatigue crack grow rates were modeled using Shyam’s model and modified Paris law, respectively. Finally, the multistage fatigue model deriving from the above theories was proposed to predict total fatigue life of GH4169. Fatigue life prediction results show that the proposed multistage fatigue model has high accuracy for GH4169.
Introduction
The nickel-based superalloy GH4169 has microstructure and mechanical behaviors similar to Inconel 718. Because of advantages such as good formability, high performance/price ratio, and weldability, this material is widely used in aerospace, aviation, nuclear, and other industries. Since it has outstanding performance of high strength and high ductility over a large service temperature range, GH4169 is fabricated to modern aero-engine components, such as turbine disks, blades, and cases. The components made by GH4169 have a good resistance to fatigue, oxidation, and corrosion. For wide application in engineering, the mechanical properties and fatigue behavior of nickel-based superalloy have attracted the researchers’ attention.1,2 The research about the fatigue behavior and life prediction of GH4169, especially the modeling of total fatigue failure process, is of great significance in engineering.
The total fatigue failure process can be decomposed into several successive stages based on different fatigue mechanics. 3 Typical partition stages include the following four stages: fatigue initiation period, microstructurally small crack growth period, physically small crack growth period, and long crack growth period. Fatigue initiation refers to the lives of cracks’ nucleation and growth to a certain micro length. Microstructurally and physically small crack growth periods are always merged into one stage where the linear elastic fracture mechanics is unsuitable. 3 Long crack growth period refers to the lives of cracks’ growth from small length to the macro visible length. This stage can be described by linear elastic fracture mechanics. The stages mentioned above play different roles to evaluate fatigue safety for different points of focus. Lankford and Kusenberger 4 observed that the fatigue life was dominated by crack initiation stage for 4340 steels. McDowell 5 considered that the periods beyond the initial crack stage play an inconsequential role for the worst-case fatigue design. Therefore, in such situations, the theory predicting initiation life has attracted attention. Some other researchers focused on the study of small fatigue cracks’ growth.6–11 They concluded that the stages of fatigue crack initiation and small crack growth may take up about 70%–80% of the total fatigue life. And experimental observations show that small fatigue cracks grow more rapidly than long cracks under the same stress intensity levels. The typical models proposed to describe small fatigue crack growth rates include Hobson’s model, 12 Miller’s model, 13 Navarro–Rios’ model, 14 and Shyam’s model. 15 The last stage of fatigue failure process is considered as the long crack growth period. This portion is an important part of damage tolerance design and can be described with classical fracture mechanics. Although many works have been done corresponding to different fatigue crack growth stages of fatigue failure process, few models involving the total fatigue life prediction have been proposed. McDowell et al. 3 proposed a multistage fatigue model to predict total fatigue life of cast A356-T6 alloy. Then, this multistage model was successfully used in other materials including cast AE44 magnesium alloy, 16 high-strength aluminum alloy, 17 and aluminum alloy 7075-T651. 18 The multistage model proposed by McDowell can recognize multiple inclusion effects for crack formation. And the role of microplasticity around inclusion can be addressed. Although high prediction accuracy is obtained for the above research materials, it is inconvenient for practical engineering application. The premise of McDowell model is that the microstructure, such as dendrite cell size (DCS), maximum particle size, maximum pore size, maximum oxide size, proximity to the free surface, and average porosity level, should be measured or calculated first. 3 To some extent, this is difficult for actual components in service.
The objective of this article is to study the model to evaluate total fatigue life of notched specimens of GH4169. In this work, fatigue tests were conducted on the single-edge-notch tension (SENT) specimens of GH4169 first. Fatigue crack growth data at three successive stages were recorded with the surface replica (SR) technique. Then, the method based on continuum damage mechanics (CDM) and critical distance theory was used to predict fatigue crack initiation life. The stress gradient effects were considered in this section. Next, Shyam’s model and modified Paris law were chosen to fit small and long fatigue crack grow rates, respectively. Finally, the multistage fatigue model based on superposition principle was proposed to predict total fatigue life of GH4169. The incorporated multistage fatigue model depends only on the macro parameters (such as stresses and strains).
Materials and experimental results
The material chosen in this study was Ni-based superalloy GH4169. The material’s main chemical composition is given in Table 1. Heat treatments include the following three steps: (1) raising the temperature to 960°C and holding for an hour, and then air cooling to room temperature; (2) raising the temperature to 720°C and holding for 8 h, and then furnace cooling with a rate of 50°C h−1 to 620°C; and (3) holding the temperature at 620°C for 8 h and air cooling to room temperature. Typical microstructure of GH4169 material is shown in Figure 1. In Figure 1, the small red arrowheads indicate the second-phase particles which locate around the grain boundaries. The commercial image processing, enhancement, and analysis software (Image-Pro Plus) was used to calculate the grain size. The equivalent grain size is defined as the diameter of a circle which has the same area as the selected grain. The equivalent grain size of GH4169 is about 9–24 µm. The average grain size is about 16 µm. The SENT specimen was designed for multistage fatigue tests based on ASTM STP 1149. 19 The detailed configuration and dimensions of SENT specimens are presented in Figure 2. A servo-hydraulic MTS testing system was used for the axial tensile fatigue tests. All fatigue tests were conducted under a stress ratio of R = 0.1 at room temperature. Sinusoidal waveforms with frequency of 10 Hz were selected as the loading conditions. Three different nominal maximum stresses σmax, that is, 350, 380, and 410 MPa, were chosen for fatigue tests. The SR technique was used to record multistage fatigue process. Fatigue tests were interrupted periodically and the specimens were held under 80% constant tensile load to maintain crack mouth opening and then the surface of interest was replicated. The crack initiation and growth behaviors were obtained by observing the SR with optical microscope. Figure 3 shows the typical multistage fatigue process (specimen no. 4) including crack initiation and growth stages. The details of small fatigue crack initiation mechanisms and crack growth behaviors have been published in a research article. 6 The results show that fatigue cracks initiated from the grain boundaries or surface inclusions. 6 The fatigue test results are summarized in Table 2.
The main chemical composition of GH4169 (wt%).

Fatigue test results of GH4169.

SR: surface replica.
Nf, Ni, and Np are the total fatigue life, crack initiation life, and crack growth life, respectively.

Typical microstructure of Ni-based superalloy GH4169 (500×).

SENT specimen configuration and dimensions (unit: mm).

Multistage fatigue process including crack initiation and growth: (a) N = 30,000, (b) N = 65,000, (c) N = 70,000, (d) N = 92,000, (e) N = 95,000, and (f) N = 103,000.
Theoretical basis
CDM-based model for fatigue crack initiation
Fatigue damage is considered to correlate with stress levels and number of load cycles. The following two assumptions have been proposed: 20 (1) fatigue damage occurs while the stress levels exceed the fatigue endurance limit, Se, and (2) fatigue damage occurs while the system is loaded, and damage does not occur while the system is unloaded. Therefore, the fatigue damage Di at the end of load cycle i can be calculated with the initial damage Di−1 and the increment damage ΔDi

It is noteworthy that equation (1) has similarities with Miner’s rule. However, equation (1) shows more real for actual service situation. The increment damage ΔDi in the CDM formulation does not need to be equal during each cycle under the same stresses or strains. Crack initiation occurs when the accumulative damage reaches the critical value Dc

Through complex mathematical derivation, Bhattacharya 20 and Bhattacharya and Ellingwood 21 obtained the formulation for calculation fatigue damage based on CDM concept. The final form of the equation to calculate fatigue damage for tension–compression fatigue (stress ratio R < 0) had been provided in Bhattacharya 20 and Bhattacharya and Ellingwood’s 21 work. With slight modification, Bhattacharya’s formulation can be used to predict fatigue damage under tension–tension fatigue (stress ratio R > 0). The differential equation of fatigue damage in cycle i is as following

where Δεp denotes the plastic strain range, Δεpli is the initial plastic strain range, Δεoi is the threshold plastic strain range, σf is the true fracture strength, and K′ and M′ are the cyclic hardening modulus and exponent, respectively. Using the initial condition D = Di at Δεp = Δεpmi and D = Di−1 at Δεp = Δεoi, the damage at the end of cycle i can be obtained by integrating equation (3)
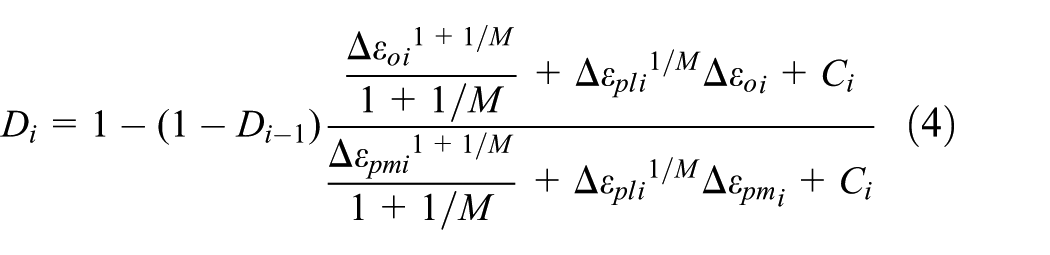
where


where Se denotes the fatigue limit. σmax and σmin are the maximum stress and the minimum stress, respectively. Equations (4)–(7) provide the formulations to calculate fatigue damage Di in cycle i. When the fatigue damage Di in cycle i has been obtained, the crack can be judged to be initiated or not with the criterion in equation (2). In equations (2) and (4)–(7), the critical damage value Dc, the maximum stress σmax, and the minimum stress σmin should be determined first.
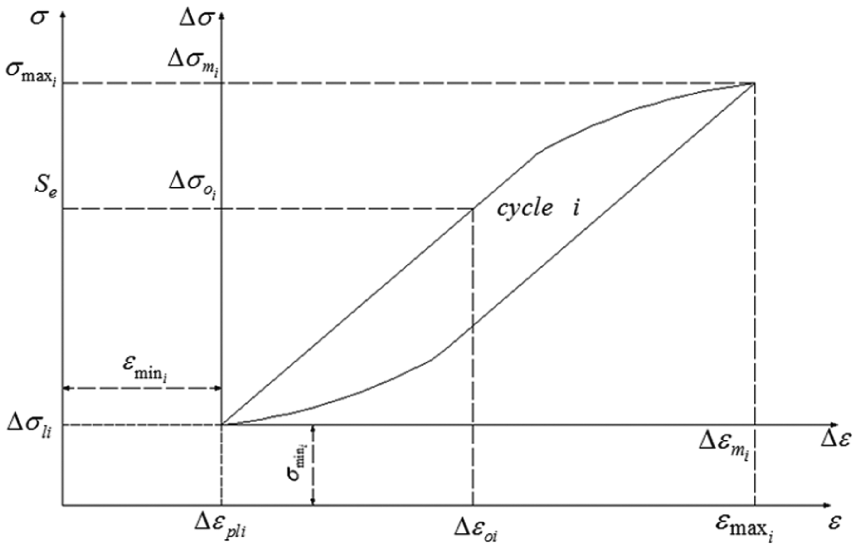
Illustration of defined parameters in equation (4).
Fatigue critical damage Dc is considered as an intrinsic material parameter in CDM subjects. 22 It is worth noting that fatigue damage Di accumulating to critical value Dc does not mean the material is completely fractured. It indicates that a microcrack is initiated and materials’ discontinuity appears under cyclic loading condition. In CDM, no distinction between fatigue failure and static strength failure may be supposed. Failure may occur when the material degradation occurs to a critical value. This hypothesis inspires that the monotonic test can be used to estimate critical damage for fatigue loading condition. In this work, Dc was obtained by conducting a simple static tension test. The mathematical value of Dc is the damage obtained under uniaxial fracture stress (that is, fracture strength σf). Under uniaxial tension loading condition, equation (3) can be changed into the following form 20

The relationship between damage variable and strain parameters under uniaxial tension loading condition can be obtained by integrating equation (8)

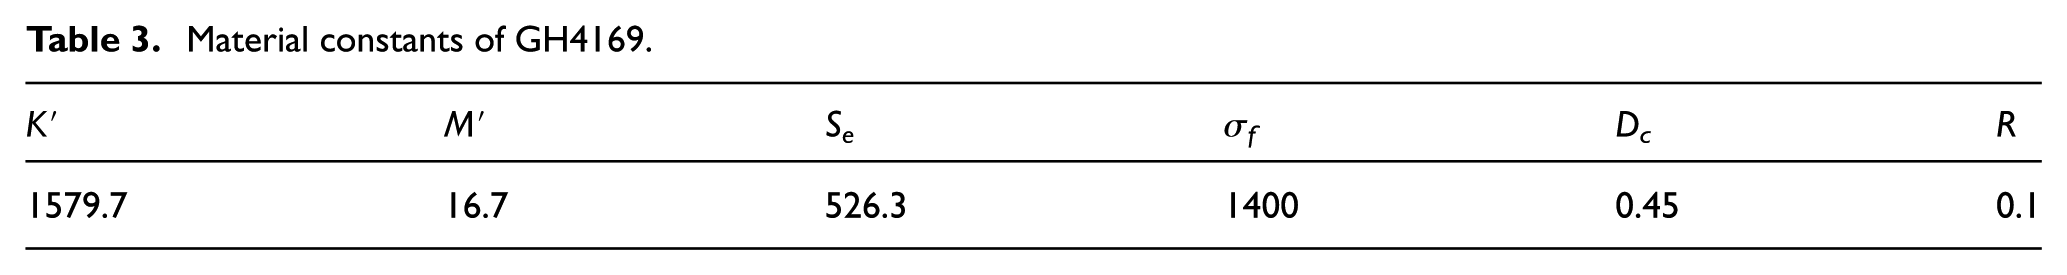
The fatigue critical damage Dc can be calculated using equation (9). The variables ε0 and εp in equation (9) can be obtained with Ramberg–Osgood equation by replacing stress with fatigue limit Se and fracture strength σf. The material constants of GH4169 in equations (2) and (4)–(7) are summarized in Table 3. Until now, the only work to evaluate fatigue damage Di in cycle i is the determination of maximum stress σmax and the minimum stress σmin in equations (5)–(7).
Material constants of GH4169.
The commercial finite element analysis software (ANSYS) was used to simulate distributions of stress at the notch root. Multi-linear kinematic hardening model was chosen to describe the cyclic stress–strain curve of GH4169. The finite element meshes and material constitutive model are shown in Figure 5. The axial stress nephogram under three different loading conditions (350, 280, and 410 MPa) is shown in Figure 6. The axial stress distributions along the normal direction of the notch root are given in Figure 7. The axial stress reduces significantly within a short distance of notch root. Large gradient exists in the cross section of specimen. In Figure 7, the quartic polynomial as following was used to describe the axial stress distribution

where P0–P4 are the fitting parameters, and they are summarized in Table 4.

The finite element meshes and material constitutive model of GH4169.

The stress nephogram under three different loads: (a) 350 MPa, (b) 280 MPa, and (c) 410 MPa.
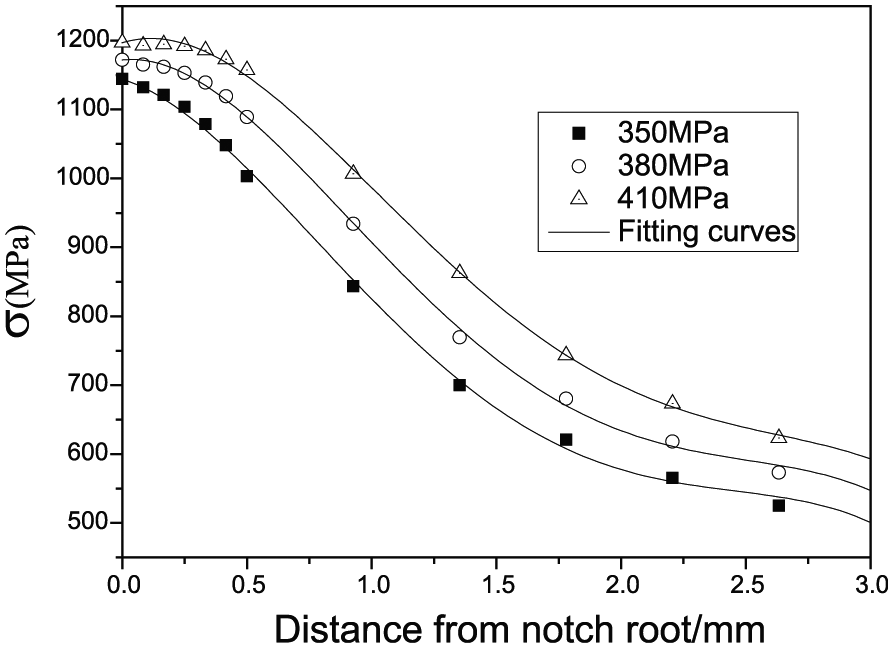
The stress distributions along the normal direction of the notch root.
Fitting parameters of the axial stress distribution.

Large errors will occur only if local stress at the notch root is chosen to predict fatigue initiation life. The effect of stress gradient on fatigue damage should be considered. In this research, one of the critical distance approaches called point method is selected to account for the effects of stress gradient. The basic hypothesis of the point method is illustrated in Figure 8. The stress at a critical point is used to correlate fatigue initiation life. 23 σeq in Figure 8 is the equivalent stress. r* is the critical length. The σeq and r* satisfy the relationship of equation (10). The calculated fatigue initiation life Ncal can be obtained using equations (4)–(6) by replacing σmax and σmin with σeq and σeq·R. Therefore, Ncal is related to the critical length r*. The value r* can be obtained by satisfying the following equation

where Nexp is the experimental initiation life. The values of critical length r* under different stress levels are summarized in Table 5. It can be concluded that the critical length r* is related to applied maximum stress (Figure 9). The relationship between the critical length r* and the applied maximum stress can be described with the power function as following

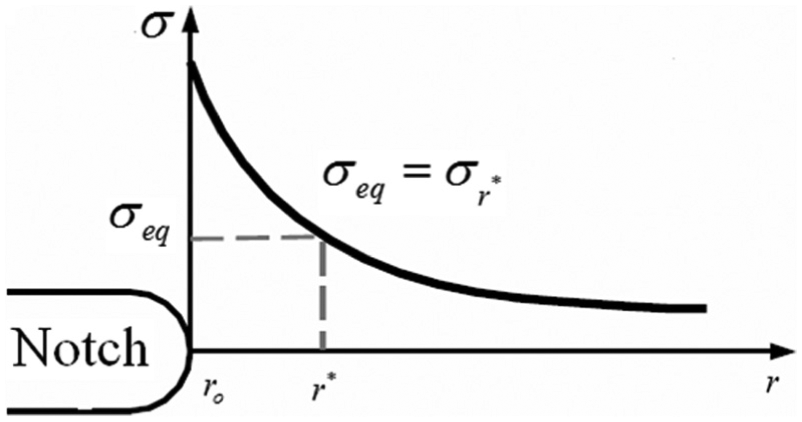
The illustration of point method in critical distance approaches.
The values of critical length r* under different stress levels.


The relationship between the critical length r* and applied maximum stress.
where a and b are the fitting parameters. The values of a and b are 1.535 × 10⁻⁶ and 2.3, respectively. For explicit statement, the calculation steps are summarized as follows. First, the critical length r* can be calculated using equation (12). Then, the equivalent stress σeq can be obtained using equation (10). Finally, the fatigue initiation life can be predicted using equations (4)–(6) by replacing σmax and σmin with σeq and σeq·R. The predicted results of fatigue initiation life under three different stress levels are shown in Figure 10 and are summarized in Table 6. The results show that the proposed approaches have high accuracy to evaluate fatigue initiation life for GH4169. The errors between prediction results and test results were controlled below 10%.

The relationship between the fatigue damage and number of cycles.
The prediction results of fatigue initiation life for GH4169.

Shyam’s model for small fatigue crack growth
Shyam and colleagues15,24 proposed a general, dislocation-based small fatigue crack growth model. Shyam’s model can describe the effects of temperature, stress–strain ratio, microstructure, and so on. 15 Two assumptions of Shyam’s model are as follows: (1) cyclic plasticity at the crack tip causes the irreversible fatigue damage and (2) fatigue cracks extend while the damage accumulates to a critical value. Based on these considerations, the product of monotonic and cyclic crack tip displacements was chosen as the drive force of small crack growth in Shyam’s research work. The monotonic crack tip displacement ϕm based on Bilby, Cottrell, and Swinden (BCS) theory can be expressed as follows15,24,25
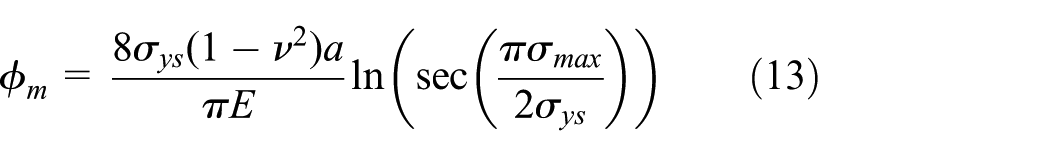
where σys denotes the yield stress. ν and E are the Poisson’s ratio and Young’s modulus, respectively. 2a is the surface crack length. σmax is the applied maximum stress. For cyclic loading condition, the cyclic crack tip displacement ϕc has a similar form15,24

where R is the stress ratio.
The small fatigue crack growth rate was considered to associate with the monotonic and cyclic crack tip displacements. The relationship can be described with power function as the following form 15

where κ and m are the material constants. (da/dN) SC is the small crack growth rate.
The surface crack length 2a and the number loading cycles N were obtained in fatigue tests. The small cracks with length of 0–300 µm were taken out for model establishment. The values of

Equation (16) is then used to predict small fatigue growth life by integral method.

Prediction results of Shyam’s model for GH4169.
Modify Paris law for long fatigue crack growth
The long fatigue crack growth data used for model building were quoted from literatures of Liang 26 and Zhang and Wu. 27 The standard compact (CT) specimens were used to conduct fatigue crack growth tests in Liang 26 and Zhang and Wu. 27 Fatigue data under different stress ratios were selected to formulate the long crack growth law. The stress ratios included 0.1 and 0.5 in Liang 26 and 0.1, 0.3, and 0.5 in Zhang and Wu. 27 The variation curves between fatigue crack growth rate da/dN and stress intensity factor range ΔK under all loading conditions are plotted in Figure 12. There exists certain dispersivity in long fatigue crack growth data under different stress ratios. The effects of fatigue crack closure should be considered.

Variation between fatigue crack growth rate da/dN and stress intensity factor range ΔK.
Under certain stress ratio, the Paris law based on linear fracture mechanics is always used to describe long fatigue crack growth rate

where C and n are the material constants. The stress intensity factor range ΔK in equation (17) was substituted by the effective stress intensity factor range ΔKeff to describe fatigue crack closure effects. The modified Paris law was used to illustrate the long fatigue crack growth

where A and m are the material constants. The effective stress intensity factor range ΔKeff is defined as

Substituting equation (19) into equation (18), equation (18) has the following form

where the closure factor U = 0.5 + 0.4 R. 28 The prediction results of long fatigue crack growth rate for GH4169 based on the modified Paris law are shown in Figure 13. The fitting results are provided as follows

The long fatigue crack growth data under different stress ratios in Figure 13 locate roughly in a straight line. It means that the selected modified Paris law has the abilities to predict long fatigue crack growth rate under different stress ratios.

The prediction results for GH4169 based on the modified Paris law.
The stress intensity factor calculation method for the researched test specimens was referred from Wu et al. 29 and Newman 30


where Q is the crack shape factor. Fsn is the boundary-correction factor. The details of calculation of g1, g2, g3, g4, fϕ, fw, M1, M2, and M3 can be found in Wu et al. 29 and Newman. 30
Multistage fatigue life prediction model for total fatigue damage process
The fatigue failure process is always divided into four consecutive stages that are fatigue crack initiation state (INI) NINI, microstructurally small crack growth stage (MSC) NMSC, physically small crack growth state (PSC) NPSC, and long crack growth state (LC) NLC. The multistage fatigue failure can be described using the following model3,17,18,31

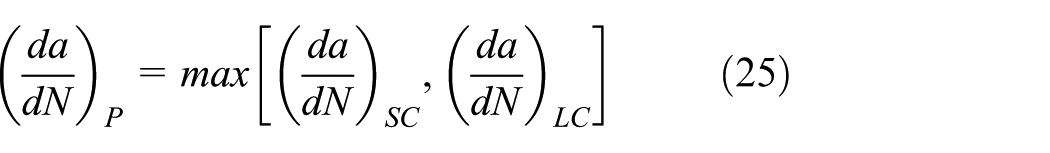
where NTotal is the total fatigue life. For simplicity, the stages of MSC and PSC are considered as one stage which can be described with the same mathematical form. The methods to predict fatigue lives of the initiation stage, small crack growth stage, and long crack growth stage have been proposed above. The length of small fatigue crack was defined between 16 and 300 µm. The crack size of MSC is similar to the grain size. 32 Considering the minimum accuracy of experimental observation, the initial length of small crack was approximately defined as the average grain size of 16 µm. The transition point from small to long crack is very difficult to determine. The cross point of small and long crack growth curves was defined as the transition point in McDowell et al.’s 3 work. These results were obtained based on the experimental observation. Actually, the microstructures of different specimens are slightly different. Therefore, the transition point positions may be different for different specimens. McDowell et al. 3 focused on the microstructure of the given specimen and provided the transition point from small to long crack. This work has very important scientific significance. The starting point of this article is focus on engineering application. If different transition points are defined for different specimens, it is difficult to apply in engineering. The reason is that a general law for different specimens is not formed. Generally, the initial length of long crack is defined as the length observed by naked eyes or other nondestructive testing equipment. Therefore, 300 µm defines the final length of small crack for visually visible reason. The length of long fatigue crack was defined between 300 and 2500 µm. At the early crack growth stage, high fluctuations appeared in the small growth rates. The small crack growth rates may be higher or lower than long crack growth rates under the same drive force. Considering the most dangerous situation, the maximum of either of the two rates (SC and LC) had been selected as the crack growth laws 3
The multistage fatigue life prediction results are summarized in Table 7. The formula for error analysis between prediction total fatigue lives

The prediction results of total fatigue life for GH4169.

The results in Table 7 show that the proposed method has high accuracy to predict total fatigue life of GH4169. The maximum error for the researched tests is only 13.3%.
Conclusion
Multistage fatigue tests were conducted on the SENT specimens of GH4169. Fatigue crack growth data at different stages were recorded with SR technique. Then, the multistage fatigue model was proposed to predict total fatigue life. The major conclusions are summarized as follows:
Stress gradient effects have been considered in predicting initiation fatigue life for GH4169. CDM incorporating the critical distance theory provided an effective method to evaluate initiation fatigue life.
Shyam’s model and modified Paris law can be used to predict small and long fatigue crack growth rates, respectively. For high fluctuations appearing in small growth rates, a competition mechanism of small and long fatigue crack growth rates has been introduced.
The hypothesis that the total fatigue failure process is divided into three main stages based on crack behaviors is reasonable. The selected linear superposition model to predict total fatigue life had high accuracy for SENT specimens of GH4169.
Footnotes
Handling Editor: Jining Sun
Declaration of conflicting interests
The author(s) declared no potential conflicts of interest with respect to the research, authorship, and/or publication of this article.
Funding
The author(s) disclosed receipt of the following financial support for the research, authorship, and/or publication of this article: This work was supported by Startup Foundation of Nanjing University of Aeronautics and Astronautics in China.