
Abstract
References for theory analysis, quality prediction, and automatic control can be provided by testing the displacement variation of the media in mass finishing process with the parallel spindle using CCD laser displacement sensor, calculating the whole velocity and impact velocity of the media on workpieces, and then finding the distribution law of the media velocity. The media velocities under different test conditions were analyzed, and the probability distribution curves of the whole velocity and impact velocity were drawn accordingly. It is found that the whole velocity increases with increasing rotation speed of the drum or being far from the drum rotation center. But the effect of rotation speed of the drum on impact velocity is not significant. The media velocity is insensitive to the finishing depth inside the media. The probability density distribution of the whole velocity and impact velocity is not consistent at each sampling point. The majority obey the Gauss distribution and the extreme value distribution. The extreme value distribution of the media increases with the increase in the rotation speed, illustrating more intense dispersion of the test data and wider coverage of the media velocity.
Introduction
At present, the mass finishing technique has been widely used for the surface finishing of parts in various industries,1–5 such as aerospace, automobile, wind power, machinery, ships, and other industries. As a kind of typical finishing technique, it can change the geometric features, improve the physical and mechanical properties, and make a comprehensive improvement in surface integrity of the workpiece by the micro-grinding of impacting, rolling, rubbing, and scratching. For example, vibratory finishing is a versatile process that can be used in many industries for radiusing, brightening, deburring, cleaning, burnishing, and descaling.1,2,5
The kinematic characteristic research of the mass finishing process has been focused on the media force and velocity. A Boschetto and F Veniali 6 applied a particle image tracking technique to a transparent thin barrel in order to acquire the position of the workpiece in barrel finishing, and the achieved trajectories can be used to calculate and analyze the total sliding and finishing efficiency. The two main research methods for the media velocity measurement are image velocimetry and charge coupled device (CCD) laser distance sensor. E Fleischhauer et al. 7 have tested the media velocity in the vertical vibratory finishing process by image velocimetry method, and the whole velocity field of the media flow was statistically obtained. It was found that the media showed periodic motion in non-random and large scale under the dominant effect of vibration force. K Hashemnia et al. 8 have lapped the test platform using CCD laser distance sensor and measured the media flow velocity and impact velocity in the horizontal vibratory finishing process. It was found that the impact velocity was greatly affected by the direction of the sampling point, the density, and elastic properties of the media, while less affected by the whole velocity and the bulk density. It was also found that the average impact velocity of ceramic media was bigger than that of steel media. Subsequently, the simulation analysis of the media motion by three-dimensional discrete element method was made under the same experimental condition, and the finite element continuous model was established by combining hydrodynamics. To verify the reliability and find the influence of the simulation parameters on velocity results, the calculation results of the whole velocity and impact velocity were compared to the experimental results.9,10 In addition, some scholars have obtained the media velocity by other indirect methods. D Ciampini et al. 11 deduced the relation between the velocity and force by the force acting on the workpiece after free fall of object, measured the force of the media acting on the workpiece, and derived the media velocity for the vibratory finishing process. J Domblesky et al. 12 connected a nylon rope with a diameter of 0.39 mm at one end to the media and calculated the media instantaneous velocity by its motion time and length of nylon rope. Some research developed media kinematic model of vibratory finishing and barrel finishing, and motion rule was verified by a digital video recorded by a high-speed camera.13,14 Almen system and force sensor testing system were also used in mass finishing, such as vibratory finishing and spindle finishing, to analyze finishing mechanism, influencing rules and parameter optimization, and these can provide supports for process development and process control.15–17
Some scholars abroad also studied the motion velocity of the granular media in the other finishing processes.18–20 DJ Parker et al. 18 studied the media motion in the drum by measuring the velocity of individual particle with radioactive positron tracer particle and restoring its trajectory. The obvious delamination between the active and resting layers of the media motion was found and the corresponding law was investigated. Moreover, the influence of rotation speed, drum size, media size, and other factors on the velocity was analyzed. JZ Liu et al. 19 tested the local instantaneous solid density and media velocity in the multiphase flow using three groups of parallel optical fibers, and the effect of dead zone on fiber performance and linear velocity is proved according to the corresponding mechanical model. The fiber optic reflectance of different sizes and calibration results are successfully predicted.
It can be seen that more researches abroad have been done on the rule of media motion during the vibratory finishing, and less during the spindle finishing. In China, the velocity measurement of small-size particles is mostly applied to multiphase flow of solid, liquid, and gas,21–24 while the media velocity is mostly concentrated on theoretical analysis and simulation study in the mass finishing process.1,3 SM Ji and collegues25,26 established a Johnson–Cook elastoplastic material model combining the machining mechanism of abrasive flow finishing and studied the relation between the media impact velocity and the abrasion loss, impact times and wear rate, and further proposed an improved soft abrasive flow finishing method. The kinematic mechanism and distribution characteristics of the media in centrifugal finishing and spindle finishing were analyzed according to theory analysis and discrete element simulation by authors.27,28
C Yang et al.29–31 proposed some methods for improving control performance of telerobot control system, such as neural network (NN)-enhanced telerobot control system, combined the radial basis function (RBF) NNs and wave variable technique, a variable gain control algorithm involving surface electromyogram, and so on. From the actual processing point of view, the media displacement variation in the parallel spindle finishing process was tested with the workpiece position and rotation speed of the drum as preferential machining parameters based on the platform of CCD laser displacement sensor, the corresponding velocity algorithm was designed, and the waveform identification and velocity calculation of displacement signals were carried out. It can provide instructions for the theory analysis, quality prediction, automatic control, and actual finishing process by describing quantitatively the effect of different processing parameters on the media velocity in the parallel spindle finishing process.
Experimental procedure
Test platform and principle
As shown in Figure 1, the testing platform is composed of a parallel spindle finishing machine, a CCD laser displacement sensor system, and fixing device. Two laser displacement sensors were selected in this platform. Only one sensor is shown in Figure 1(a), and the fixed structure of the sensor in the isolating pipe is indicated by Figure 1(b).
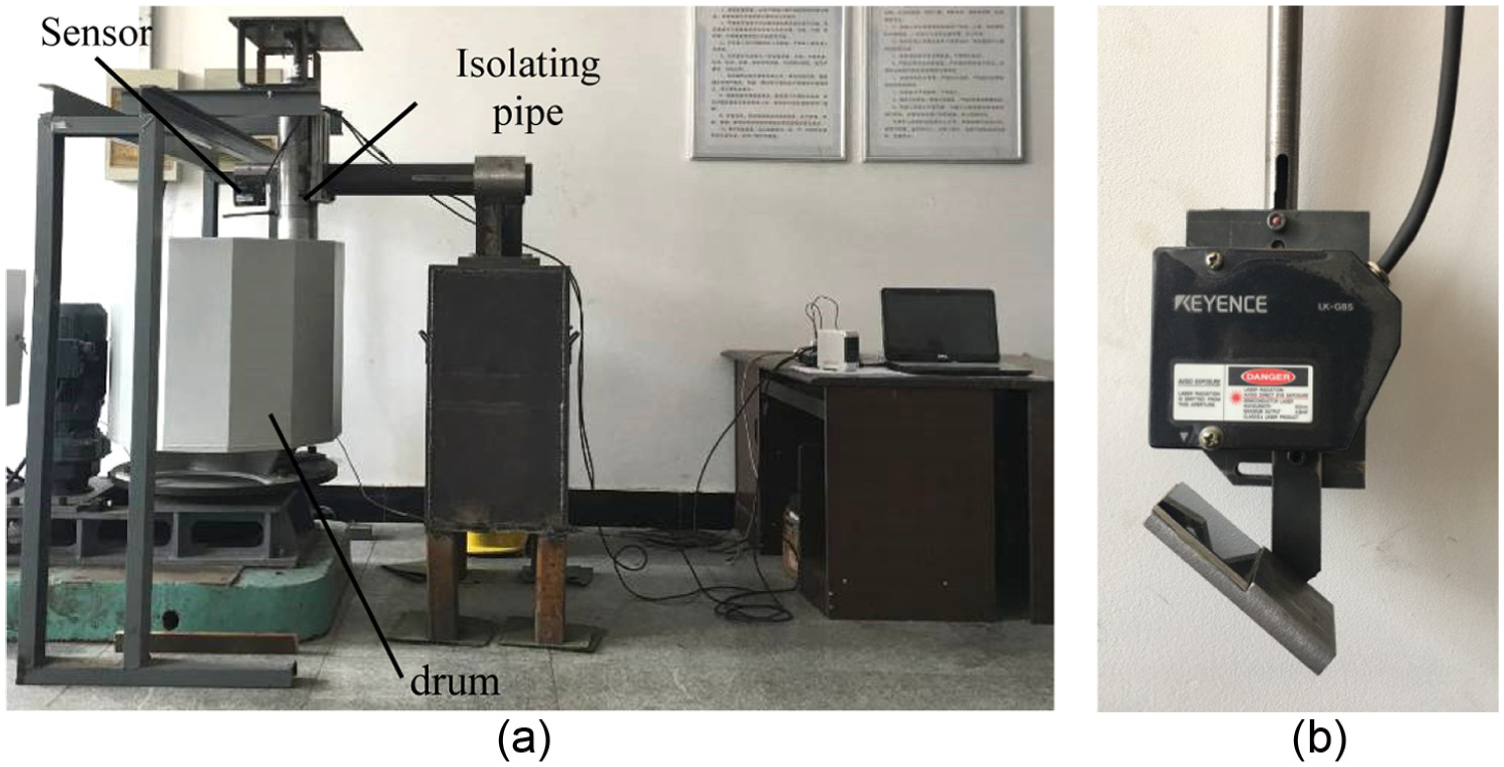
Media velocity test platform: (a) test platform and (b) CCD laser displacement sensor.
The effective depth, inscribed circle diameter, and default rotation speed of the drum of parallel spindle finishing machine are 600 mm, 700 mm, and 30 r/min, respectively. Spherical brown corundum media with the diameter of 3 mm, density of 2675 kg·m−3, and load of 60 % were used in the experiment. Two sensors with type LK-G85 and LK-G155 (Keyence Company) were used in the CCD laser displacement sensor system, and the specific parameters are listed in Table 1.
Parameters of CCD laser displacement sensors.

The sensor with type LK-G155 used for media displacement variation measurement was simply named as 1# sensor, and 2# sensor with type LK-G85 was used to test the vibration change of the isolating steel pipe. As can be seen from Figure 2(a), the 1# sensor extends into the isolating pipe with an inner diameter of 60 mm, and being not in contact with the isolating pipe or the media in order to effectively maintain a state without vibration disturbance in the processing. A round glass window with a diameter of 150 mm is arranged at the bottom of the isolating pipe for the purpose of measuring the media velocity passing through the bottom of the isolating pipe.

Principle schematic diagram of media velocity testing: (a) vertical direction and (b) horizontal direction.
Three glass windows (25 mm × 35 mm) are set on the side wall of the isolating pipe at the right direction of the media flow with 90° apart. Reflected laser from the steel mirror with 45° tilt was used to measure the media velocity passing through the isolating pipe (Figure 2(b)). The steel mirror was directly connected to 1# sensor through a 10-mm-diameter steel bar to avoid the effect of media vibration. Only the corresponding glass window is displayed on the side wall of the isolating pipe in order to show clearly the steel mirror structure in Figure 2(b).
The vibration noise will inevitably be mixed in the signals collected by 1# sensor when the isolating pipe plunges into the media. So, it is still necessary to investigate whether the vibration amplitude of the glass window is sufficiently obvious relative to the media and the vibration affects the partial motion of the media although the vibration does not affect the impact and the laser reflection of the media.
Now that the glass window will be in the media during processing, and the 2# sensor cannot be directly used to measure the window vibration. It is necessary to find the vibration relation between the window and the isolating pipe which is fixedly connected with each other. The 2# sensor needs to be fixed outside the media and horizontally transmit the laser to the isolating pipe in order to measure the window vibration on the side wall of the pipe (Figure 2(b)), while vertically transmitting the laser to the steel bar for the purpose of measuring the window vibration at the bottom of the isolating pipe (Figure 2(a)).
Measurement content
The five locations were selected as sampling points according to different distances of CCD laser displacement sensor to the center of the drum and depths of the workpiece into the media. The schematic diagram of sampling points in media velocity test is shown in Figure 3.

Schematic diagram of sampling points in media velocity test: (a) sampling point locations and (b) direction of sampling point.
As shown in Figure 3(a), the rotating center and the radial direction of the drum are taken as the vertical axis and the lateral axis, respectively. The coordinate of each sampling point is set as (X, Y). Here, X represents the vertical distance from the sampling point to the rotating center of the drum and Y represents the vertical distance between the sampling point and the free surface of media flow in the processing. For the convenience of plotting, Y′ is set as the vertical distance from sampling point to the drum bottom. In Figure 3(a), the dashed doubled-dot represents the free surface of media flow in the processing.
Taking into account the force direction, four directions are selected at circumferential direction of each sampling point as shown in Figure 3(b). In general, the media is collided head-on in position 1 on the workpiece surface and then passes through the workpiece side from position 2 and position 3, and finally and partially through position 4 of the back of workpiece.
It should be noted that each sampling point indicates the window center of the isolating pipe. Due to bigger outer diameter of the isolating pipe (i.e. 120 mm), the coordinates of the glass window in different positions at the same location vary considerably. So, the measured coordinates of sampling points are listed in Table 2, not to be neglected.
Coordinates of sampling points in media velocity test.

Sampling points from 1 to 4 represent four positions, respectively. For example, A1 represents position 1 of sampling point A, that is to say, the sampling point A directly opposite to the media flow, and so on, for other sampling points.
The rotation speed of 30 r/min is selected for the above sampling points in the experiment. Keeping the other same conditions, the comparison experiments were carried out in sampling point E with rotation speed of 20 and 40 r/min. They are named as E-20 and E-40, respectively.
Algorithm of the media velocity
Vibration signal analysis of the glass window
In order to study the vibration of the isolating pipe caused by the media impact, the glass window was sealed with an opaque rubberized fabric in the sampling point A1 position. 1# sensor tests the window vibration, and 2# sensor tests the vibration of position 1 of the isolating pipe. The frequency spectrum analysis of test signals by MATLAB programming is presented in Figure 4.

Vibration displacement signal and its frequency spectrum of A1: (a) origin signal (time-domain) and (b) frequency spectrum (frequency-domain).
From the result of the time-domain analysis, the vibration amplitude of the isolating pipe is obviously slower than that of the glass window. It is found that the amplitude of the glass window is only 1.3 times that of the isolating pipe by statistical mean values, and the maximum amplitude is only 0.04 mm, but the vibration is much denser than that of the latter.
The vibration frequency of the isolating pipe is concentrated below 15 Hz by frequency-domain observation. The glass window has more distinct peaks near the 20 and 35 Hz on the basis of the vibration frequency of the isolating pipe. High-frequency vibration of the glass window may be caused by periodic rotation of the drum with rotation speed of 30 r/min, while this phenomenon is not obvious in the whole vibration frequency of the isolating pipe.
To sum up, the vibration signal of the isolating pipe does not completely cover that of the glass window due to the vibration amplitude and frequency of the latter are higher than that of the former.
The vibration signal of the isolating pipe and displacement signal of media motion of A1 are presented in Figure 5. From Figure 5(a), the vibration signal of the isolating pipe is almost a straight line near a zero value, compared to the displacement signal of the media. Although the vibration amplitude of the isolating pipe itself is lower than that of the glass window with a value far smaller than 0.5 mm, it is still difficult to reach the peak value or valley value of the displacement signal of the media. Therefore, in order to facilitate the analysis, the vibration signals of the isolating pipe are equivalent to those of the glass window.

Vibration signal of the isolating pipe and displacement signal of media motion of A1: (a) whole signal; (b) partially amplified signal of 6.5–7.5 s; (c) partially amplified signal of 7.0–7.2 s; (d) smoothing results of (c).
Calculation of whole velocity of the media
The sketch of laser beam reflection from the media passing the glass window is shown in Figure 6. The laser from CCD laser displacement sensor is transmitted to the surface of the media and is reflected back to the receiver as the media passes through the glass window. However, there are unavoidable gaps among the media. When the laser is launched into the gap, it is very likely that it cannot be reflected back to the receiver, which can be verified from Figure 5(a). The valley values of most displacement signals for the media are above −3 mm, but at least 12 times of the laser are not effectively reflected back. The partial enlarged view of the displacement for 6.5–7.5 s is shown in Figure 5(b). Three laser reflections near 6.9 and 7.4 s are not observed. It may be due to the laser emission into the gaps of the media. In fact, the laser can also only be effectively reflected in the central position of the media diameter length. Each wave peak reflects the curvature of the media spherical surface, and all the peaks are obviously uneven. This indicates that the media surface is not uniformly reflected by the laser.

Sketch of laser beam reflection from the media passing the glass window.
The analytical sketch of available laser beam reflection length in a diametral plane of single media passing the glass window is presented in Figure 7. The effective reflection length S is calculated as follows
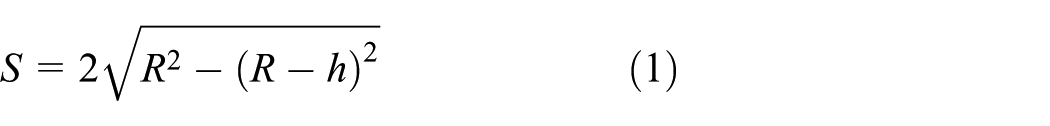
where R is the abrasive radius and h is the difference between the peak and the valley in the waveform effectively reflected by single media.

Analytical sketch of available laser beam reflection length in a diametral plane of single media passing the glass window.
The h value of single media can be clearly expressed as at least above 0.5 mm by comparing each waveform in Figure 5(b). Assuming that all laser beams can be effectively reflected to the receiver, the maximum value of h shall be not more than 1.5 mm, which is the radius of the media. It is found that the h values of a large number of waveforms exceed 1.5 mm, but in this kind of waveforms, single media can be clearly shown from the section that the h values are not more than 1.5 mm. Therefore, the effective waveforms with the h value over 0.5 mm are selected, and the whole velocity of the media can be calculated by calculating the S value and its time t, respectively. The corresponding calculation formula is as follows

where
Calculation of the impact velocity of the media
The partial enlarged view of 7.0–7.2 s is shown in Figure 5(c). There are many waveforms with different sizes, and the influence of jitter error on the waveform can be observed obviously. The results by MATLAB curve smoothing are shown in Figure 5(d). The jitter effect has been obviously eliminated, and five waveforms can be obviously observed.
Taking the waveform near 7.1 s as an example, the impact velocity of the media is calculated by selecting the left slope of the waveform. Because the h value of left slope is more than 1.5 mm, the position of 1.5 mm distance to the peak value is selected as the starting point of impact velocity calculation. The slope between the starting point and the peak is considered as valid waveform, Δt represents the time between the starting point and the peak, and the impact velocity of the media is calculated by 0.6Δt section of the total length of valid waveform truncated from the starting point.4,5 When the h value of the left slope of the selected waveform is not more than 1.5 mm, the impact velocity of the media is calculated by choosing the 0.6Δt section of the total length beginning from the valley, where Δt represents the time between the valley and the peak. Effective waveform recognition and impact velocity calculation are done through MATLAB programming.
Results and analysis
The workpiece directly facing the media flow is mainly subjected to the impact, while mainly rubbed on both sides and the bottom. As can be seen from Figure 8 of the motion status of A1 in processing, the media impact against the isolating pipe and rub through its both sides. Therefore, it is easier to describe the impact velocity by the displacement signal facing the media flow and to reflect the whole velocity from the signals of both sides. For verification purpose, taking the sampling point A as an example, the calculation results of the whole velocity and impact velocity in each location of this point are listed in Table 3.

Motion status of A1 in processing.
Whole velocity and impact velocity of the media in each directions of point A.

The numbers in parentheses in Table 3 indicate the number of waveforms that can be effectively identified based on the above calculation method. As shown in Table 2, the distance from position A2 to drum center is the farthest (180 mm). Followed by A1 and A4, both are 120 mm. The nearest distance for A3 is 60 mm. Hence, the whole velocities of A1 and A4 should be between A2 and A3, but that of A4 is obviously accord. The reason is that there are little media passing through position A4, and the data here based on the number of valid verification waveforms are rather abnormal. Probability density distributions of the whole velocity of A2 and A3 are shown in Figure 9. The fitted curves of A2 and A3 are all Gaussian distribution, and that of latter is obviously better than that of A2. The expected value of the whole velocity at A3 is 80 mm/s, which is closer to the average value of 81.8091 mm/s. The expected value of the whole velocity at A2 is 110 mm/s, which is not close to the average value of 97.6992 mm/s. So, the signals at A3 are used to analyze the whole velocity.
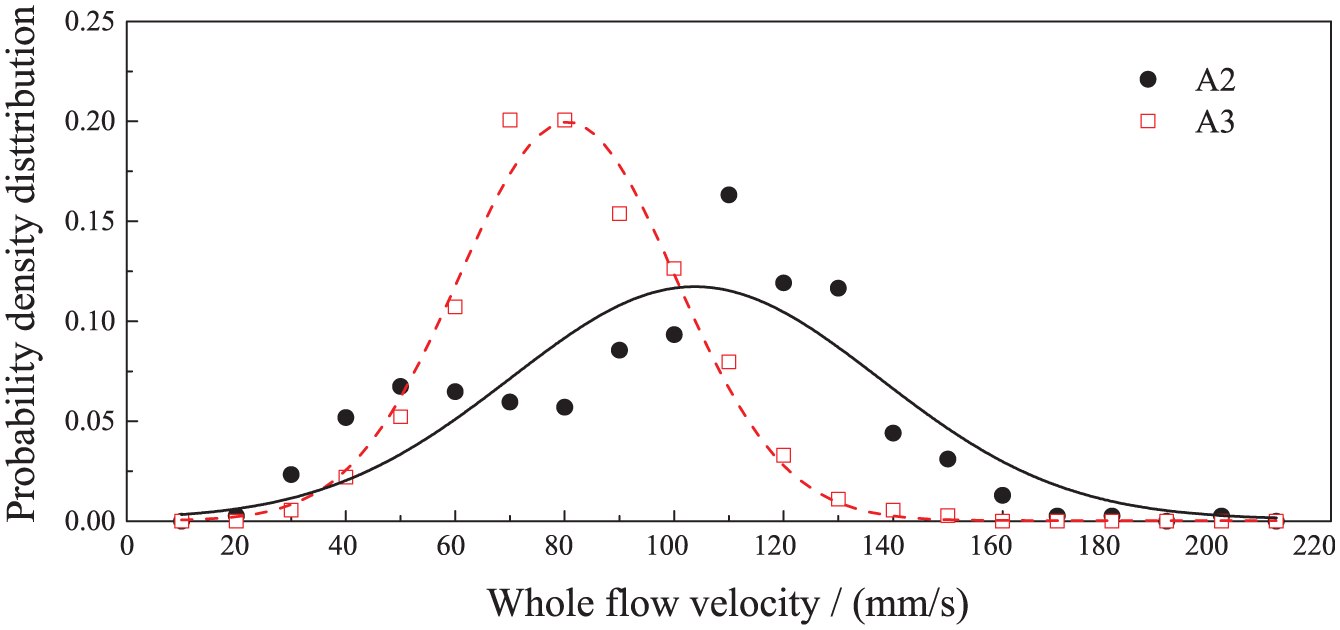
Probability density distributions of the whole velocity of A2 and A3.
So, the displacement signals of positions 1 and 3 are selected to analyze the impact velocity and the whole velocity of the media, respectively. The whole velocity and impact velocity of the media at each sampling point are listed in Table 4. The rotation speed of the drum for sampling points A to E is 30 r/min; E-20 and E-40 are measured with the rotation speed of 20 and 40 r/min, respectively. Similarly, the numbers in parentheses indicate the waveform numbers identified effectively here. Probability density distributions of the whole velocity and impact velocity of each sampling point are presented in Figures 10 and 11, respectively.
Whole velocity and impact velocity of the media in each sampling point.


Probability density distributions of the whole velocity of each sampling point: (a) sampling points: A, B, and C; (b) sampling points: C, D, and E; and (c) sampling points: E, E-20, and E-40.
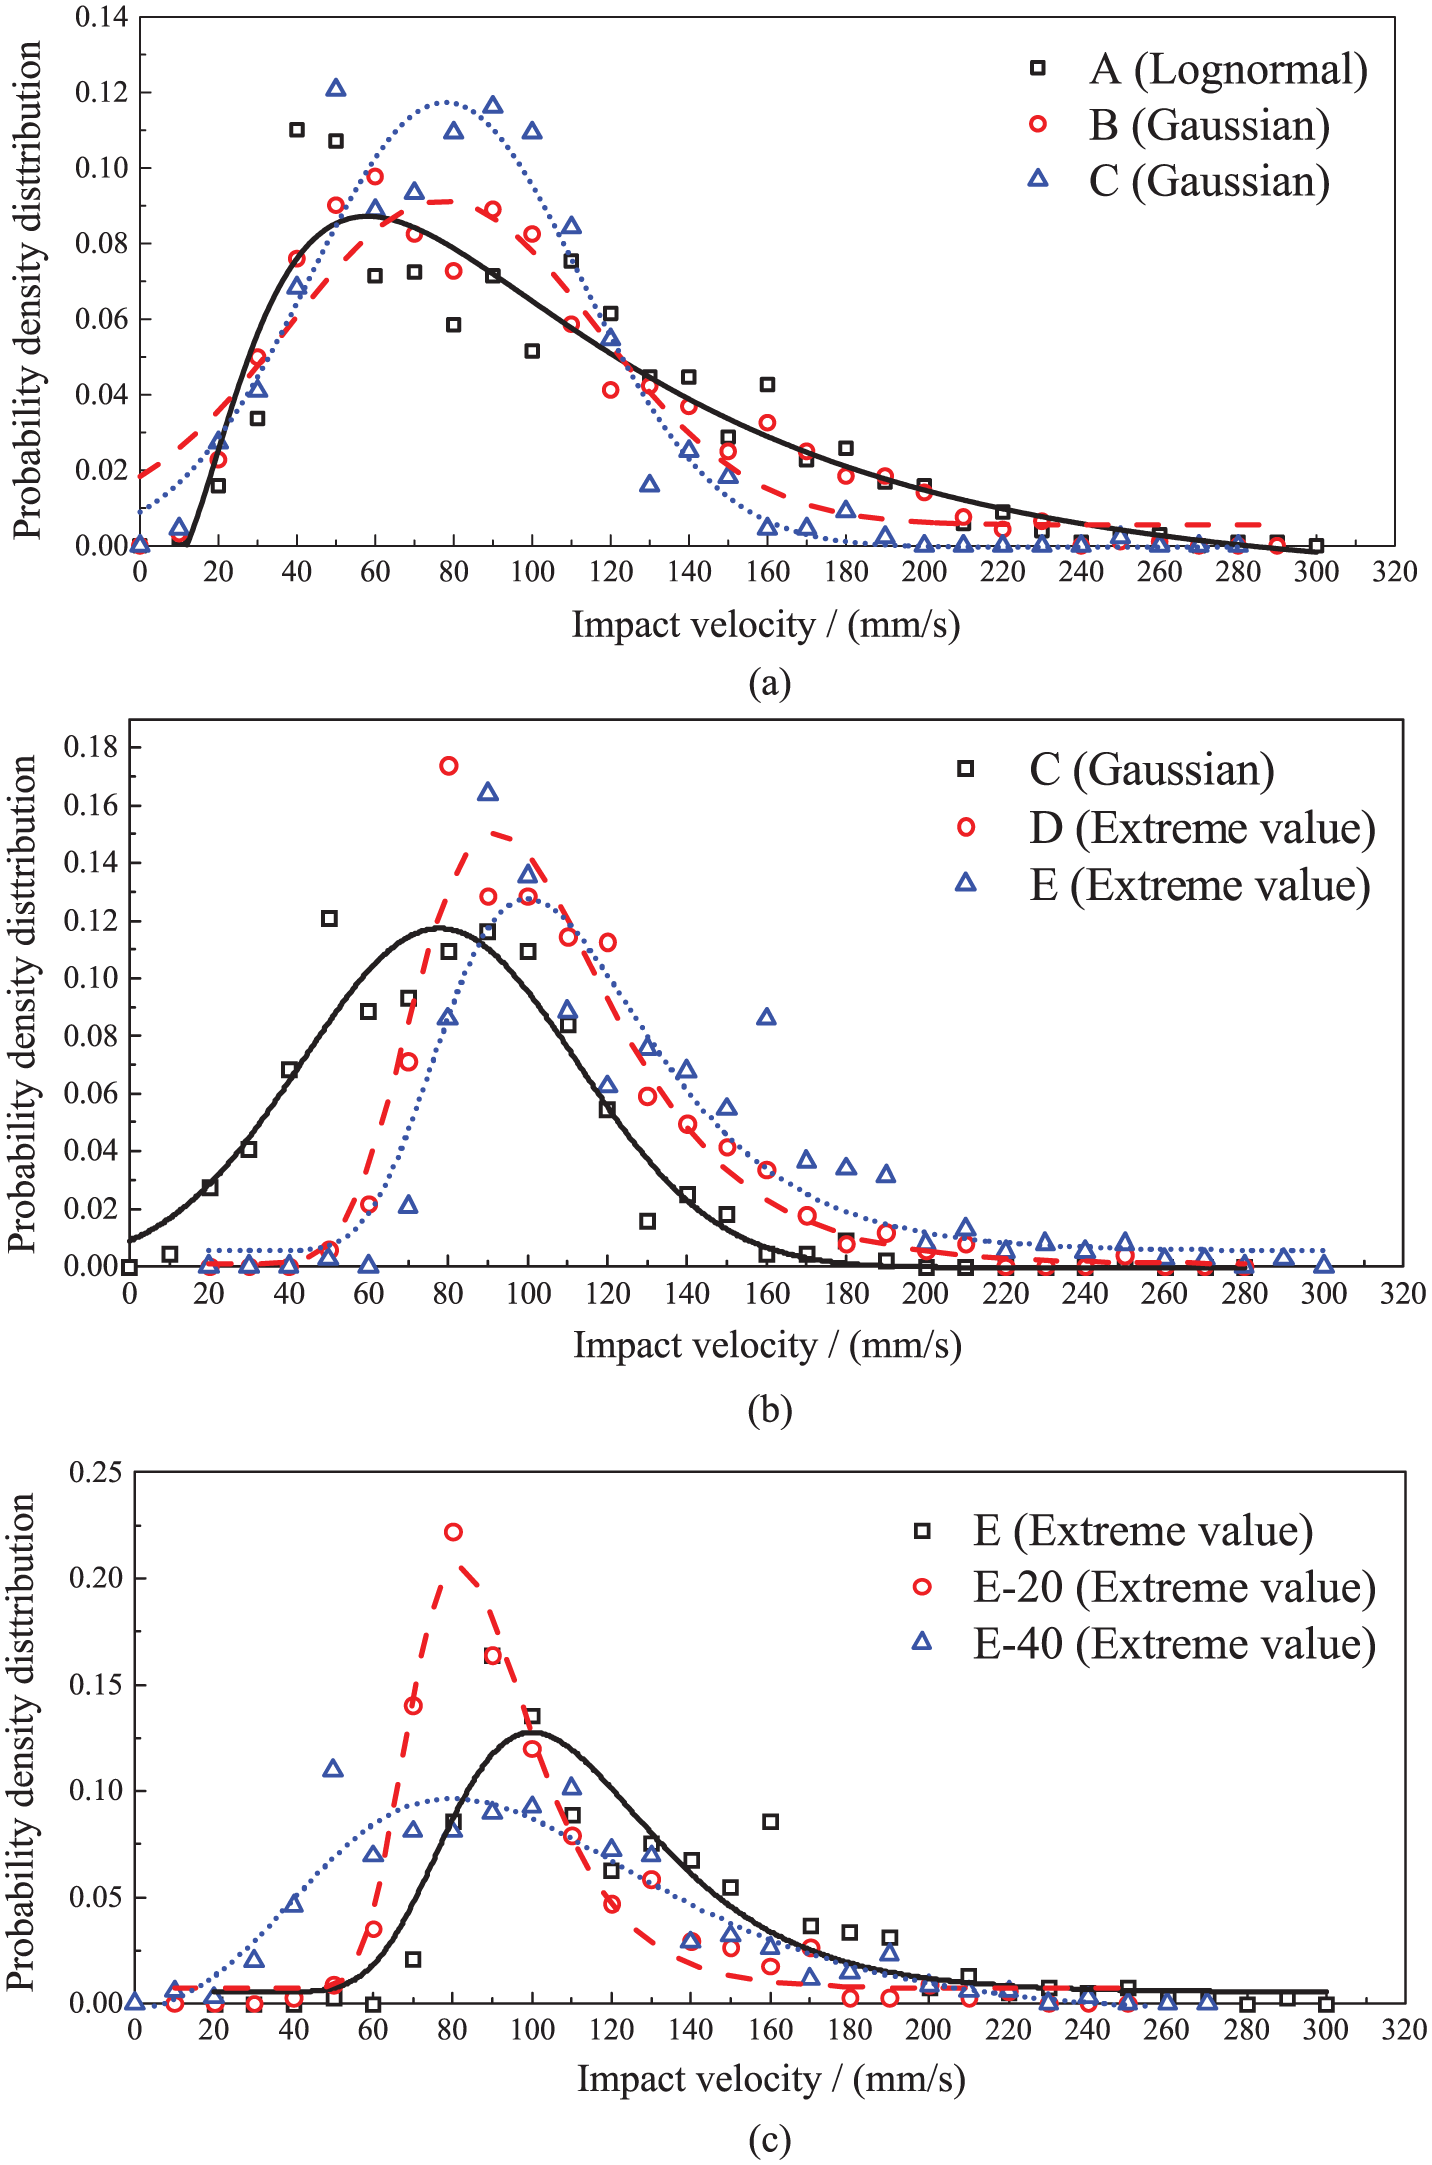
Probability density distributions of the impact velocity of each sampling point: (a) sampling points: A, B, and C; (b) sampling points: C, D, and E; and (c) sampling points: E, E-20, and E-40.
By comparison of sampling points A, B, and C, the whole velocity has an increase trend with the position far away from the rotating center of the drum, while the impact velocity presents the opposite trend, but the change extents of both are not large. In combination with Figures 10(a) and 11(a), the tendency of the expected value of the whole velocity is close to the average value shown in Table 4, while that of the impact velocity is opposite to the average value. It illustrates that when the workpiece is far away from the rotating center of the drum, the whole velocity of the media increases, while the rule of the impact velocity tends to low-frequency impact.
By comparison of sampling points C, D, and E, the variation trends of the whole velocity and impact velocity are not inconsistent. They are not sensitive to the finishing depth from sampling point to the free surface of media flow, especially the average and expected values of the whole velocities in these three points are relatively close. Based on the comparison by the average values of sampling points E, E-20, and E-40 shown in Table 4, the whole velocity and impact velocity of the media obviously increase with the increase in the rotation speed, while the law of the impact velocity in the probability density distribution curve is not obvious.
Although the amounts of raw data selected for calculation of the whole velocity and impact velocity are consistent, the available data amounts significantly reduce with increasing rotation speed. Combining the waveform pickup principle of difference of the peak and valley greater than 0.5 mm, it indicates that the media flow is in a more intensive state with increasing whole velocity or impact velocity, and the range of the media sphere swept by the laser decreases. In combination with Figures 10 and 11, the distribution rule at point A fits the lognormal distribution, which indicates that the average values of the whole velocity and impact velocity at point A are bigger than median value. The whole velocities of points B, C, D, and E, and the impact velocities of points B and C conform to the Gaussian distribution, that is, the standard normal distribution. The remaining sampling points conform to the extreme value distribution. This shows that the distribution of the data is more intense, which is also due to a wider coverage range with the increase in the whole velocity and impact velocity.
Conclusion
By measuring the media displacement variation during the process of parallel spindle finishing, and carrying out corresponding calculation and analysis, the variation trends of the whole velocity and impact velocity are investigated, and the main conclusions are as follows:
The whole velocity of the media shows an increase trend with the increase in rotation speed of the drum or the distance far from the drum center, but the change rule of the impact velocity is not the same. The expectation of its probability distribution has a downward trend with the distance far from the drum center. The velocity of the media is not sensitive to the distance from sampling point to the free surface of media flow.
The probability density distribution of the whole velocity and impact velocity of the media is not consistent at each location. The majority obey the Gaussian distribution and the extreme value distribution. With the increase in rotation speed of the drum, the coverage range is increased, and the extreme value distribution is increased obviously.
As the media passes through the glass window, the laser can only be effectively reflected back by part of its sphere. The faster the whole velocity, the shorter the effective reflecting arc surface.
Footnotes
Academic Editor: Chenguang Yang
Declaration of conflicting interests
The author(s) declared no potential conflicts of interest with respect to the research, authorship, and/or publication of this article.
Funding
The author(s) disclosed receipt of the following financial support for the research, authorship, and/or publication of this article: This project was supported by the National Natural Science Foundation of China (U1510118), Shanxi Provincial Programs for Science and Technology Development (2015031011-3), and Provincial Natural Science Foundation of Shanxi (201701D121073).