
Abstract
In this study, a hybrid city bus was taken as the research object, and through a vehicle drum test, the hybrid bus emissions, the transient gas pollutant emissions, and the particle size and number distributions were surveyed. This study shows that compared to traditional fuel buses, hybrid buses can reduce approximately 44% of NOX emissions, 33% of total hydrocarbon emissions, and 51% of particle emissions. Furthermore, the particle number concentration of the test vehicle was increased in the middle and low ranges of the study. More specifically, the particle number concentration mainly corresponded to particles with a size in the range from 0.021 to 0.755 μm, with a maximum of 0.2 μm, and a particulate matter with particle size of less than 1.2 μm accounted for 95% of the total emissions. Particulate mass concentration was increased as the particle size increased, and the maximum value corresponded to particulate matter with a size of 6.2 μm. On average, whether using a traditional fuel bus or a hybrid bus, particulate matter with particle sizes less than 2.5 μm accounted for more than 98% of the particle emissions. The particles are more likely to be deposited in human lungs, respiratory bronchioles, and alveoli, causing respiratory and lung diseases. Therefore, this study addresses the control of particulate matter emissions from hybrid buses.
Introduction
Hybrid vehicles are currently acknowledged as an effective way to solve the energy crisis and alleviate the pressure of environmental protection.1–3 At present, the annual growth of hybrid buses is approximately 10,000 per year, representing an annual average growth rate of over 50%. The working situations of hybrid city buses are centered on external engine characteristics, especially near the middle- and high-speed regions. The idling operation in the typical urban road spectrum can reach 20%. The fuel consumption in idling operations is not used for vehicle workings, and emissions in the idle condition are higher than those in normal running conditions. To date, research on hybrid vehicle emissions at home and abroad have not been sufficient.4–9 On one hand, engine testing is used as an evaluation basis of heavy vehicle emissions, but engine test conditions typically deviate from real driving cycles. Whether the strict emission regulations can effectively reduce vehicle emissions greatly depends on whether the test cycle can represent the real driving cycle. Furthermore, emission test cycles have become more developed. Using the European regulation as an example, from steady Economic Commission of Europe (ECE) and European Steady-State Cycle (ESC) working conditions to transient European Transient Cycle (ETC) working conditions, the test cycle is much closer to actual engine working conditions. However, the World Harmonized Transient Cycle (WHTC) test cycle is closer to actual heavy vehicle engine working conditions, and it increases the cold start test results. On the other hand, in China, only particulate matter (PM) mass emissions are restricted by emission regulations, and the particle size and number have not been explored. Thus, damage to the environment and human health caused by particles released from heavy vehicles cannot be evaluated.
Based on global energy conservation and emission reduction, emission limits are reduced greatly around the world. However, many researchers observe that the actual emissions of heavy vehicles increase when emission regulations are tightened. Specifically, the emissions of Euro III, Euro IV, and Euro V for actual driving roads do not meet lightened emission regulations, which is particularly obvious in city driving cycles. Similarly, a portion of national IV bus particle emissions are higher than national III bus emissions. Therefore, it is advisable to study the real particle emissions of hybrid buses that are suitable for Chinese urban roads under typical Chinese city bus driving cycle (CCBC).
What is the energy consumption of a hybrid bus under a typical CCBC? What are the characteristics of NOX (nitrogen oxides), total hydrocarbon (THC) and particles emissions? In particular, what are the distribution characteristics of particle size and number? Few studies have addressed the above questions, and most studies lack experimental reference data. This study uses vehicle drum tests to examine vehicle emissions, as well as the particle size and number distributions under various driving cycles.
Testing equipment and program
Testing equipment
The vehicle emission test is carried out on the chassis dynamometer, and the chassis dynamometer model is Burke Dynamometer 7349. In this experiment, a constant volume sampling system is used to collect pollutant samples, and the model of constant volume sampling system is AVL CVS i60. The vehicle running condition parameters are determined by the data acquisition instrument Fluke 2635A, the gaseous pollutants were measured using an AVL AMAi60, and the particle emission characteristics were measured using an electronic low-pressure impactor (ELPI). ELPI mainly measures the particle number and size distributions of vehicle exhaust using a filter, and it can measure particle size ranging from 7 nm to 10 µm. Figure 1 is the schematic diagram of the test system.

Schematic diagram of the test system.
Prototype parameter
Buses are an important part of urban public transportation, and bus emission control is an effective way to improve air pollution in cities. Due to fixed lines, convenient charging, and other factors, hybrid technology has been applied to city buses. Therefore, this study uses a bus as the research object.
The test vehicle was a parallel hybrid electric bus. The speed ranged from 0 to 20 km/h, and the engine was not driven but was kept stable. The vehicle was driven by an electric motor and was in series working mode. When the vehicle was in the starting and low-speed states, the energy storage unit was in the state of lack of electricity. Therefore, the energy storage unit was charged by the generator and engine, and the vehicle was driven by electric motor; when the speed surpassed 20 km/h, the vehicle was driven simultaneously by the engine and the electric motor, and the vehicle was in parallel working mode. Table 1 illustrates the main parameters of the test vehicle. In addition, the vehicle was in full load condition when tested. The diesel oil used in the test met the requirements of China III Fuel Quality Standards.
Basic information of testing vehicle.

Test basis
CCBC is set on the basis of city bus operational data in Beijing, Shanghai, and Guangzhou. The cycle better reflects the actual bus operation conditions and realistic vehicle emissions. Therefore, the emission evaluation is more scientific and reasonable. Therefore, this study adopts the CCBC test.
The testing cycle and testing process were invoked according to the “testing method of heavy-duty hybrid electric vehicles’ energy consumption” (GB/T 19754-2005). The state of charge (SOC), the change in power battery voltage, and the net energy change (NEC) were beyond the scope of this study. The chassis dynamometer was set in terms of the “testing method of heavy commercial vehicles’ fuel consumption” (GB/T27840-2011). The emission test was conducted in light of GB17691-2005 “compression ignition (C.I.) engines of automobiles and park ignition gas engines, along with the emission limits and test measurement of automobile pollutants (phases III, IV, and V in China)” (GB17691-2005). According to emissions under CCBC, each working condition of the testing vehicle was measured twice. The speed set is shown in Figure 2.

Typical urban bus transport cycle in China.
Test results and analysis
CCBC cycle discharge
The operation conditions of city buses are complicated. The operating point of CCBC was obtained by the data collection of speed, driving distance, fuel consumption, engine speed, and intake pressure. Compared to Federal Test Procedure (FTP) test cycles in America and ETC test cycles in Europe, which are widely applied in some parts of China, the emissions data tested by CCBC were more typical and can truly reflect the influence of city buses on air pollution.10–14
Figure 3 shows an emission comparison of a traditional fuel bus and a hybrid city bus. From the figure, it is clear that the THC emissions of the traditional fuel bus reach up to 4.83 g/km, while the THC emissions of the hybrid city bus was approximately 3.26 g/km. The nitrogen oxide emission of the traditional fuel bus reached up to 7.98 g/km, while the nitrogen oxide emission of the hybrid city bus was approximately 4.47 g/km. The PM emission of the traditional fuel bus was approximately 0.0215 g/km, while the PM emission of the hybrid city bus was approximately 0.0105 g/km. In contrast to the traditional fuel bus, approximately 44% of the NOX emissions, 33% of the THC emissions, and 51% of the PM emissions of the hybrid bus were reduced.

Emission comparison of the traditional fuel and hybrid city buses.
Transient emission of gases pollutant
Figure 4 shows the real-time emission comparison of gaseous pollutants between the traditional fuel and hybrid city buses. As shown, the differences in gaseous pollutant emissions between the two models focused on the middle- and low-speed regions, where the emissions were relatively low. When operated at low and medium speeds, the hybrid bus was driven by electricity, so the speed was low, and the emissions were also relatively low. When operated at high speed, the hybrid bus was driven by engine and there was little difference in the emissions between the two models. The average concentration of hydrocarbon (HC) emission of the hybrid bus was 41.3 × 10⁻⁶, and the average concentration of HC emission by the traditional bus was 48.6 × 10⁻⁶. The average concentration of NOX emission of hybrid bus was 24.4 × 10⁻⁶, and the average concentration of NOX emission of the traditional bus was 26.9 × 10⁻⁶. The average concentration of CO2 (carbon dioxide) emission of the hybrid bus was 0.18%, the average concentration of CO2 emission of the traditional bus was 0.26%.

Transient emission comparison of gaseous pollutants: (a) HC emission concentration, (b) NOX emission concentration, and (c) CO2 emission concentration.
Number and mass distribution characteristics of PM
Ultra-fine particles and nano-particles are more likely to enter the lungs and remain for a longer time, which may induce a variety of serious diseases. Therefore, hybrid buses face the double challenge of particulate emission number and mass.15,16 In terms of aerodynamic equivalent diameter, the PM was divided into 12 grades, measuring the particle mass concentrations and number distribution of the traditional fuel and hybrid city buss under CCBC. This study examined the average values of particle mass and number concentration measured twice as research data.
The research results are as follows: elements with particle size less than 50 nm were volatile organic compounds and sulfur, which are referred to as nucleation mode particles.17–19 Elements with particle size more than 50 nm are carbon particle aggregates and absorbate produced by incomplete fuel oil combustion, which are referred to as aggregation mode particles. Figure 5 shows the comparison of particle quantity emissions between the two models. It can be seen that the particle number concentration of the test vehicle became high in the middle and low regions on both sides. More specifically, the particle number concentration mainly corresponded to particles with sizes in the range from 0.021 to 0.755 μm, with a maximum of 0.2 μm. PM with a particle size of less than 1.2 μm accounted for 95% of the total emissions. The number concentration of the nucleation mode particle of the hybrid bus was higher than that of the traditional fuel bus, while the aggregation mode particle of the hybrid bus was lower than that of the traditional fuel bus. The drive mode optimized the operating characteristics of the engine, and the engine was working in the middle- and high-speed conditions. The mixing of fuel and air was accelerated, and the combustion process was improved. The aggregation mode particles produced by incomplete combustion were reduced. In general, whether in the traditional fuel or hybrid bus, the particle size of PM less than 2.5 μm accounted for more than 98% of the particle emissions. It is found that the particles are more likely to be deposited in the lung, respiratory bronchioles, and alveoli, causing respiratory and lung diseases. Therefore, it is important to determine how to control the PM emissions of hybrid buses.

Comparison of particulate matter emission number distribution.
Figure 6 shows the comparison of particle mass emissions between the two models. An apparent distinction occurs between the PM mass distribution and the PM number distribution. The PM mass concentration of the two models increased as the particle size increased, and the maximum PM mass concentration corresponded to a particle size of 6.2 μm. The number concentration of PM with a size greater than 1.2 μm was very low, while the mass concentration was high. Because the elements with a PM size of more than 1.2 µm were carbon granules and adsorbate, the volume and density were large, the PM may deposit in the cylinder head or the exhaust pipe wall, and the emissions were random and uncertain with little relation to real-time engine working conditions. From the perspective of PM mass emissions, the hybrid bus can decrease PM mass emissions by approximately 38% according to the CCBC.
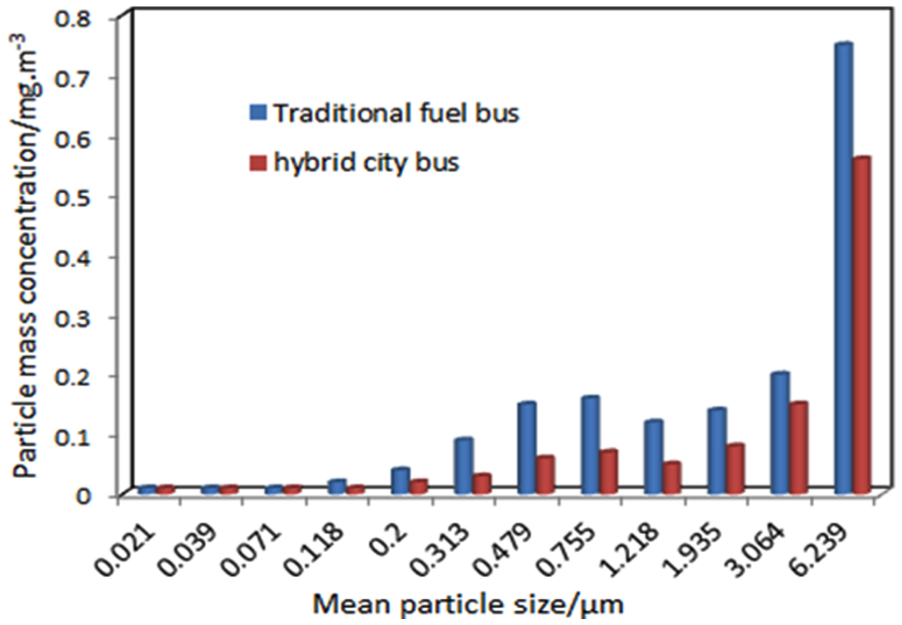
Comparison of particulate matter emission mass distribution.
Operation condition and PM emission
At present, studies on diesel engine performance and emission control focus on the steady state of diesel engines. However, in practice, diesel engines are most often under unsteady transient conditions, especially under extreme ambient transient conditions. Under these conditions, the cyclic air inflow, fuel injection, and lubricating oil consumption of the engine change constantly, causing a deviation in the air–fuel ratio and combustion regime, which significantly influences the diesel and PM emissions.20–23
Figures 7 and 8 illustrate the PM number concentration and mass concentration of emissions from the hybrid bus under different working conditions such as idle, uniform, acceleration, and deceleration. As shown, the vehicle driving cycle had little effect on PM emissions of particle sizes less than 2 μm, and the number concentration of PM within the above scope reached its highest value under uniform working conditions. The particle size ranged from 2 to 8 μm, and the vehicle driving cycle affected the number concentration. The number concentration of PM emissions within the above scope reached its peak value under the accelerating condition, the middle value under the decelerating condition, and the lowest value under idle conditions. For particle sizes ranging from 5 to 10 μm, the vehicle driving cycle greatly affected the mass concentration. Under the accelerating condition, the number concentration of PM within the above scope decreased dramatically, but the mass concentration increased rapidly. These results demonstrated that the combustion status was poor under accelerating conditions, and it easily caused PM emissions such as carbon to increase. On the whole, PM number emissions under accelerating conditions were approximately 2.6 times that of the idle condition and 1.8 times that of the uniform condition. PM mass emissions in the accelerating condition were approximately 4.8 times that of the idle condition and 3 times that of the uniform condition.

Particle number concentration under different operating conditions.

Particle mass concentration under different operating conditions.
Conclusion
The key to hybrid bus emission control research is to understand the differences between the type of approval test conditions of emission regulations and the actual conditions of the vehicle. On Chinese city roads, the CCBC emission test cycle can better reflect real vehicle emissions, and the emission test results have more direct significance:
The emission characteristics of a hybrid bus under the CCBC cycle were surveyed in this study and compared with those of a traditional fuel bus. The total PM emissions decreased obviously, but the emission of fine particles increased on the small scale. Hybrid buses can reduce approximately 44% of the NOX emissions, 33% of the THC emissions, and 51% of the particles emissions.
The particle number concentration of the test vehicle became high in the middle and low regions on both sides of the operational cycle. More specifically, the particle number concentration was mainly concentrated in the range from 0.021 to 0.755 μm with a maximum of 0.2 μm. PM with particle sizes of less than 1.2 μm accounted for 95% of the total emissions. The particulate mass concentration increased as the particle size increased, and the maximum particulate mass concentration corresponded to a particle size of 6.2 μm.
Regardless of the type of bus—traditional fuel or hybrid—PM with a particle size of less than 2.5 μm accounted for more than 98% of particle emissions. Particles of this type are more likely to deposit in human lungs, respiratory bronchioles, and alveoli, causing respiratory and lung diseases. Therefore, the control of PM emissions of hybrid buses is a key factor of the study.
Footnotes
Handling Editor: Jia-Jang Wu
Declaration of conflicting interests
The author(s) declared no potential conflicts of interest with respect to the research, authorship, and/or publication of this article.
Funding
The author(s) disclosed receipt of the following financial support for the research, authorship, and/or publication of this article: This work was supported by the National Natural Science Foundation of China (Grant No. 51506011), Natural Science Foundation of Jiangsu Province (Grant Nos BK20160406 and BK20151259), Natural Science Foundation of Jiangsu Higher Education Institutions Project (Grant No.15KJB470001), and Basic Research Project of Suzhou (Grant No. SYG201515).