
Abstract
An experimental investigation was carried out to investigate Particulate Number (PN) emissions from a modern, small-capacity Gasoline Direct Injection (GDI) engine. The first part of the study focused on improving measurement repeatability using the Cambustion DMS-500 device. Results showed that sampling near the exhaust valve – while dampening the pressure oscillations in the sampling line – can significantly improve the repeatability. It was also found that uncontrolled phenomena such as deposition in the exhaust system from earlier engine operation can undermine the accuracy of measurements taken at tailpipe level. The second part of the work investigated PN emissions from three types of gasoline fuel, Pump-grade, Performance and Reference. Fuel chemical composition was found to have an appreciable impact on PN, but the magnitude of this effect differs in various operating points, being more pronounced at higher engine load. The Reference fuel was found to have the lowest PN emission tendency, conceivably because of its lower aromatics, olefins and heavy hydrocarbons content. A sweep of operating parameters showed that higher injection pressure reduces PN, but the extent of the reduction depends on fuel physical properties such as volatility.
Introduction
Gasoline Direct Injection (GDI) engines offer higher efficiency and lower CO2 emissions compared to Port-Fuel Injection (PFI) gasoline engines, 1 but with the drawback of higher particulate matter (PM) emission.2–6 Considering the stringent regulations on particulate mass and particulate number (PN), the need for developing and deepening the knowledge around the complexities of PM formation and measurements in GDI engines is evident. Such knowledge is necessary to reduce PM emission tendencies at design level, and also to develop simulation models for predicting PM emission accurately and inexpensively.
Based on the available body of knowledge on PM formation, the in-cylinder mixture homogeneity prior to combustion is critically important for PM mitigation.7–9 Mixture preparation is influenced by engine operating parameters such as injection pressure, injection timing and spark timing among others. Fuel quality and composition also have an important role to play in PM formation. Physical characteristics of the fuel such as density, surface tension and vapour pressure affect the fuel spray formation and hence feed into the above mixing process. Once the combustion starts however, the chemical composition of the fuel is decisive in setting the kinetics and chemical pathways through which PM is formed.
Due to the central role of the fuel properties in PM formation, the subject has been extensively researched in recent years.2,10–14 A great majority of such studies however have been focused on yet-to-be-widely-adopted alternative/substitute fuels,15–17 whose share in actual fuel markets remains negligible, with the absolute majority of the fuel consumed in Spark Ignition (SI) engines continuing to be conventional gasoline. The chemical composition of gasoline varies to some extent from one producer to another, depending on the source of the crude oil and the production process. It is of interest to understand to what extent such subtle composition differences can alter PM emissions in GDI engines.
This has been previously attempted by other researchers.18–20 For instance, Sobotowski et al. 12 tested seven gasoline types with various levels of aromatics and ethanol content in four vehicles in a chassis-dynamo setting using two different driving cycles. They demonstrated that high molecular weight hydrocarbons like C10+ have a significant influence on PM emissions. Increased share of aromatics in the fuel blend (obtained by adding toluene) was also found to increases PM. However, it was noted that the effect of fuel composition varied in different engines and drawing an overarching conclusion was not possible. Khalek et al. 21 tested three commercially available gasoline fuels in a GDI vehicle and measured the PM emitted during two different driving cycles. They found that the PM tendency among the three fuels could be explained by the share of hard-to-evaporate heavy hydrocarbons. Leach et al. 2 conducted experiments in a highly boosted GDI engine with 10 different blends of gasoline samples, and reported that fuel composition has a considerable effect on PN level, but this effect varies as engine operating parameters/actuators change. For instance, EGR increases PN with some fuels, and reduces it with some others.
One difficulty in achieving conclusive results lies in the complexities (and also semi-random nature) of the in-cylinder phenomena. The pathway through which fuel chemicals react depends on the local stoichiometry (i.e. mixing quality), temperature/pressure history, and the residence time. Once the engine operating point changes, all these parameters change in an often non-linear fashion, and various chemical pathways might either accelerate or become negligible. Also, it is challenging to compare PM results across different studies on different engines. This is because even at nominally similar operating conditions (e.g. torque output), the in-cylinder physical parameters (e.g. temperature, mixture quality, etc.) often vary among different engines -due to differences in design and calibration- which can lead to diverging conclusions between different studies, especially if conclusions are drawn upon small sets of data. 12
Such complexities are also accompanied by the uncertainties in the measurements themselves. The PM measurement instruments are sensitive to soot morphology and sampling conditions – to various degrees depending on their operating principle. This commonly adds another source of complication in PM studies. A variety of sampling instruments and techniques are employed for research or regulation purposes, each presenting certain pros and cons. Cavina et al. 22 compared the transient PN measurements by AVL particle counter APC 489, AVL Micro Soot Sensor (MSS), Horiba MEXA 2000 SPCS, as well as Cambustion DMS-500. They demonstrated that the DMS-500 can pick up the dynamic variation of PN in transient conditions far better than the other instruments, owing to its very short (200 ms) response time. Such a fast dynamic response makes the DMS-500 suitable for PN measurement in transient engine conditions,23,24 which is typically a major contributor to the overall PN emission. However, there are also reports suggesting that the DMS-500 measurements are prone to low repeatability. Shen et al. 25 compared the performance of AVL Micro Soot Sensor (MSS) and Pegasor Particle Sensor (PPS-M) with Cambustion DMS-500, and showed that its measurements suffer from the highest standard deviation among all. Tonegawa and Nakajima 26 and Michler et al. 27 showed that other fast samplers such as TSI EEPS which like DMS-500 operate based on the electric mobility principle, perform similarly. Therefore, it is of interest to better understand the nature of the limitations of such devices operating based on electric mobility principle and develop strategies to improve the quality and repeatability of their measurements.
Based on such background, the current study was planned in two parts: first, an investigation was conducted on the repeatability of PN measurements using the Cambustion DMS-500 (part one). Then, using the established measurement methodology, the impact of fuel composition on particulate mass/number was studied using three commercially available gasoline fuels in multiple operating conditions (part two).
Methodology
Engine and test-bed
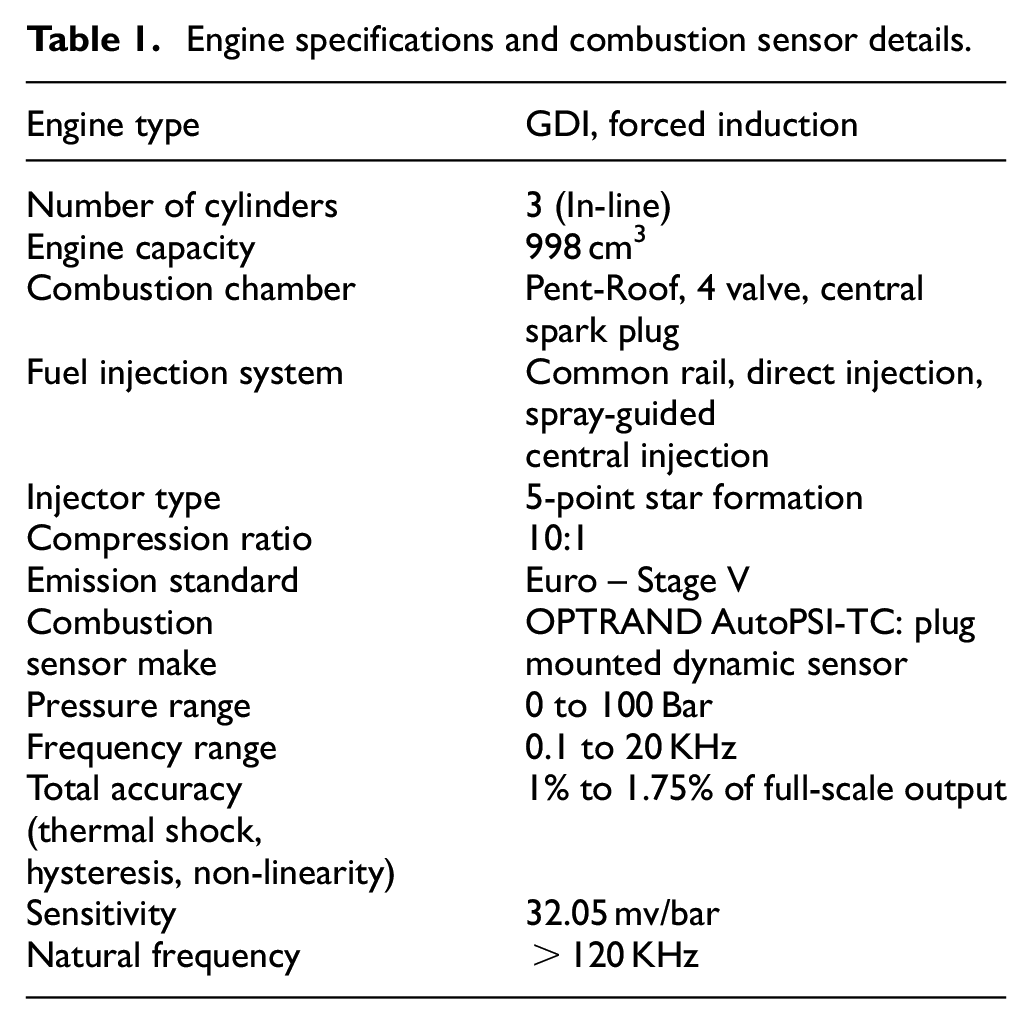
A Ford Fox EcoBoost GDI engine coupled to a SCHENK W130 eddy-current dynamometer was used for the experiments. The engine technical details are presented in Table 1. SXTune® Software was used to alter the ECU-controlled parameters such as spark timing or injection pressure. Test-cell control and general data acquisition was carried out using the Sierra-CP CADET V14 system, which maintained the desired engine torque and speed through a PID controller utilising throttle valve position and the current supply to the dynamometer. Fuel consumption was measured by a Sierra-CP FMS-400 gravimetric system. In-cylinder pressure from the first cylinder was recorded using an OPTRAND fibre optic pressure sensor with a built-in charge amplifier, for combustion analysis (details included in Table 1). Intake and exhaust port pressures were recorded in parallel, also using OPTRAND sensors.
Engine specifications and combustion sensor details.
Experiments
Part 1: Repeatability of PN measurements
The main objective in this part of the study was to investigate the effect of sampling methodology on PN measurement repeatability. First it was sought to clarify if PN measurement at a given operating point was influenced by the previous engine running conditions (i.e. Engine History). 28 To this end, the effect of engine pre-conditioning (i.e. running the engine for a specified duration in a specified operating point) on the subsequent PN measurement was investigated. For pre-conditioning, the engine was warmed up via a set procedure and then run for 15 min at either 1200 rpm–12 Nm (low pre-conditioning point) or 2000 rpm–40 Nm (high pre-conditioning point). After 12 h of cool-down overnight, the engine was warmed up again by the same set procedure and then operated at the baseline point of 2000 rpm–16 Nm so that the dependence of the PN measurements on pre-conditioning could be assessed. Sampling location was also investigated given the potential effects of mechanisms such as deposition. 28 Sampling was carried out at the tailpipe downstream of the after-treatment system (tailpipe sampling), as well as immediately after the exhaust valve (engine-out sampling), using a probe fitted on a spacer between the exhaust manifold and the engine block. The probe was curved and extended towards the cylinder, so that the tip was positioned as close as possible to the exhaust valve (at a distance of approximately 60–70 mm). Figure 1 shows a block diagram of test procedure and test cases.
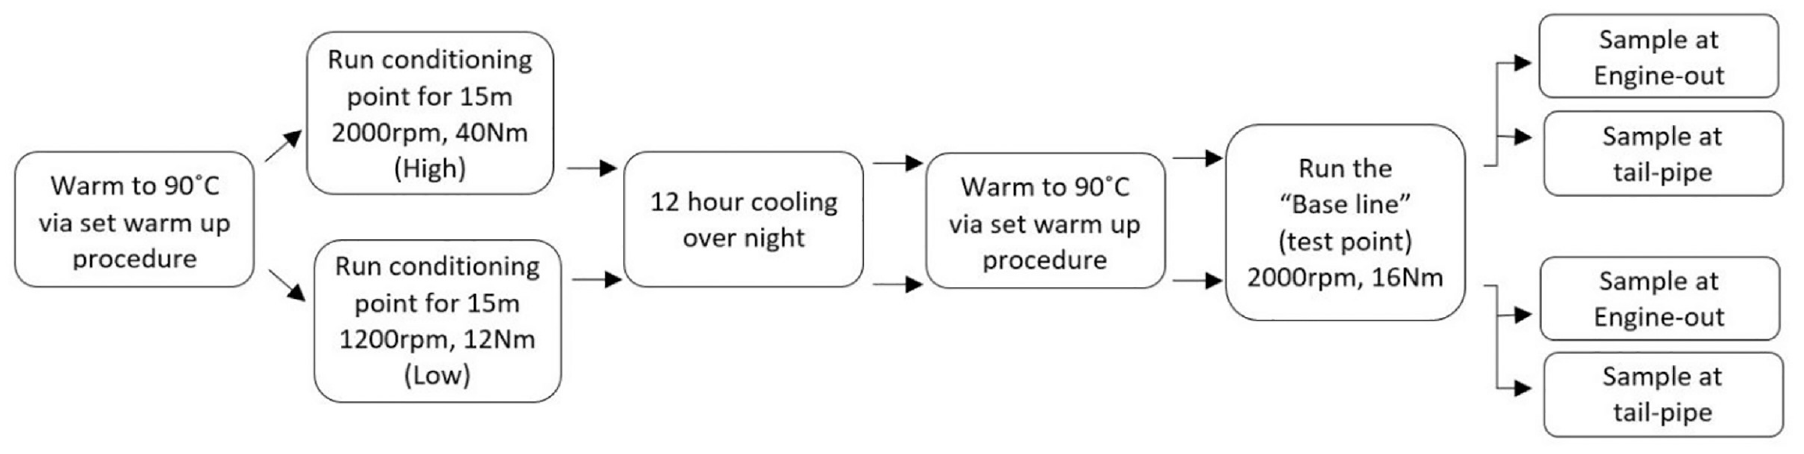
Test procedure for investigating the effect of engine pre-conditioning on subsequent PN measurement, and effect of sampling location.
Once the effect of pre-conditioning and sampling location was clarified, the investigation focused on quality of PN measurement and the potential strategies for improvement. The setup for PN measurement at engine-out is depicted in Figure 2. The engine exhaust gas stream was directed to the sampling line and then fed to the DMS-500 particle sizer. The operating principle of the DMS-500 is based on electrical mobility: particles pass through the proximity of an aerosol charger and acquire a positive charge proportional to their surface area. The particles then enter the classifier section which is a cylindrical cavity with a positively charged high voltage electrode at the centre, which repels the particles towards an array of surrounding electrode rings (detectors). Since smaller particles are more mobile, they will collide to detector rings positioned earlier in the classifier, while large particles travel further due to their higher inertia, and collide with the detectors positioned further downstream. Since each detector measures the total charge of the particles collided to it, the charge values read from an array of 22 detector rings are used to create statistical bins that together form a size distribution of sampled particles (after respective post-processing). The device can measure particles ranging from 5 to 1500 nm in size with a 200 ms response time at 10 Hz data rate.
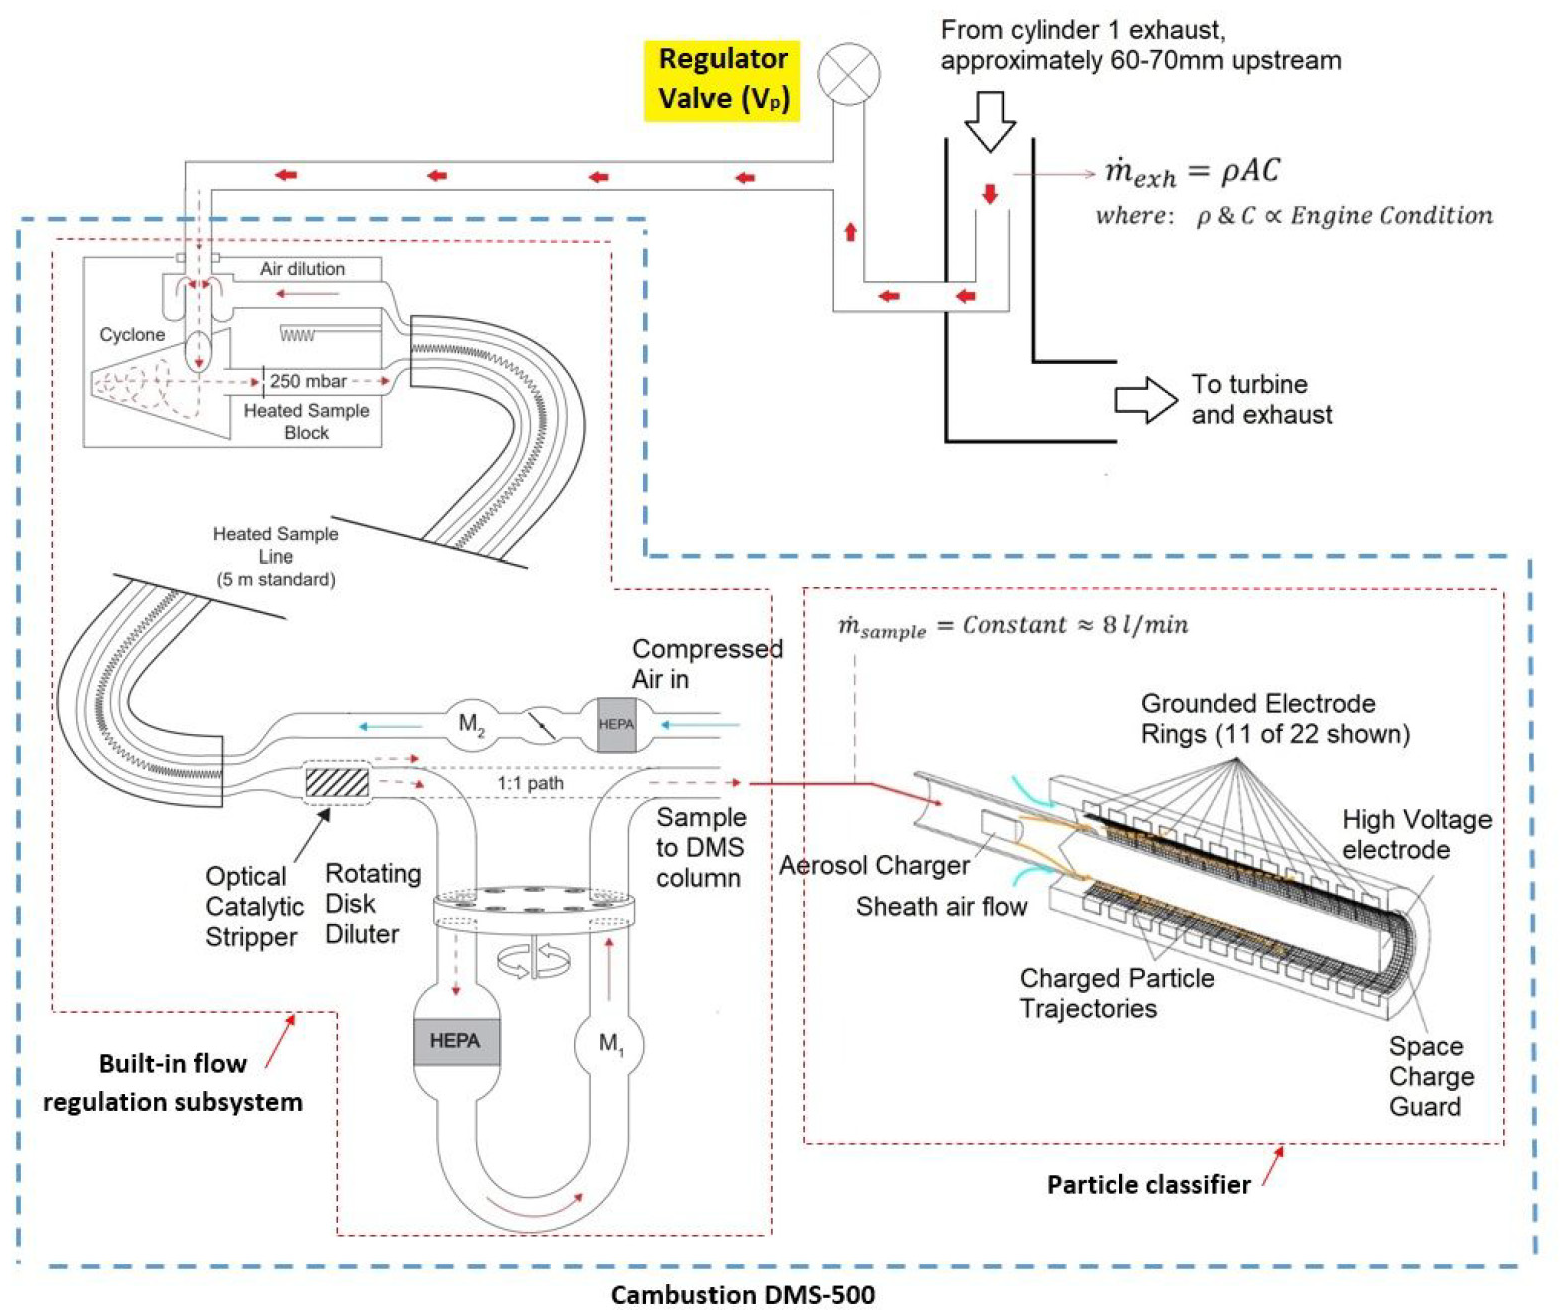
PM measurement setup using cambustion DMS-500.
The steadiness of the flow carrying the particles inside the classifier is critically important for accurate measurements. This is why the DMS-500 system has a built-in two-stage flow conditioning/regulating sub-system which dilutes the sample flow to a set level, regulating temperature and flowrate as required. However, sampling the exhaust gas right after the exhaust valve brings the challenge of highly pulsating flow, which – as assumed in this study – could not be effectively and adequately regulated by the built-in system, and hence causes repeatability issues.
In order to explore this assumption and, at the same time devise an effective solution, an external flow regulation system, in the form of an added regulator valve was implemented at the beginning of the sampling line (before the first diluter) to dampen the source flow pulsation (Figure 2). Three different regulator valve arrangements were tested as shown in Figure 3. Firstly, no valve regulator was used. Secondly, a spring-loaded constant pressure poppet check valve (0.03 bar) was implemented, creating an automatic mechanical control. Lastly, a manually operated absolute pressure release control valve was tested. In this case, once the engine reached steady-state operating conditions, the valve position was adjusted so that a flow rate of 8l/min would be achieved in the particle classifier, in combination with a secondary dilution ratio of 20, according to recommended default values for DMS-500 operation for current particle classification.
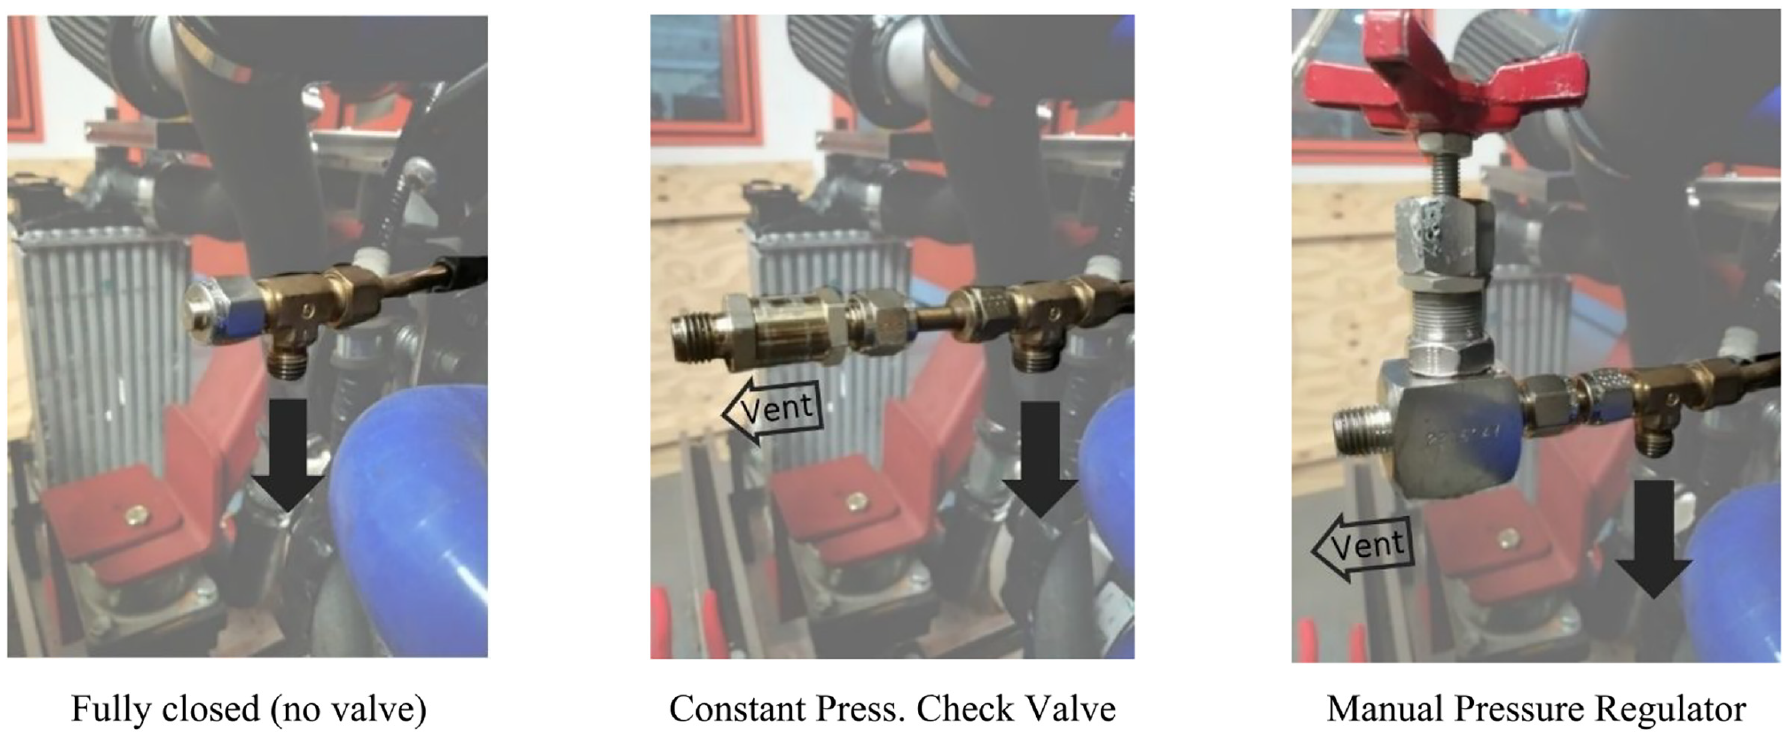
Different regulator valves tested.
Dilution ratio is another important parameter which can potentially affect the accuracy of measurements. The first dilution ratio D1 is recommended at 5:1 for gasoline engines, and is primarily used to prevent water condensation and damage to the instrument. The secondary dilution ratio D2, however, can be adjusted by the user to achieve a good signal to noise ratio. It was therefore investigated as a sampling parameter through a sweep over eight values around the default value of 20.
The above sampling parameters/configurations were tested at three different engine running points (low, medium and high), bringing the total number of test points to 72, as graphically presented in Figure 4.
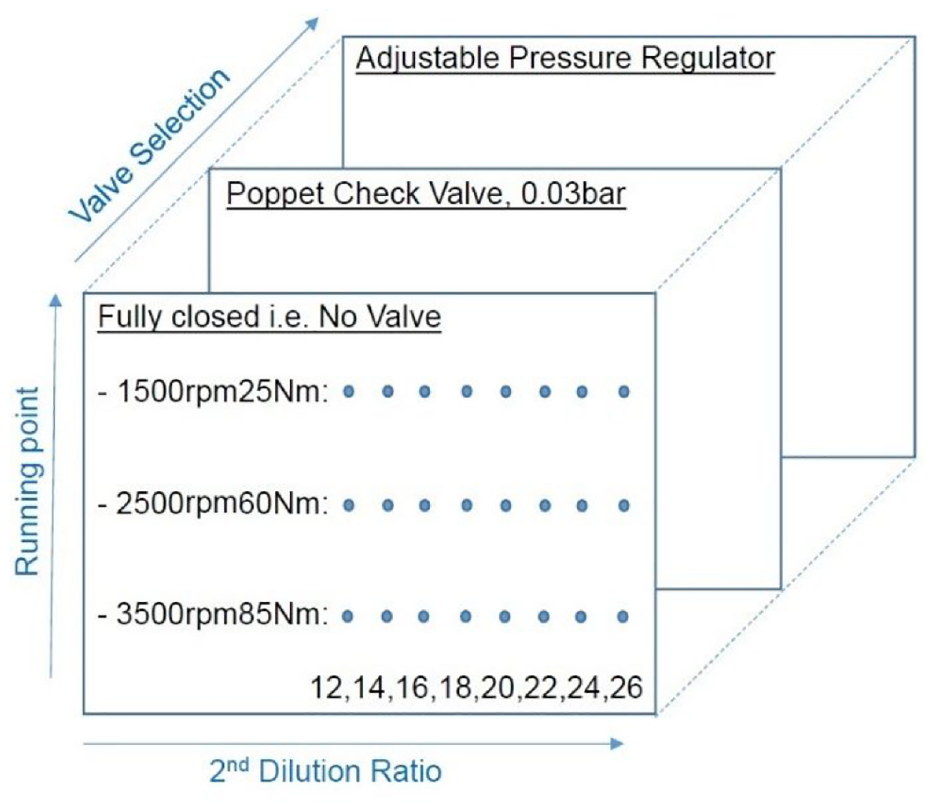
Test cases to investigate the effect of regulator valve and various dilution ratios on PM measurement quality.
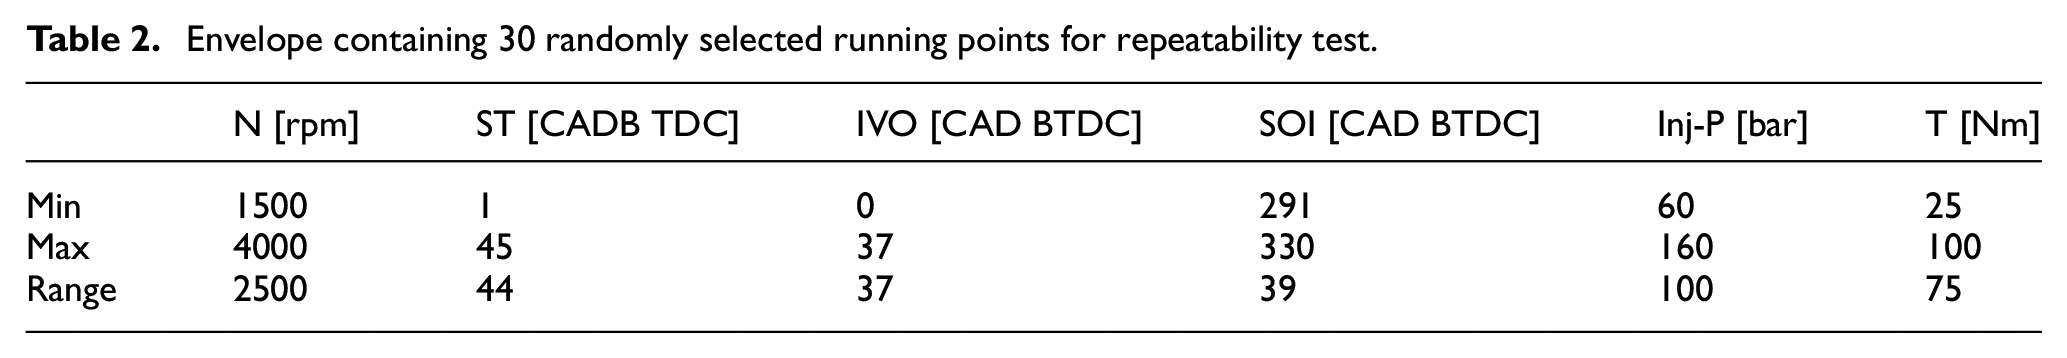
Once the optimal PM sampling strategy was established, a second overall repeatability test was performed over 30 operating points which were selected using a random distribution space filling matrix. The randomly chosen variables for this study were spark timing (ST), start of injection (SOI), injection pressure (Inj-P), intake valve opening (IVO), engine speed (N) and torque (T). As shown in Table 2, minimum and maximum limits were imposed to ensure the test points were relevant to normal operation of a modern GDI engine, avoiding the insurgence of knock phenomena (COV of IMEP kept below 5%). Three tests (one reference run and two repetitions) were carried out at each running point adding up to 90 tests in total.
Envelope containing 30 randomly selected running points for repeatability test.
Part 2: Effect of fuel composition on particulate mass/number emissions
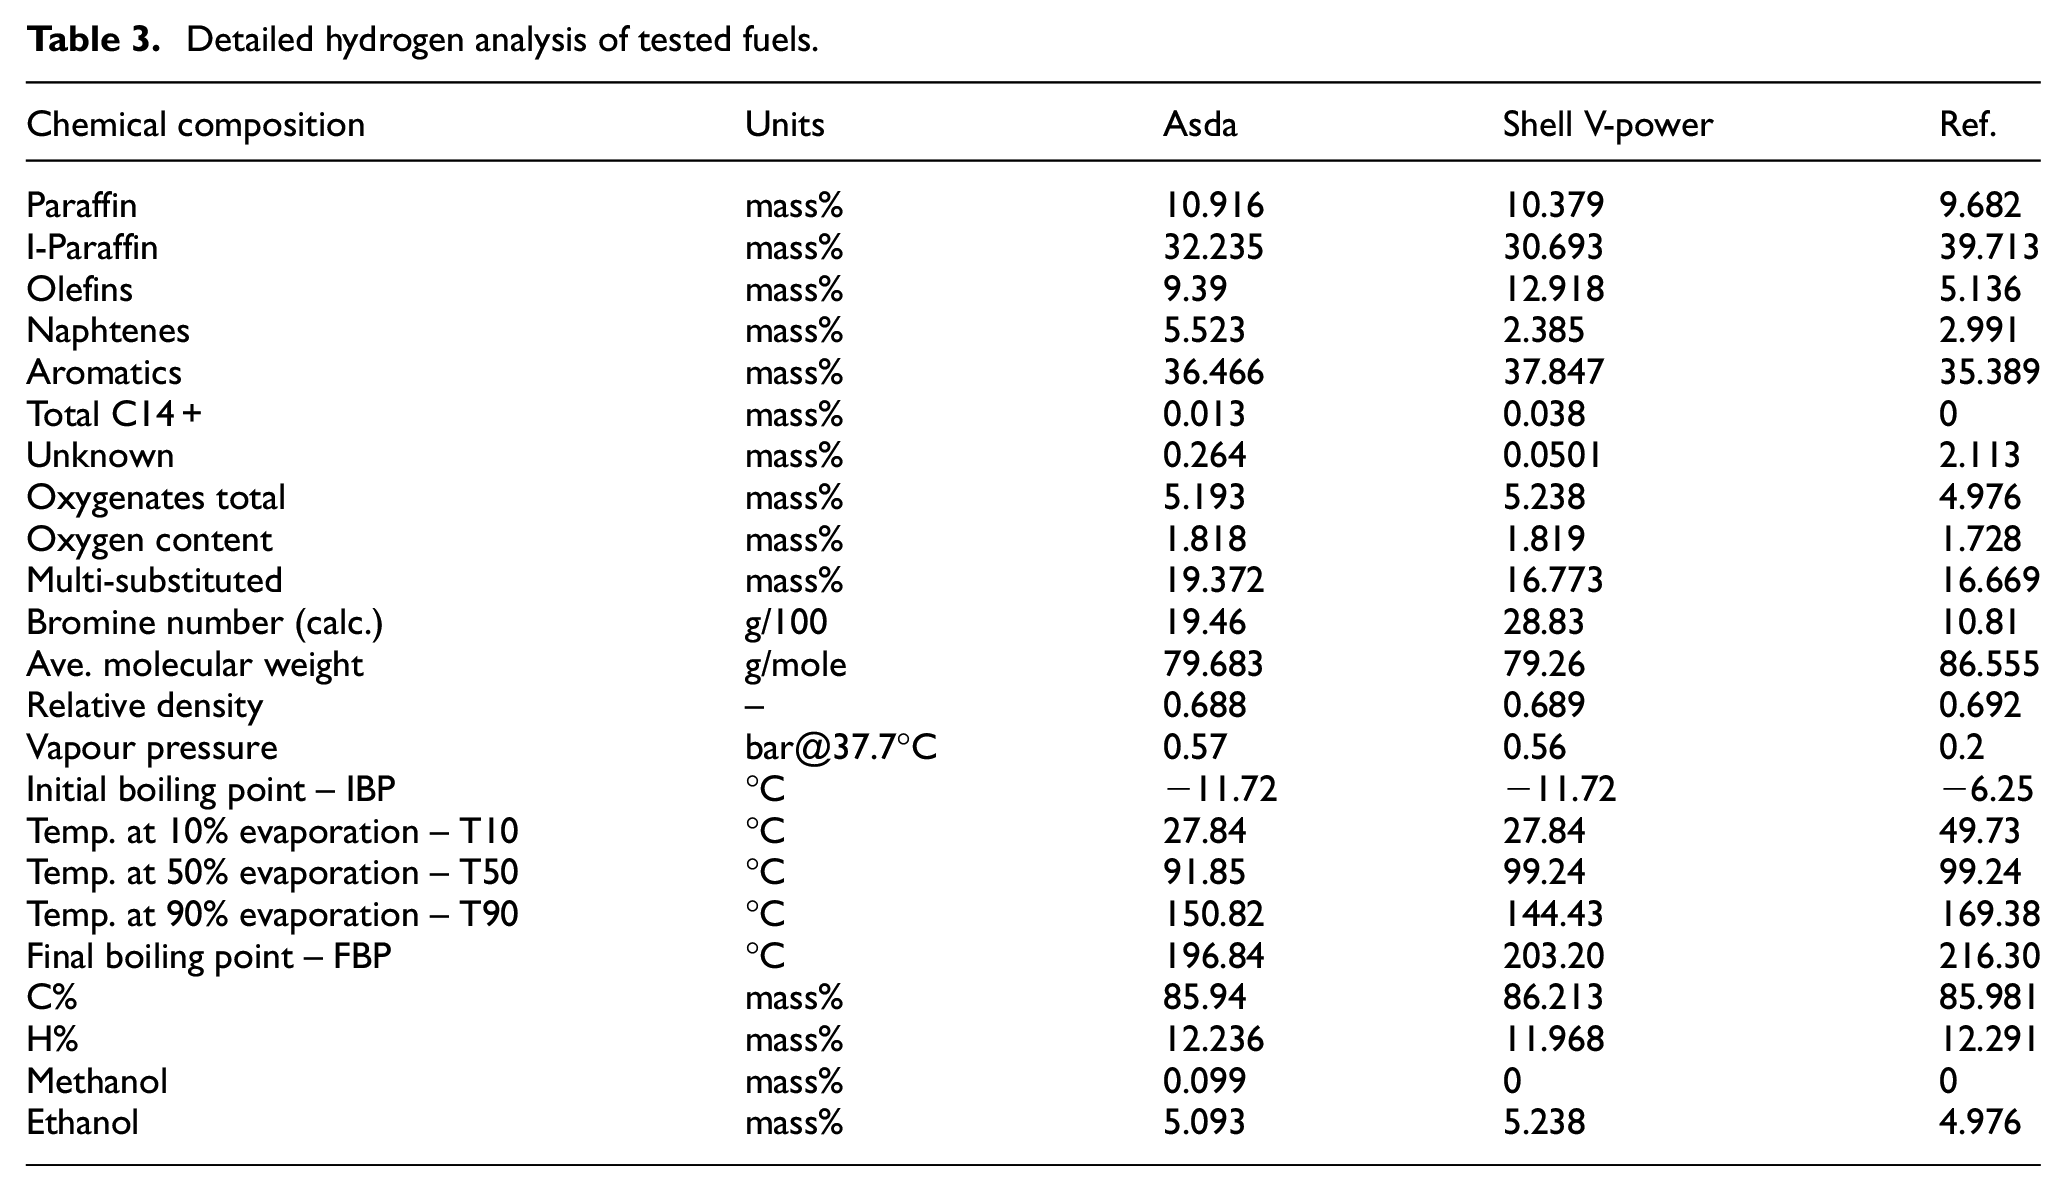
The second part of the study focused on the effects of fuel composition on PN emissions. Three commercially available gasoline fuels were tested including a normal Pump-Grade fuel (95 RON, E5), a second more expensive one sold to the public under the denomination of ‘High Performance’ fuel (99 RON, E5), and a Reference fuel (RF-04-08, 95 RON, E5). The main objective was to understand the direction and the magnitude of the effect of aromatic and other relevant chemical groups on particle size distributions and integrated quantities (total number density/concentration and average particle size, calculated here in terms of GMD, Geometrical Mean Diameter). The detailed hydrocarbon analysis of the tested fuels is presented in Table 3. Note that due to limitations in the available analysis methodology, the C14+ category in Table 3 does not segregate into specific chemical groups or name specific chemical structures (i.e. unidentified mix of hydrocarbons). Single batches of each fuel were used for testing in short time windows to ensure mixture consistency and mitigate potential time-dependant variations.
Detailed hydrogen analysis of tested fuels.
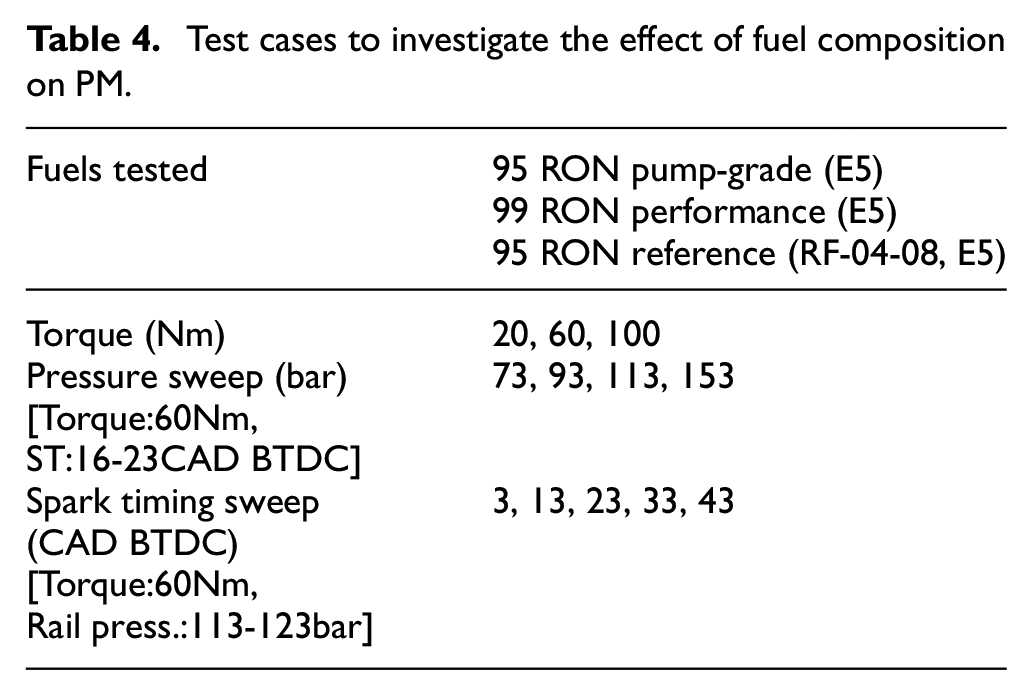
The engine was run at 3000 rpm in low (20 Nm), medium (60 Nm) and high (100 Nm) torque. At 60 Nm torque, sweeps of injection pressure and spark timing were also taken, while maintaining stoichiometric conditions (lambda = 1) in all cases by adjusting the injection pulse width. Exhaust valve timing and fuel injection timing were kept fixed. The test cases for this investigation are summarised in Table 4. Injection pressure and spark timing directly influence both mixture quality and in-cylinder temperature, creating a range of in-cylinder conditions to allow various chemical pathways to come to effect, potentially revealing dependencies between fuel composition and particulate mass/number.
Test cases to investigate the effect of fuel composition on PM.
Attention was paid to the engine being in a practically relevant and stable operating range in all cases. This was ensured by COV of IMEP remaining consistently below 4%, as shown in Figure 5 for the injection pressure sweep as an example.
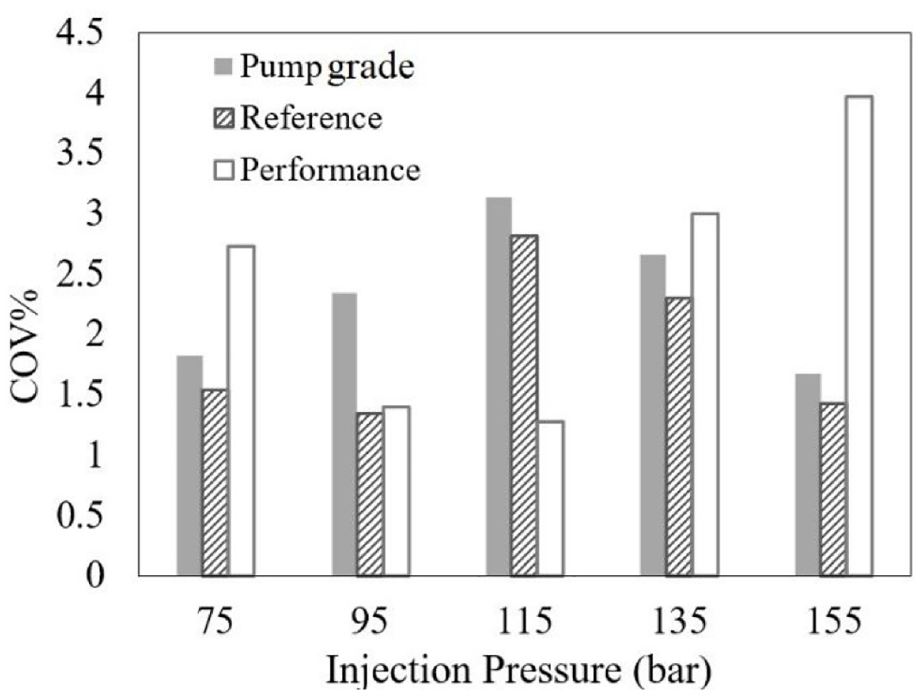
COV of IMEP remained below 4% in all sweeps (injection pressure case shown).
Results and discussion
Part 1: Repeatability of particulate mass/number measurements
It has been suggested in literature29,30 that soot particles and liquid hydrocarbon droplets/vapours might deposit/condense in the after-treatment system and be released later, when for instance the exhaust temperature is high enough to re-vaporise and release them, causing unexplained variations in PM measurements, which affect repeatability. This issue was examined in the current study by observing the effect of pre-conditioning the engine at two different running points (High and Low pre-conditioning) on subsequent PN measurement taken at the baseline condition. However, prior to any other investigation, the best location for PN measurement had to be determined.
The effect of sampling location was studied based on pre-conditioning data. Figure 6 shows particle number density distributions respectively from engine-out sampling (top plot) and tailpipe-out sampling (bottom plot), for several repeats at the high and low pre-conditioning points. The results suggest that if sampling is done at the tailpipe, measurement of nucleation phase particles (<50 nm) may suffer from lower repeatability. This could be attributed to the fact that the majority of particles in this size range may be in liquid phase. 30 The number of liquid particles is sensitive to temperature, residence time, flow-pattern, and humidity in the sampling line, and can decrease by coagulation or deposition on walls, or increase by condensation of vapour into small liquid particles.22,30 Sampling after the whole after-treatment system – as opposed to sampling at engine-out – means more possibilities for such parameters to influence the number of liquid particles, hence affecting the repeatability. Apart from the repeatability trends, the proportion of nucleation particles is also notably higher when sampling from the tailpipe. This may be due to the effect of longer residence time which allows condensation of vapours into liquid particles. 22 In the case of engine-out sampling however (Figure 6, top), due to the shorter distance the particles travel, the variation in liquid particle number is less significant. However, the variation in accumulation mode particles (>50 nm) is higher, which may be attributed to instability in sample flow, as will be discussed in more details later.
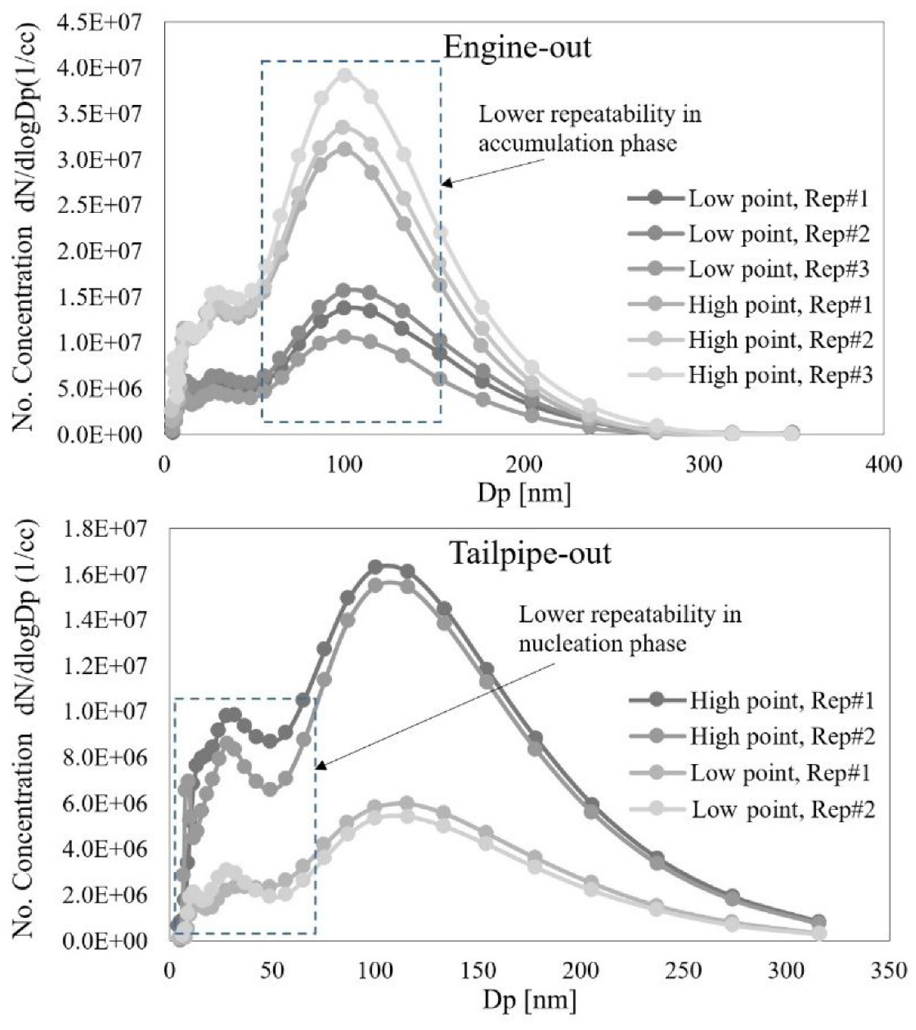
Effect of sampling location on PM measurements; operating points are those used for pre-conditioning (pre-conditioning low point: 1200 rpm, 12 Nm; pre-conditioning at high point 2000 rpm, 40 Nm).
The engine was then operated at baseline point to understand the impact of pre-conditioning on subsequent measurements. The results, presented in Figure 7, suggest that when sampling at engine-out, no clear effect of previous running can be detected, as there is no major distinction between results of Low and High pre-conditioning points with only a small 4.7 × 10⁴ #/cc difference between average measured values. When sampling at tailpipe-out however, the previous engine operating point clearly impacts the measurements with a 1.67 × 10⁶ #/cc difference between average values, undermining the measurement accuracy and repeatability. This suggests that sampling as close as possible to the exhaust valve should be preferred over sampling from the tailpipe.
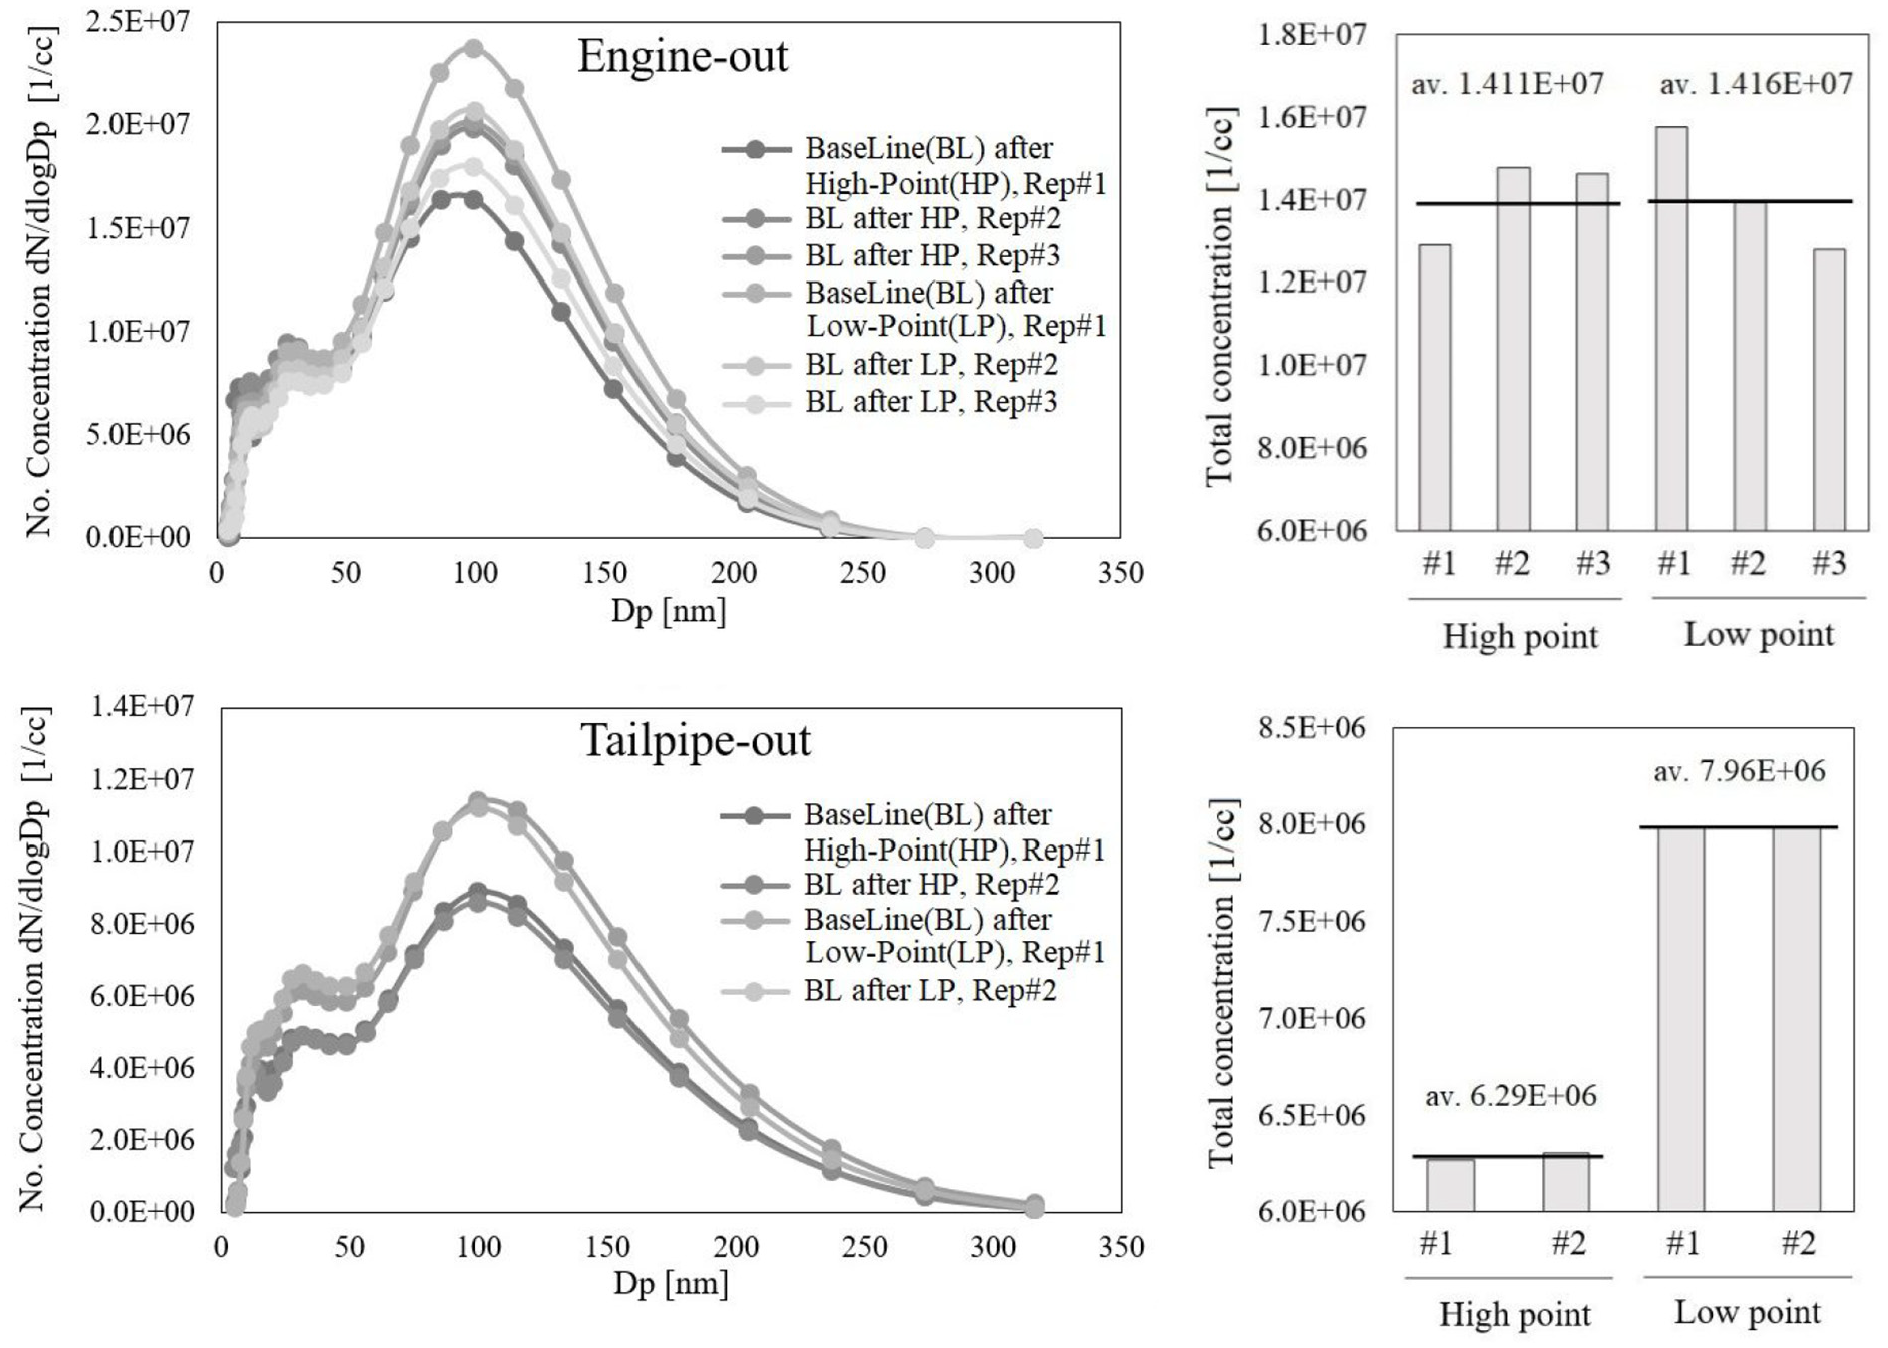
Effect of engine pre-conditioning on PM measurements at baseline point, sampled at two locations (high point pre-conditioning 2000 rpm, 40 Nm; low point pre-conditioning: 1200 rpm, 12 Nm; baseline: 2000 rpm, 16 Nm).
However, it is also understood – from both Figures 6 and 7 - that the measurement repeatability for accumulation phase particles (>50 nm) is noticeably lower when sampling at engine-out. Since the total particulate mass is strongly affected by larger particles, any inaccuracy in measuring such particles would also compromises the accuracy of mass calculations. While engine-out sampling brings the advantage of insensitivity to previous engine operation, it suffers from lower larger size repeatability, most likely as a result of greater flow pulsations at the sampling point. Thus, in order to mitigate this problem, an external flow regulation system was added to improve flow stability within the DMS-500 particle classifier.
If the classifier flow is unstable, the current returned by each detector ring would show a high level of variation. This can be quantified by calculating the Coefficient of Variation (COV%) which is defined as the ratio between the standard variation of the measured currents and their mean value. Lower COV% of rings’ current would indicate a more stable flow, which then contributes to a higher quality of measurement. It is important to distinguish that the level of physical flow instability (high velocity, pulsations, erratic dynamics, etc.) within the particle classifier is intended to be regulated by an external regulator as well as the 2 stage dilution system described previously to achieve a steady state flow. As the latter system also regulates the overall dilution, a monitored presence of high measurement instability within the classifier caused by physical instabilities will practically always be accompanied by a variation in instantaneous dilution within the final sample. By varying the secondary dilution set point across its viable range, we can demonstrate an inability to maintain a stable target, that is, a high sensitivity to dilution setpoint would provide an indication for high variation in the instantaneous dilution. Then by comparing the overall increase of COV% across multiple external regulators, we can gauge the presence/contribution of physical flow instabilities as well. The COV% of the detector rings’ currents is presented in Figure 8, in three different engine running points with three different regulator valves. In each plot, a range of secondary dilution ratio (D2) from 12 to 26 is also shown.
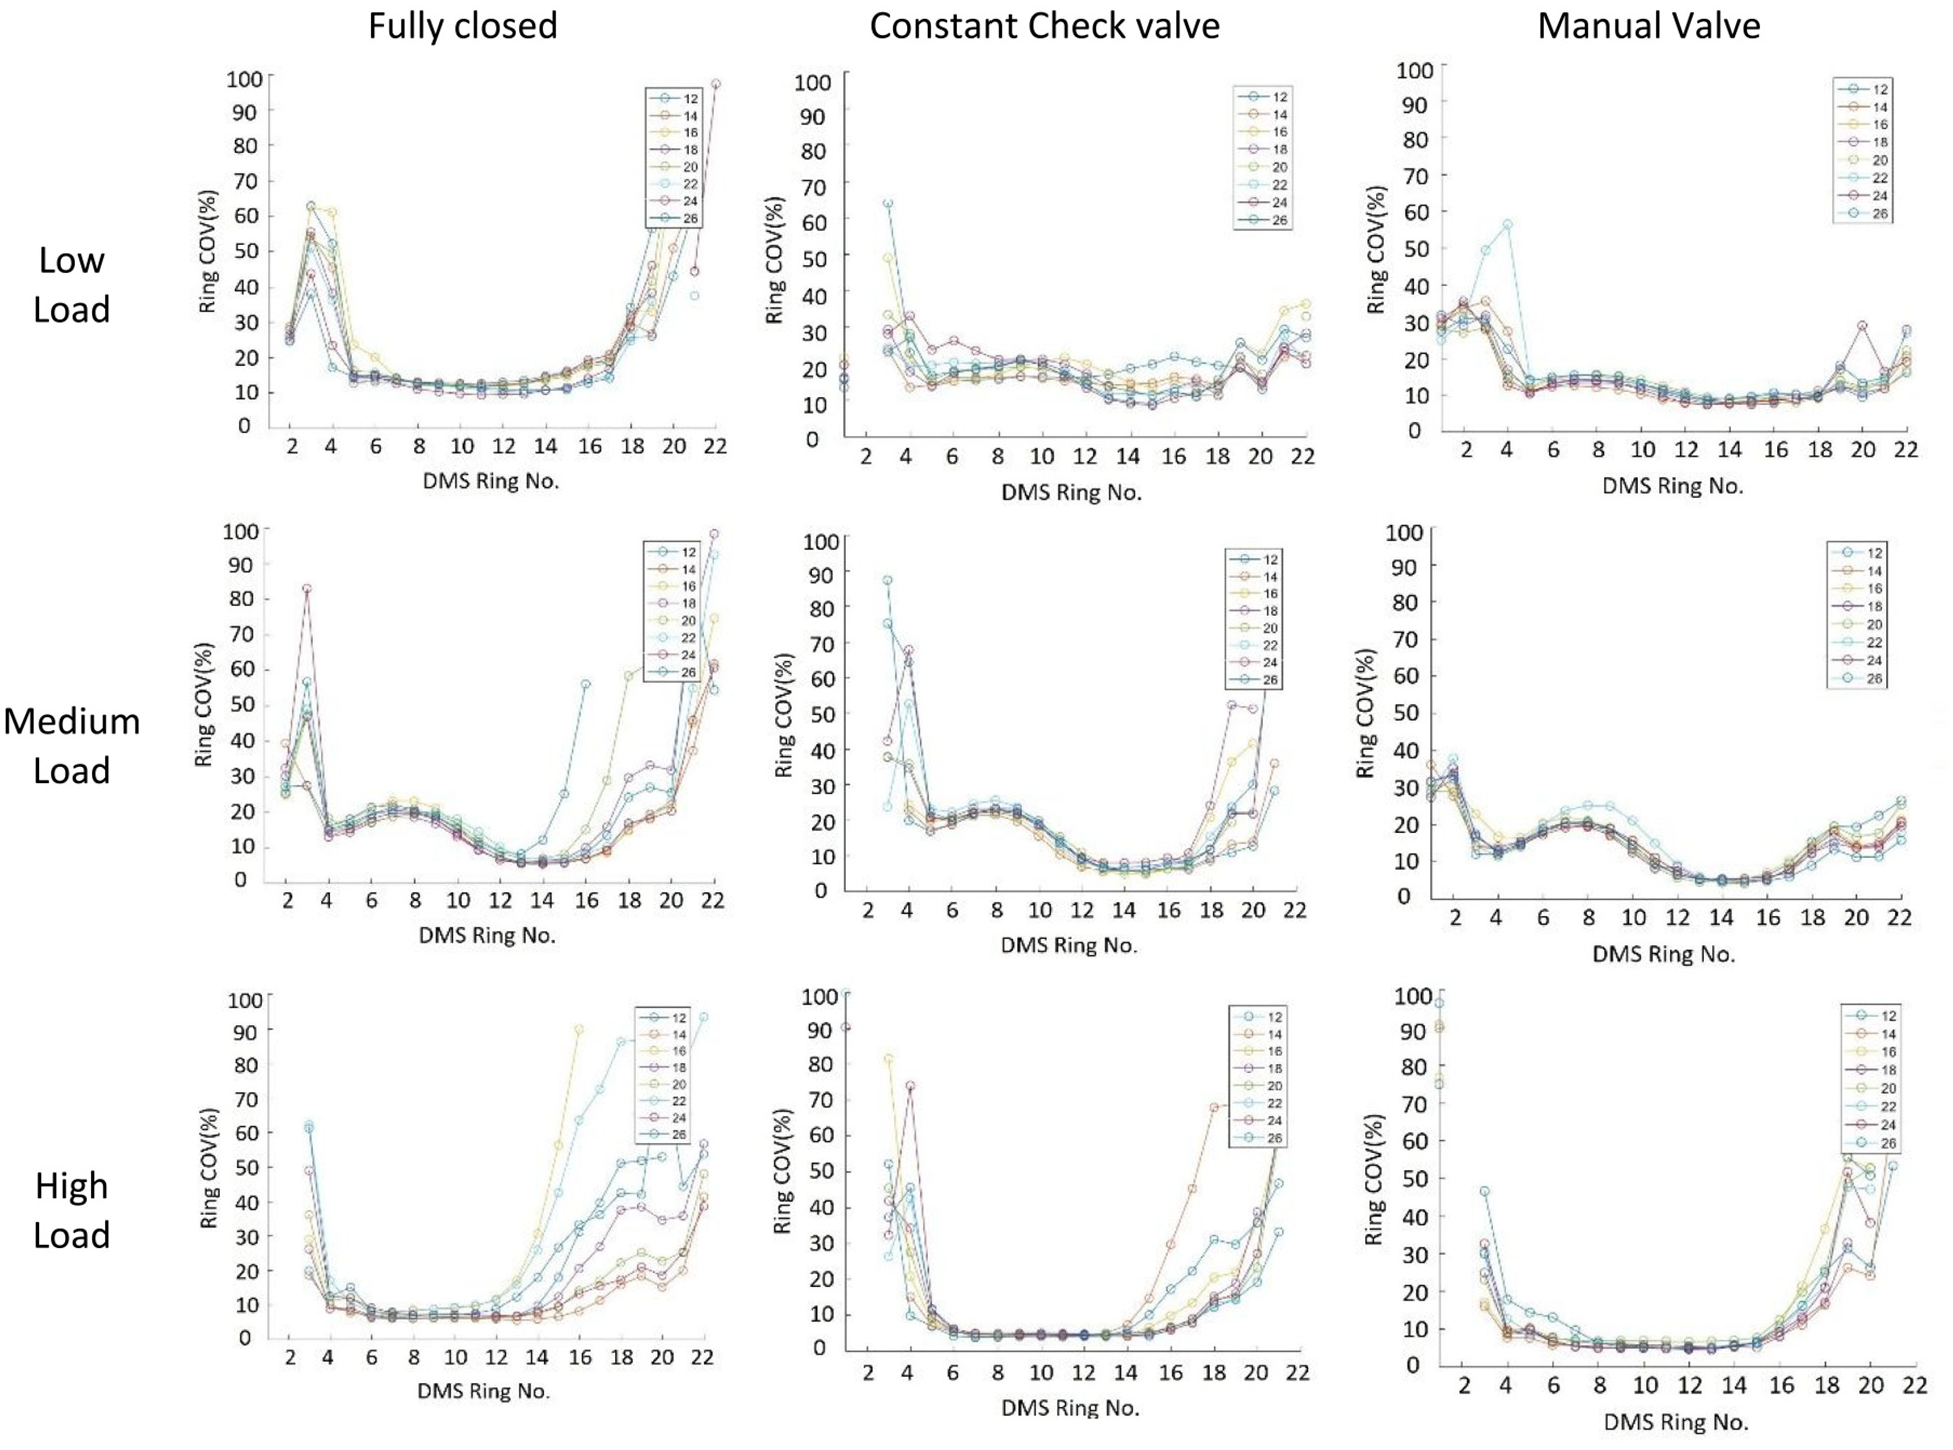
Coefficient of variation (COV%) of the DMS detector rings voltage, in various valve regulator arrangements and engine loads.
The corresponding soot particle size distributions are presented in Figure 9. In a general assessment, it is evident that the manual pressure regulator allows the most stable measurement process with the lowest average COV% across all rings. It also offers the lowest sensitivity to secondary dilution ratio which would suggest less variation of instantaneous dilution, translating further to more robust measurements.
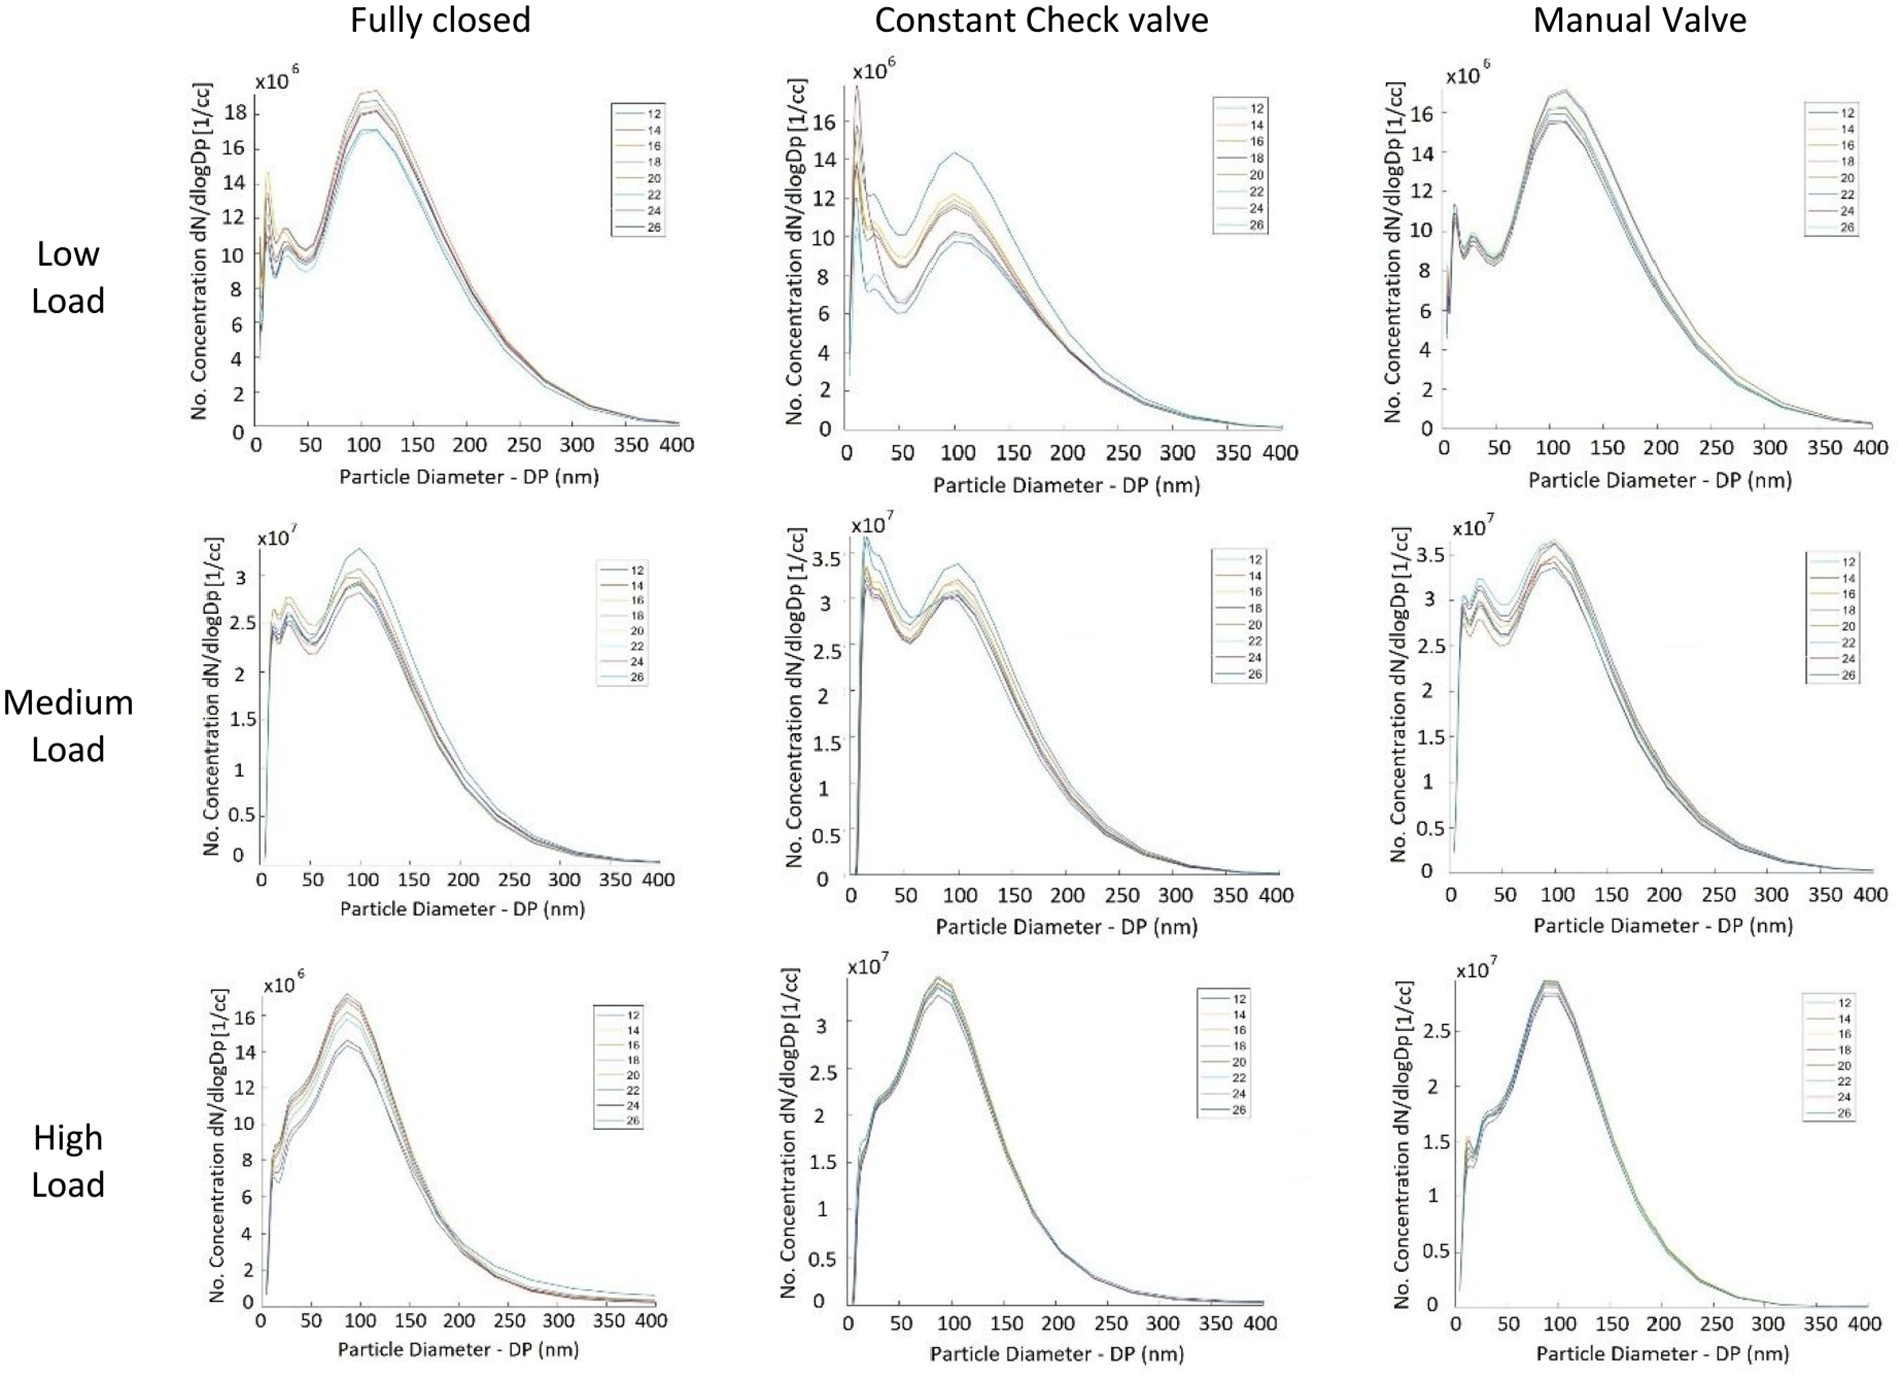
Particle size distribution measured by DMS with various pressure regulator arrangements and dilution ratios.
The manual valve regulator also enables capturing the tri-modal nature of particle size distribution at all running points, while other valve configurations either miss it or disturb it, with the most obvious case being the high load running point, where the tri-modal distribution is only evident with the manual pressure regulator.
Considering the above observations, it was concluded that the manual pressure valve regulator is the most effective configuration to improve the accuracy and repeatability of measurements. This may simply be due to the poppet valve not being designed to actuate sufficiently for such erratic flow pulsations. If, as shown in this work, the typical pressure pulsations of the flow in the early exhaust manifold can be smoothed out, then sampling at engine-out as close as possible to the exhaust valve (i.e. effectively cylinder-out sampling) brings about numerous advantages. These measurements do not suffer, or suffer to a lesser extent, from uncontrollable and unpredictable mechanisms such as agglomeration and surface deposition and from unknown distortions within the turbine and catalytic converter. As such, they are more suited for development and/or calibration of in-cylinder models, ultimately supporting the establishment of a more robust CAE process within the automotive industry.
After establishing the best sampling strategy, a validation repeatability study was carried out over 30 randomly selected running points within the engine design envelope (allowing variation of speed/torque and engine actuators so that high and low PN production is tested), each of which was repeated three times (reference run, plus two repetitions). As seen in Figure 10, total PN levels across repetitions are consistent and repeatable, apart from few outliers, which correspond to limited low injection pressure and high torque conditions. When demand for boost was high, maintaining purely steady-state operating conditions was found to be challenging due a malfunction of the turbocharger closed loop control – this directly translated into higher PN variability. Overall, substantial agreement for the total number density magnitude was achieved for approximately 85% of all running points. Discarding five outliers, the average COV% of PN measurement between repetitions was calculated at 5.3%. With regard to size distribution – indicated by Geometric Mean Diameter and presented in the bottom plot of Figure 10– the repeatability was much higher, even for the above mentioned outlier points. The average COV% of GMD was calculated at 3.1%, without excluding any point.
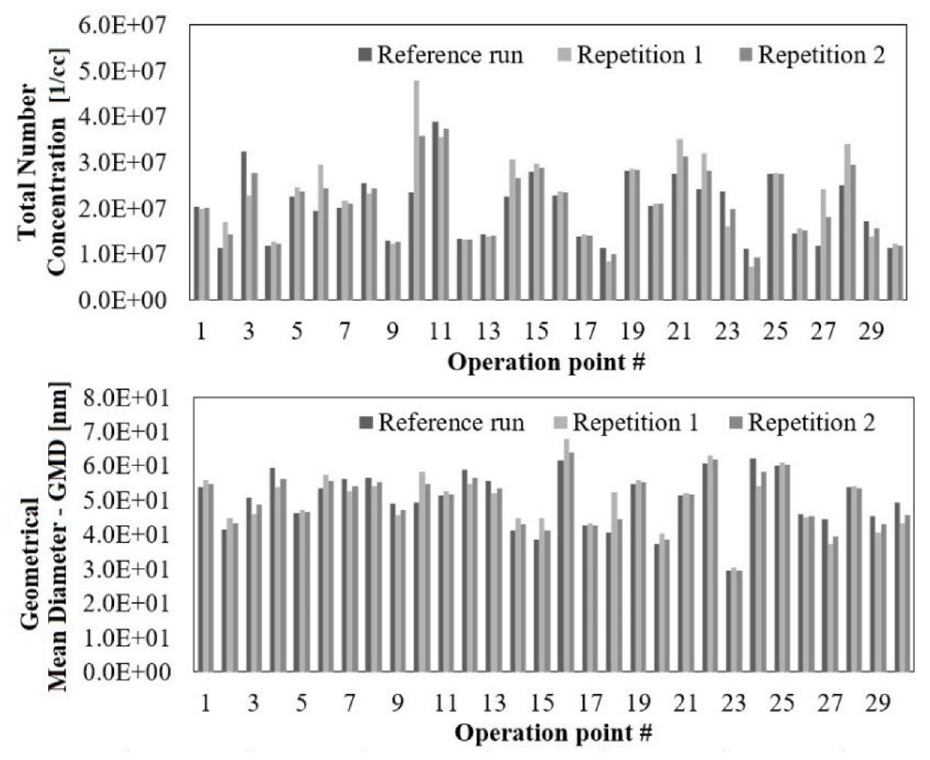
Repeatability results for 30 randomly selected points.
Part 2: Effect of fuel composition on PM characterisation and emissions
Three types of gasoline fuel, as described previously, were tested at three different engine loads (20, 60 and 100 Nm, respectively) and constant speed of 3000 rpm. Figure 11 reports the corresponding particle size distributions, averaged over three repetitions taken via cylinder-out sampling as detailed above. At low engine load, the difference in PN is negligible. At medium load, the Reference fuel is emitting significantly lower PN compared to the other two fuels, which emit similarly high levels. At high load, each fuel is behaving differently, with the Performance fuel size distribution significantly shifting towards the smaller sizes.
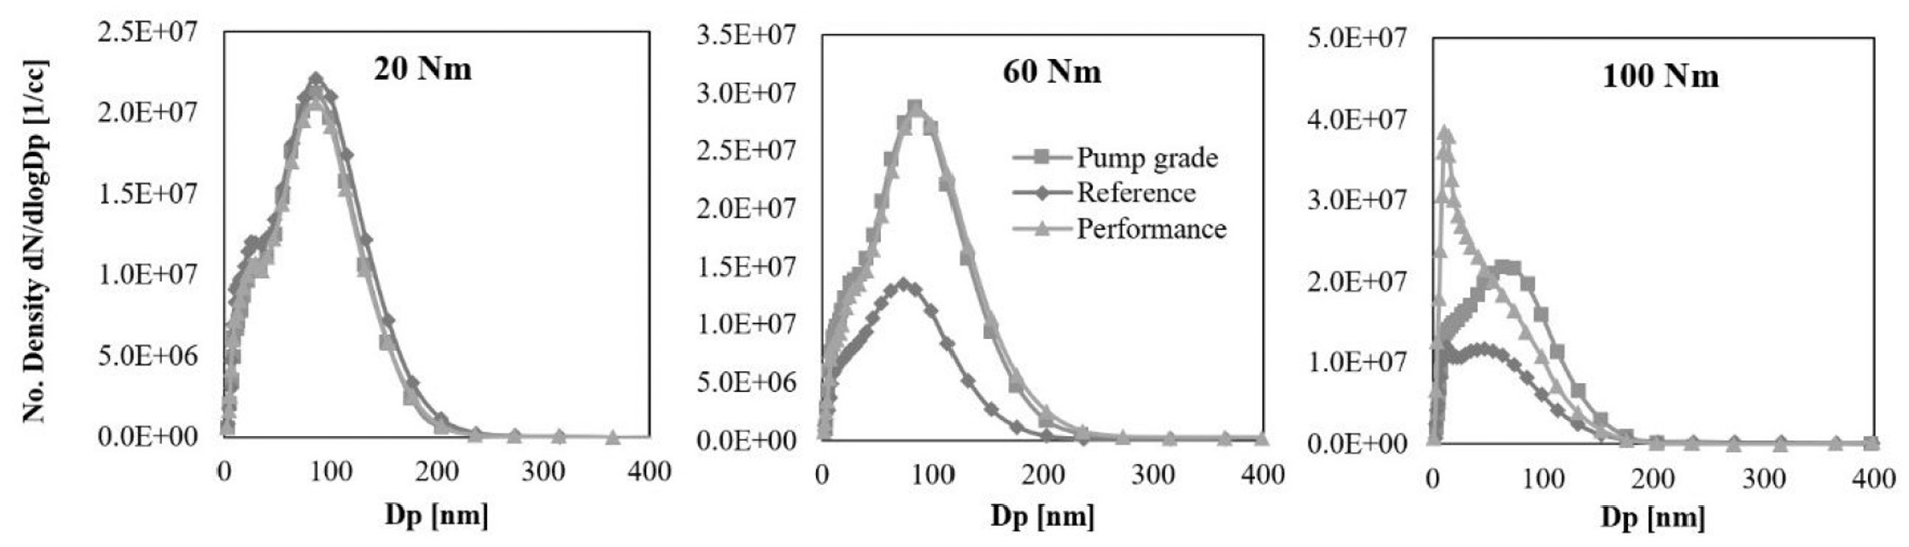
PM size distribution with various fuels at different loads (fixed engine speed of 3000 rpm).
Figure 11 provides a representative example of how the effects of fuel composition depend on the engine operating conditions. A likely reason for the fuels behaving similarly at lower engine load and differently at higher load is the different in-cylinder temperature which establishes during combustion at different loads. Since chemical reaction rates are strongly temperature-dependant, at higher load and temperature level, the differences caused by various reaction pathways become more pronounced. Vaporisation characteristics of the fuels also differ between fuels however (vapour pressure, latent heat, etc.). Consequently at higher running points where injection pressure is increased, spray dynamic characteristics typically become more consistent between cycles (due to geometrical design of the cylinder, high fluid momentum, reduced injection time, etc.) and thus the fuels contribution to variation may be emphasised as they become the limiting factor to improving mixture homogeneity (i.e. rate of droplet vaporisation, heat required for liquid pool dissipation, etc.). Exactly how the chemical composition of these fuels contributes to the resultant PN profiles however is beyond the scope of this study.
As reported in the methodology section, the impact of fuel type/composition was further investigated through single variable sweeps, including injection pressure and spark timing. The results for the injection pressure sweep – at 60 Nm torque – are presented in Figure 12. The top plots show particle size distributions, and the bottom plots the corresponding total number concentrations, total mass and the average particle size (GMD). As a general trend, it is evident that increasing the injection pressure reduces PN, without causing any major alterations to the form of the particle size distribution. The total number density plot shows that increasing injection pressure between 73 and 153 bar, reduces PN by 28% between 1.3 × 10⁷ and 0.9 × 10⁷ for the Reference fuel, while the reduction is more pronounced for the Pump-Grade fuel and the Performance fuel (41% and 46%, respectively). The average particle size (GMD) is approximately constant at 41, 46 and 48 nm for the Reference, Pump-Grade and Performance fuel, respectively.
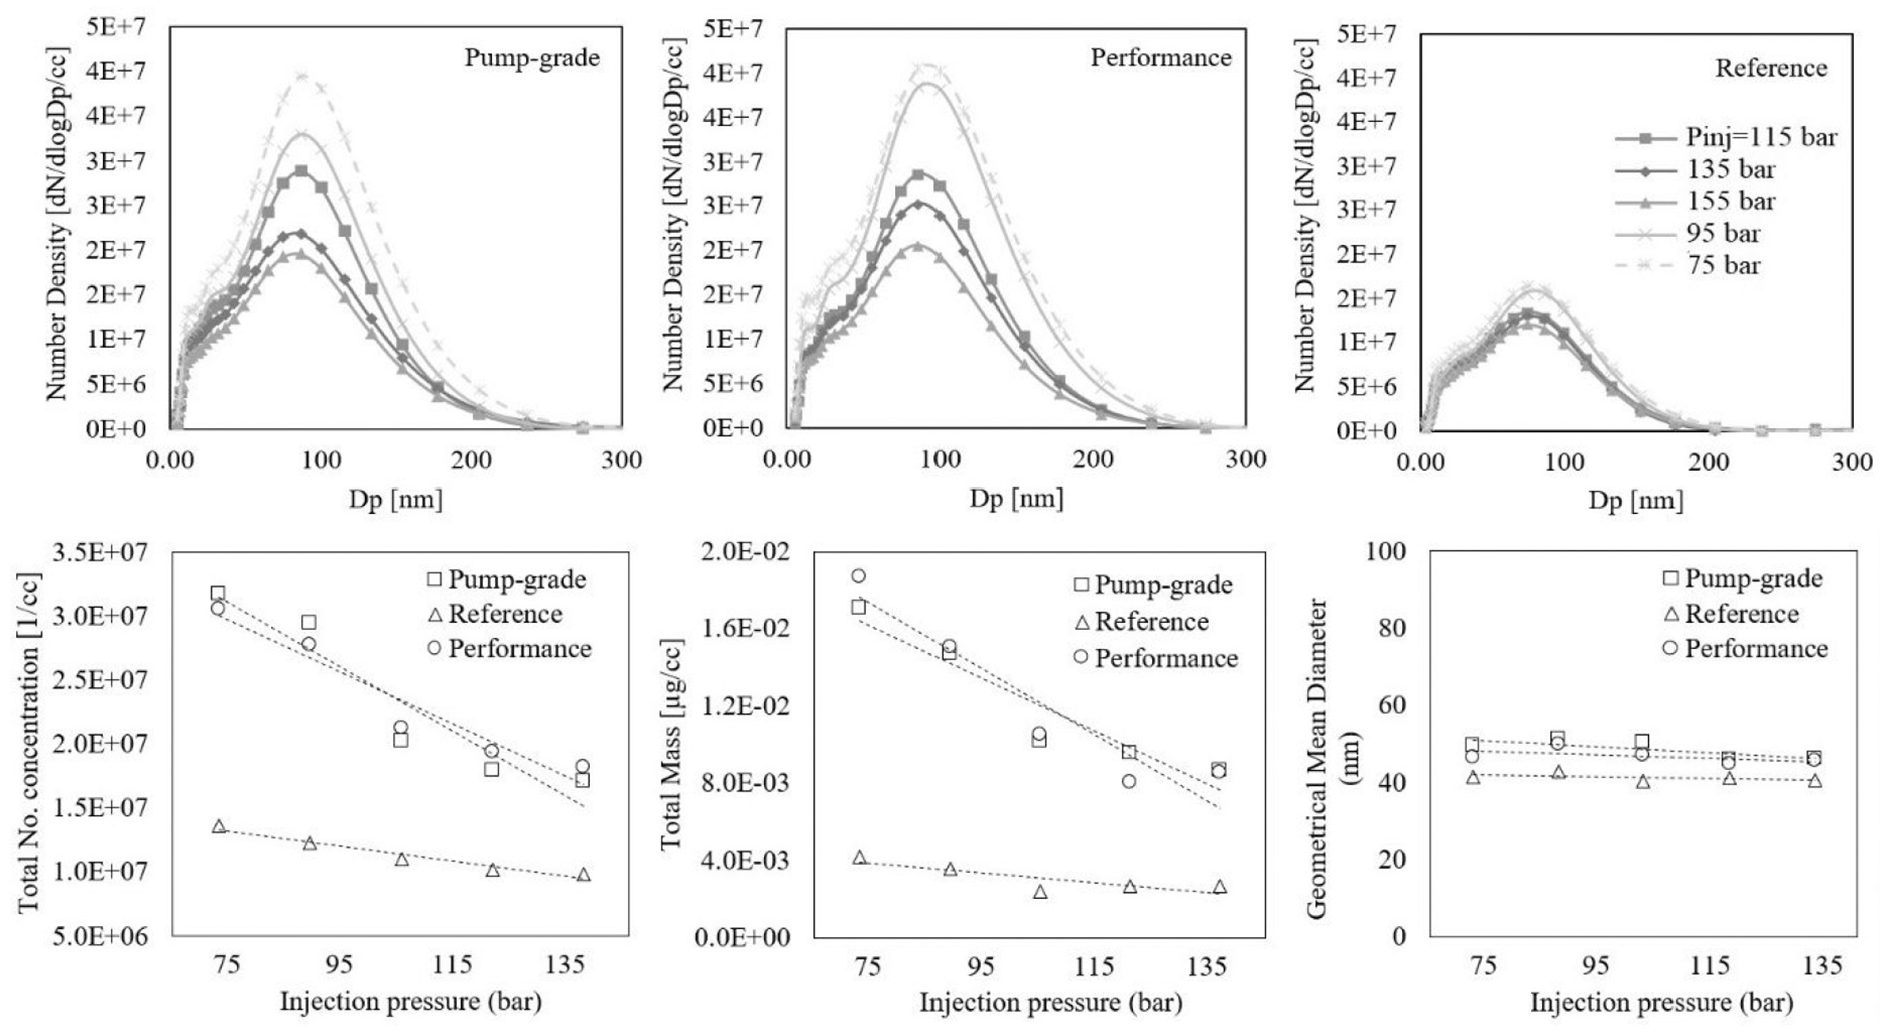
Effect of injection pressure on PM, with various fuels.
The reduction in PN seen at increasing fuel rail pressure would take place through multiple mechanisms. Injecting the fuel with a higher rail pressure leads to formation of smaller droplets in the spray, and therefore faster evaporation and improved mixing, which in turn mitigates PN formation. The relation between improved spray atomisation and reduced PN has been reported by several authors, for instance by Frottier et al. 31 Also, since the start of injection was the same for all the cases, the shorter injection duration which comes with higher injection pressure means that the injection is ended when piston is further from the injector/spray, and therefore the likeliness of piston surface wetting, which can result in liquid fuel film deposition 32 is reduced. Formation of such fuel film is a major contributor to PN as liquid fuel film may not fully evaporate and mix with the charge prior to start of combustion, often leading to pool fire or locally fuel rich pockets in the mixture and thus soot formation. 33 Another mechanism of PM formation, which can be possibly partially mitigated by higher injection pressure, is injector’s tip wetting, leaving a liquid residue to slowly vaporise, lowering the mixture quality.34,35
Interestingly, the bottom plot in Figure 12 also shows that the PN variation span due to changes in injection pressure is the smallest in the case of Reference fuel. Having the lowest vapour pressure, and the highest T10, T50, T90, and FBP (Table 3), the Reference fuel is the least volatile fuel among the three tested gasolines. Low volatility might be the reason for lower sensitivity of PN to injection pressure. The air-fuel mixture forms when the injected fuel stream breaks up into small droplets in the spray and evaporates. The rate of this evaporation is limited by both the size of the droplets (surface to volume ratio) and the volatility of the fuel. If the fuel is highly volatile, size of the droplet is the rate-limiting parameter and smaller droplets formed by higher injection pressure can readily translate into higher vaporisation and mixing rates. However, if the volatility is low as observed in the case of the Reference fuel, it will have a rate-limiting effect on vaporisation and the benefit of smaller droplets – achieved by higher injection pressure – will be modest.
Results concerning the sweep of spark timing in combination with different gasoline fuels are reported in Figures 13 to 16. Figure 13 shows average particle size distributions and corresponding total quantities (number concentration, mass concentration and GMD). Generally, it is observed that retarding the spark timing reduces PN and pushes the distributions to the left, increasing the relative proportion of nucleation phase particles, similar to the observations reported by Xie et al. 36 However, once the spark timing is retarded as far as 20 CAD BTDC, some large (i.e. accumulation phase) particles start to appear. The total number density plot shows that retarding spark timing between 43 and 3 CAD BTDC, reduces PN by 51% from 1.22 × 10⁷ to 0.59 × 10⁷ for the Reference fuel, while the reduction is less pronounced for the Pump-Grade fuel and the Performance fuel (20% and 17%, respectively). The corresponding reduction in GMD is similar across the three fuels, with GMD between 40 and 50 nm at baseline conditions and reducing by 38% to 49% over the swept spark timing range (corresponding to the distribution shift). The combination of size distribution shifting to the left and greater number of large particles (above 200 nm), appears to generate a quadratic relation between total particulate mass and spark timing, as shown in Figure 13. A simple regression analysis of the limited data available for the present study shows that optimal particulate total mass minimum for all fuels is located at the same spark timing of 23 CAD. Over the swept spark timing range, the Performance fuel shows a notable 150% (∼0.018 µg) increase in total particulate mass either side of the minimum; the Reference and Pump-Grade demonstrate also an increase in particulate mass, but limited to around 50% (∼0.004 and ∼0.001 µg, respectively).
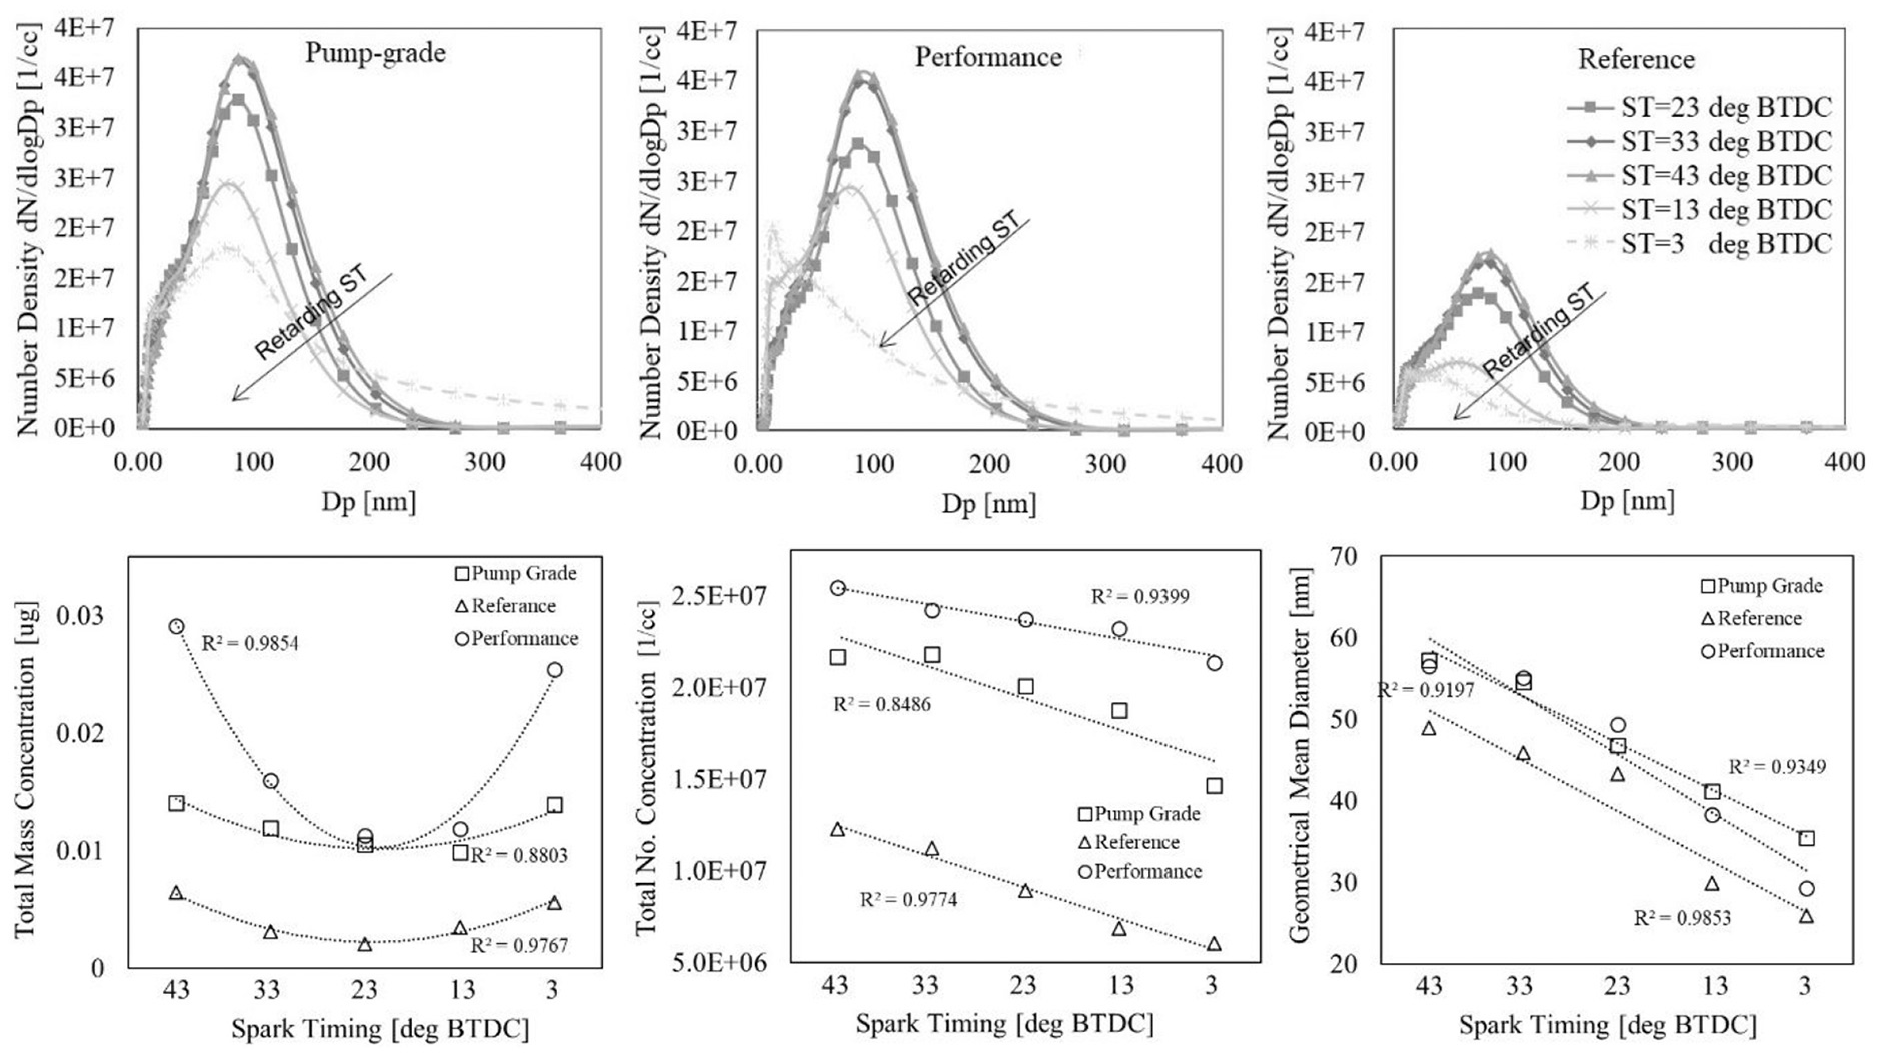
Sweep of ignition timing with various fuels.
Spark timing retard may influence soot formation and output in two different ways. One is by extending the mixing time, allowing better mixing before the start of combustion, which tends to reduce PN. The other is through altering the in-cylinder temperature, which is generally reduced by a later start of combustion. Figure 14 shows how maximum in-cylinder temperature is varied as spark timing is retarded. The plot has been created by simply assuming ideal gas behaviour for the trapped charge inside the cylinder during and after combustion. Lower temperature slows down the temperature-dependent fuel pyrolysis reactions which happen in the unburned fraction of the charge prior to flame arrival, as well as inside the flame in competition with oxidation, producing PAHs as building blocks of soot.
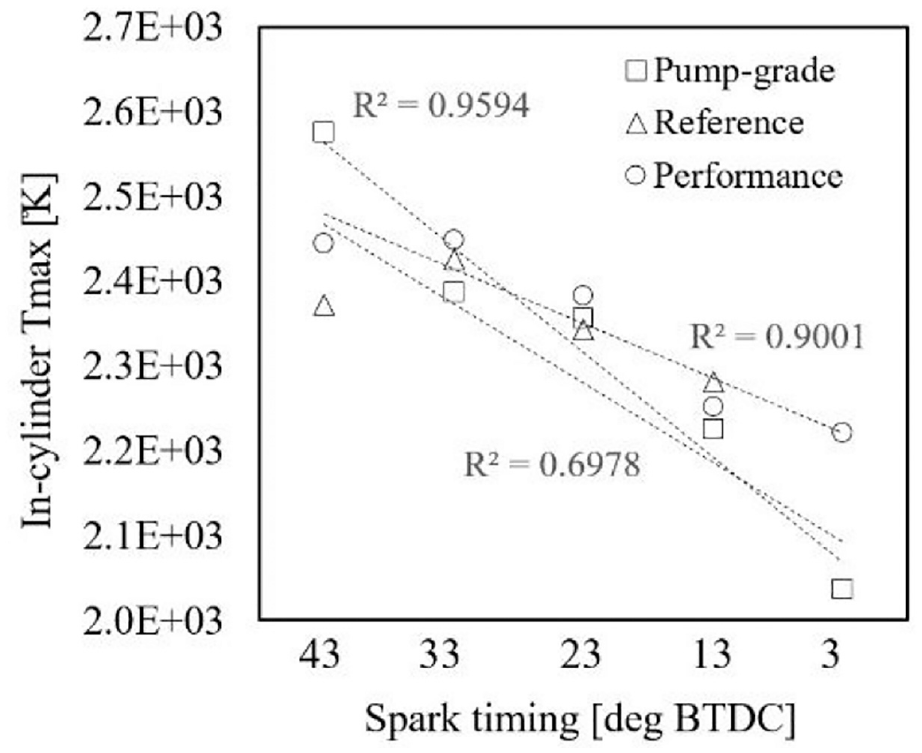
Maximum in-cylinder temperature as a function of spark timing.
With regard to the effects of fuel composition, it should be noted that soot formation and emission are the result of both physical and chemical mechanisms. Very often, and especially in engine-like conditions, separating the two classes of effects is hardly possible. For instance, even when fuel injection is carried out in nominally identical conditions, cycle-by-cycle variability combined to changes in fuel properties such as surface tension and volatility, will affect droplet formation and evaporation and ultimately mixture homogeneity. With regards to the quadratic behaviour shown by total particulate mass, spark timing retard not only reduces peak in-cylinder temperature, but also raises the average post-combustion expansion/exhaust-stroke temperature by shifting the process later in the cycle. An example of this (for the performance fuel only) is shown in Figure 15, where the temperature variation (calculated as described for Figure 14) is most prominent between 400 and 500 CAD, but continues until end of the expansion stroke (and afterwards). This may influence several competing post-pyrolysis mechanisms, seemingly favouring surface growth and coagulation of particles and leading to reduced PN and larger/heavier agglomerates.
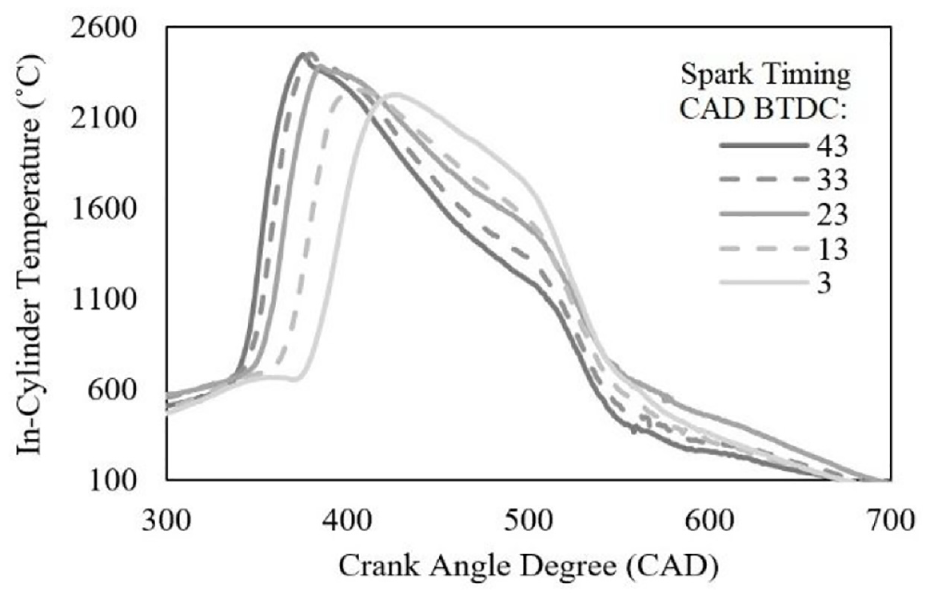
In-cylinder temperature with various spark timings. Performance fuel only. 360 CAD represents combustion TDC.
This has been demonstrated in premixed burner flames, where longer residence time in high temperature regions of the flame led to the formation of larger soot particles by surface growth and agglomeration. 37 Figure 16, which shows the correlation between the maximum in-cylinder temperature and average particles size, gives suggestion similar mechanisms take place in engines as spark timing is retarded.
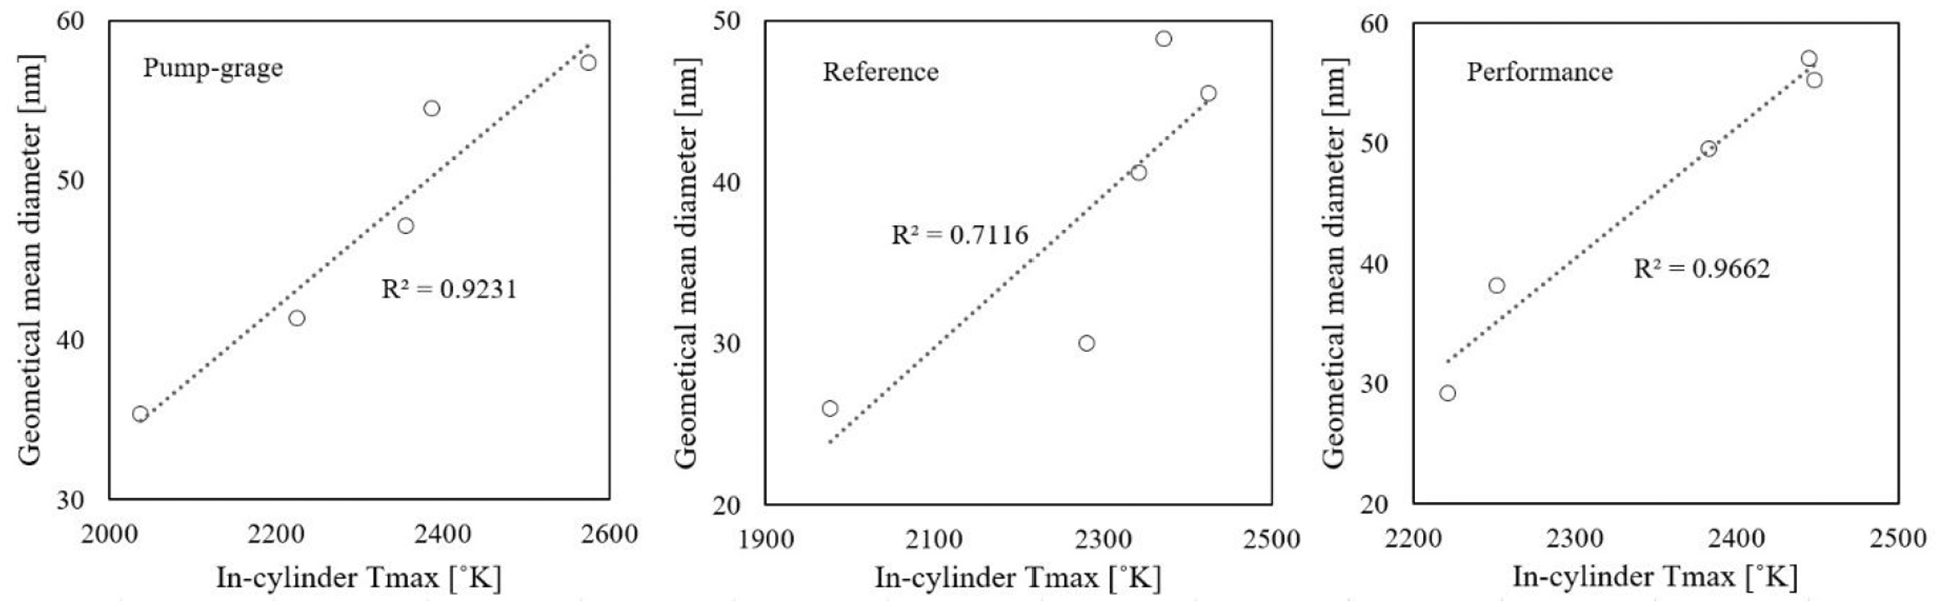
Correlation between particle size (Geometric Mean Diameter) and in-cylinder max temperature.
Figure 17 outlines the correlations between total PN and in-cylinder peak temperature across the spark timing sweeps. Order two polynomial regressions are used due to providing the highest statistical fit over a linear regression without raising the order unjustifiably further. A slightly differing trend between the Reference fuel and the other two can be observed if these polynomials are considered. Reference fuels are predominantly synthesised in laboratories, so while main chemical group percentages match those of commercial fuels, many heavier hydrocarbon components are missing. Consequently, the different behaviours may be due to chemical pathways comparatively un-available for soot formation. If we concentrate on the linear trends, all three fuels demonstrate a general increase in total PN with increased in-cylinder temperature, but a notable shift in overall magnitude is present between the Reference fuel and the other two over similar temperature ranges and engine conditions.
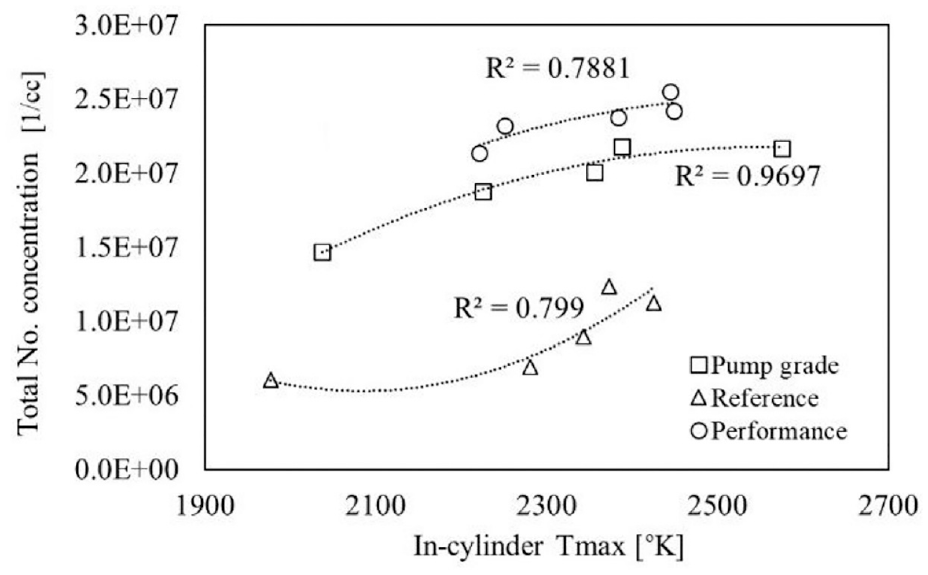
Correlation between PM total number concentration and in-cylinder max temperature.
To explore this further, Figure 18 summarises the data used in this part of the investigation, collected with three different fuels at a range of nominally equal operating conditions. Here, it is seen that the Reference fuel is consistently associated to the lowest engine-out PN emissions, with only one exception at the lowest engine load (20 Nm Test Point).
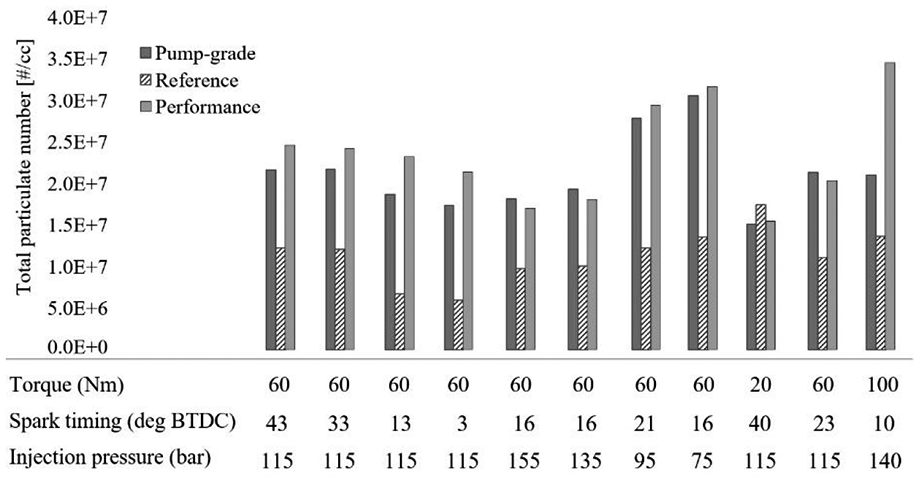
Comparison of PN emission from tested fuels. Fixed engine speed of 3000 rpm.
The Reference fuel is the least volatile in the group, and the adverse effect of low volatility on mixture quality is well known.10,38–41 In modern small-capacity GDI engines featuring high-pressure direct fuel injection, wetting of cylinder liner and/or piston and/or intake valves is almost inevitable during fuel injection, but the deposited liquid film should – ideally at least – fully evaporate and mix before ignition. If the fuel is hard to evaporate, locally rich pockets are formed in the charge and near the wetted surface, increasing PN.31,42 Since the Reference fuel has no advantage on the physical side (in this case in terms of mixture formation), it appears reasonable to attribute the lower PN tendency to its chemical composition.
The large impact of the fuel aromatic contents on PN emissions is well known.14,41 As listed in Table 3, the Reference fuel has the lowest amount of aromatics among the tested fuels (35.389%, 36.466% and 37.847% by mass for the Reference, Pump-Grade and Performance fuel, respectively). In other words, the Pump-Grade gasoline contains 3% and the Performance one contains 7% more aromatics compared to the Reference gasoline. While percentage differences are not large, the order of aromatic content magnitude seemingly agrees with the PN trend observed within the results. However, evaluating the contribution of specific aromatic groups (such as higher end C9+ aromatics) is beyond the scope of the investigation due to the available data to analyse. After the aromatic contents, other groups such as olefins and naphtenes also promote PN formation but their influence is less significant. 7 When comparing the olefin contents, the difference among the three fuels is considerable, with the Pump-Grade and Performance gasolines having 82% and 150% more olefins than the Reference one, which again agrees with the observed PN tendencies. As for Naphtenes, again Pump-Grade features 84% higher contents than the Reference fuel, while the Performance one shows a mildly lower contents (25% lower naphtenes by mass than the Reference fuel). Heavy hydrocarbons have also been identified to promote PN emissions. 7 The fuel analysis shows that Pump-Grade and Performance fuels, which exhibit higher PN emissions, contain a portion of C14+ while such compounds are not present in the Reference fuel.
In summary, the various types of gasoline tested exhibit an appreciable difference in PN level at mid and high load operating conditions (60 Nm and above). The Reference fuel which was found to emit the lowest PN is a legislative emission fuel which is used by OEMs for engine development and also in type-approval tests. The different emission levels between Reference fuel and normal Pump-Grade one become important in Real Driving Emission (RDE) testing, as these tests must be conducted using pump fuels. Based on the findings of this work, the extent to which using pump fuel increases PN emissions depends on the proportion of higher-load driving situations in the driving cycle, as the current results suggest the fuel-related variation in PN is more pronounced at higher loads. The Performance gasoline was found to emit a significant amount of ultrafine particles (<100 nm) at the higher engine loads. In real-world use, an engine running on this type of fuel is expected to experience higher loads frequently, so emitting a large amount of ultrafine particles is attention worthy, especially considering the fact that ultrafine particles impose higher health risks on the human respiratory system, compared to larger particles. 43
Conclusion
Engine testing was carried out using a modern small-capacity GDI engine to investigate PN measurement techniques and repeatability, and then the effects of various commercial gasoline fuels on PN emissions. In order to capture typical urban and motorway-like conditions, the bulk of the work incorporated engine torque between 20 and 100 Nm and engine speed between 1500 and 4000 rpm. Data analysis allows drawing the following main conclusions:
PN measurement repeatability using the Differential Mobility Spectrometer DMS-500 by Cambustion can be improved by sampling as close as possible to the exhaust valve. Highly pulsating flow at such location hinders the performance of the device, but the issue can be resolved effectively by implementing a manually or electronically controlled pressure regulator valve at the sampling line.
The effect of fuel composition on PN is more significant at higher engine loads. Since all chemical reaction rates are highly temperature-sensitive, elevated in-cylinder temperature could be the reason behind the pronounced difference in PN emissions observed at the higher loads.
Higher injection pressure has a positive impact on PN emissions; the effects of injection pressure on PN levels are more pronounced for the more volatile fuels. This is because with highly volatile fuels, finer fuel droplets – created by higher injection pressure – can readily evaporate and notably improve the quality of air-fuel mixing. In the case of low volatility fuels, volatility acts as a rate limiter and the benefit from smaller droplet size becomes modest.
Retarding spark timing generally reduces both PN levels and the average size of the soot particle population. Lower in-cylinder peak temperature is likely to reduce the rate of particle inception; shorter residence time in high temperature translates into less time for particles to grow and coalesce.
At mid and high load, the normal 95 RON Pump-Grade fuel emits higher PN compared to Reference fuel (95 RON legislative fuel). This is noteworthy as Real Driving Emission (RDE) testing is to be conducted with pump fuels. The extent of the impact of fuel composition on test results would depend on prevalence of mid to high-load driving conditions in the test.
Compared to Pump-Grade and Reference fuels, the Performance fuel tested in this work emitted a higher proportion of ultrafine particles (<100 nm) at high load. This peculiar characteristic is also worth attention as vehicles fuelled with Performance fuels are likely to operate at high load frequently.
As a whole, across the entire data set, it is evident that Reference fuel has distinctly lower PN production tendency, regardless of the engine operating condition. This indicates that the chemical composition has a dominating effect on PN emission that can dwarf the possible calibration gains. Chemical analysis suggests that this could be due to the lower content of aromatics, olefins and heavy hydrocarbons in the Reference fuel.
Footnotes
Acknowledgements
The Authors would like to thank Robert Haigh, Ford Motor Company UK, for the provision of the hydrocarbon analysis of the fuels used in this work. This paper is written in memory of our friend and colleague Mr Charlie Humphries, who contributed to the study, but sadly passed away prematurely during the current COVID-19 pandemic.
Declaration of conflicting interests
The author(s) declared no potential conflicts of interest with respect to the research, authorship, and/or publication of this article.
Funding
The author(s) received no financial support for the research, authorship, and/or publication of this article.