
Abstract
To evaluate surface flaws on the foundations of bridge structures, a stereovision-based surface flaws detection method is proposed to evaluate the geometry size of surface flaws. Both scale invariant feature transform algorithm and a feature extraction algorithm based on area matching are adopted to perform feature extraction and matching on the left and right flaw images. The three-dimensional coordinates of feature point are recovered based on the parallel stereovision model; the length and depth of surface flaw can be evaluated using the corresponding mathematics formula. Besides, two area calculation methods are employed to compute the area of surface flaw in this article. One method is accumulation of area of each triangle which is obtained by dividing surface flaw; another method is to adopt the Monte Carlo method to calculate flaw area. In situ test of surface flaws is conducted on the foundations of Yiqiao Bridge. The surface flaws such as spalling, crack, and hole are measured by the stereovision measurement system. Experimental results indicate that the stereovision-based surface flaw detection method can accurately measure the geometry size of surface flaws; this verifies that the proposed method is reliable and useful for evaluating surface flaws on structures.
Introduction
During the long-term service, bridge foundations play an important role for the safety of bridge structure. In China, most of highway bridge foundations are concrete foundations. Due to the change of external environment, all kinds of surface flaws such as crack, hole, and etch pit are formed on foundations of bridge structures as the increase of service time. These surface flaws affect the normal usage of bridge structures and seriously threat the safety of bridge structures. 1 Consequently, surface flaw detection of bridge foundations must be regularly conducted for ensuring the reliability of bridge structures.
Currently, the detection methods used for measuring surface flaws on bridge foundations mainly include the underwater ultrasonic testing method, 2 the manual visual detection method, 3 and the underwater vision testing technology. 4 The underwater ultrasonic testing (UWUT) method usually utilizes an A-scan instrument to inspect flaws. However, this technology only obtains the depth of surface flaw and cannot acquire the area of surface flaw. Besides, the UWUT method requires structural surface be polished before detection, and this increases the workload and complexity of operator. 5 The manual visual detection method can roughly evaluate the geometry size of surface flaw and cannot obtain the accurate result. In addition, the manual visual detection method has the shortcomings of limited detection capability, low inspection reliability, and high cost. 6 The traditional underwater vision testing technology can take pictures of structural surface with a single camera. This technology requires that the lens of underwater camera must be perpendicular to structural surface during test. When the angle of underwater camera or the distance between camera and structural surface is changed, camera calibration must be conducted again, and a scale is also adopted to convert the measurement unit from pixel to millimeter.7,8 Especially, the repeated calibrations increase the workload, and complexity and difficulty of measurement when the detection is conducted in water. 9
Different from the detection method using a single camera, the stereovision detection method employs two cameras and has the advantages of high accuracy, full-field, and three-dimensional (3D) measurement. Through processing images captured by two cameras, 3D structural surface can be reconstructed based on the principle of stereovision. As an visual measurement method, the stereovision method plays an important role in civil engineering and bridge engineering.10,11 More and more attention has been paid to the binocular stereovision measurement method. 12 As a result, the stereovision method is employed to evaluate surface flaws on bridge foundations in this article.
To evaluate surface flaws on bridge foundations, a stereovision-based surface flaw detection method is proposed in this article. This method recovers 3D coordinates of feature points on structural surface based on the parallel stereovision model and evaluate the geometry size of surface flaws according to the corresponding formula. For testifying the effectiveness and feasibility of the proposed stereovision method, the in situ test of surface flaws are conducted on the piers of Yiqiao Bridge at Hangzhou bay.
Parallel stereovision model
As is well known, the parallel stereovision model is the simplest and most typical binocular stereovision model, which can reconstruct the 3D coordinates of measured point based on the disparity principle.
13
As illustrated in Figure 1, supposing that the imaging planes of two cameras are located on the same plane, two cameras simultaneously look the same point

where

Parallel stereovision model.
Actually, the optical axes of the left and right cameras are not parallel when the stereovision measurement system is used to collect flaw images of structural surface; two cameras are usually placed in the general stereovision model. However, a parallel stereovision model is employed to obtain the 3D coordinates of measured point on structural surface in this article. Consequently, a transformation between the general stereovision model and the parallel stereovision model needs to be conducted, and this process is exactly the epipolar rectification.
16
The epipolar rectification changes the matrices of perspective transformation of the original left and right cameras into the new matrices of perspective transformation and makes the epipolar lines of the transformed stereo image pairs collinear. It is important to note that the intrinsic and extrinsic parameters of two cameras can be acquired by Zhang’s
17
calibration method when two cameras are placed in the general stereovision model. Subsequently, the effective focal lengths
The aim of the epipolar rectification is to drop the point matching from the two-dimensional plane into the one-dimensional straight line. This transformation can greatly reduce searching scope, save running time, and improve matching precision. Based on this consideration, the parallel stereovision model is adopted to calculate the 3D coordinates of feature point in this article. From equation (1), if
Stereovision-based surface flaws detection method
Evaluation of surface flaw needs to measure the length, width, depth, and area of flaw. Therefore, the geometry size of surface flaw can be classified into two types: (1) length and depth measurement and (2) area measurement. The detailed evaluation method of each type is described in the following.
Calculation of the length and depth of flaw
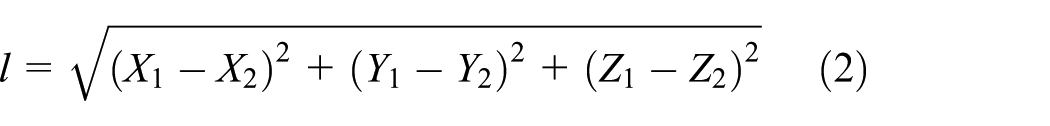
If the 3D coordinates of a point can be obtained by equation (1), the length and width of flaw can be calculated according to the formula of distance between two points in mathematics. Assuming that the 3D coordinates of two spatial points
Other than the calculation of length and width, computing flaw depth is relatively complicated. Actually, the depth of some point is a relative value, and this means the depth is relative to some reference plane. In general, some reference plane is exactly the structural surface where the flaw is located. Therefore, the key issue is how to obtain the equation of structural surface. In this article, the equation of structural surface where flaws lie is established by any three points
Supposing that the 3D coordinates of any three spatial points

where
As a result, the depth of point

where the 3D coordinates of point
Calculation of flaw area
For flaw area detection, the monocular vision method is the common technology which requires camera be perpendicular to surface flaw. In addition, a scale also needs to be put close to surface flaw for converting measurement unit from pixel into millimeter. The disadvantage of monocular vision method is the requirement on the position between camera and the measured surface, that is to say, the measured surface flaw must be perpendicular to the optical axis of camera. However, this requirement can only be accomplished in lab and cannot be conducted in actual engineering. As a result, the flaw area calculation algorithm based on stereovision is presented to deal with this problem in this article.
Actually, there is the great uncertainty about the shape of surface flaw. In most cases, some surface region where flaw is located can be approximately regarded as a plane. Only in rare cases, some surface region where flaw is located is not a plane but a curved surface. Therefore, calculating flaw area needs to consider its projected area on a reference plane like depth computation. If the original surface of measured flaw is a plane, then the projected area of flaw on the plane is exactly the flaw area itself. If the surface of measured flaw is a curved plane, and then the flaw area is its projected area on a reference plane. As a result, how could choose any three suitable points to establish a reference plane is very important, which are not line up.
As shown in Figure 2, the flaw edge is supposed to be clear and easy to be chosen by mouse. Assuming that
Computing the normal vector of the reference plane.
Any three feature points
Recovering the 3D coordinates of feature points on flaw edge.
Feature points of flaw edge on the left image are sequentially selected. In the meantime, the corresponding points on the right image are automatically matched. Then the 3D coordinates of these points,
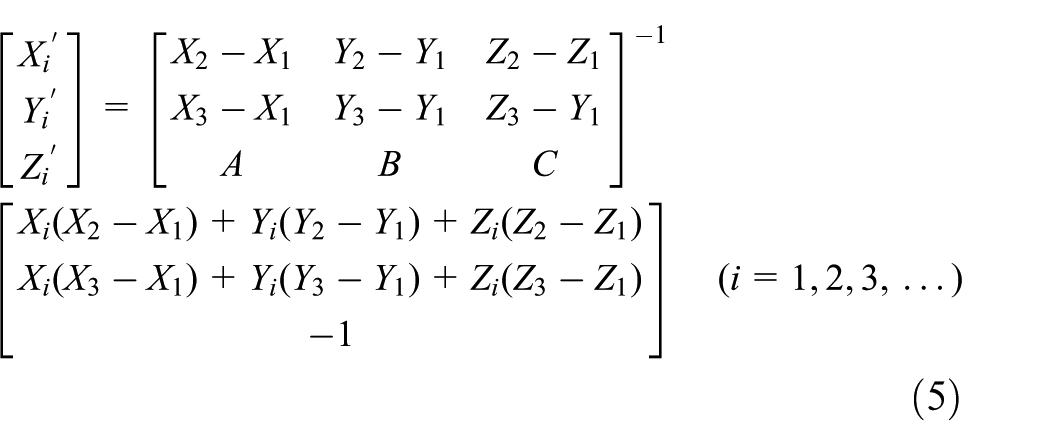
Calculating the 3D coordinates of projected point on the reference plane.
As shown in Figure 2, these selected edge points are projected on the reference plane. Supposing that the 3D coordinates of these projected points on the reference plane are
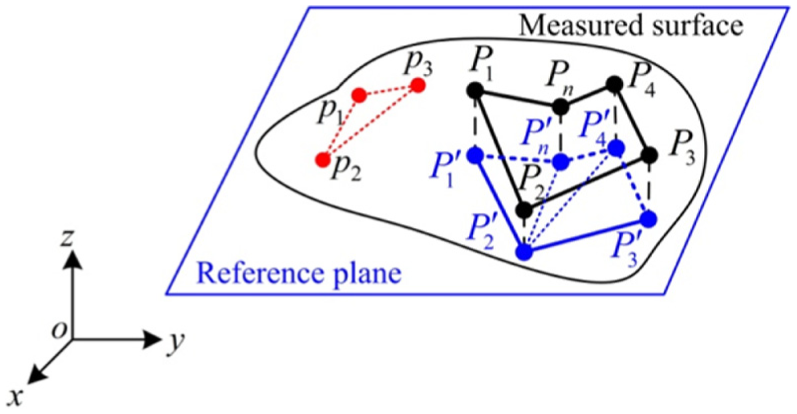
Sketch map of flaw area projection.
Due to
In this article, two methods are adopted to compute the projected area of a polygon. One method is accumulation of area of each triangle, which is obtained by dividing the polygon. Another method is to adopt the Monte Carlo method to calculate the flaw area. The detailed calculation process of each method is described in the following.
An n-vertex polygon on the reference plane is obtained by connecting these projected points sequentially, and then this polygon can be divided into n − 2 triangles based on a certain vertex, as shown in Figure 2. Therefore, the total area of flaw on the reference plane is accumulated by figuring up the area of each triangle. The area of a triangle is given according to Heron’s formula20,21

where
However, the above accumulation method needs to compute three sides of each triangle, and much time has to be spent during this process. To improve computation efficiency, Monte Carlo method is adopted to calculate flaw area. 22 In essence, Monte Carlo method is a kind of numerical method which utilizes the probability to deal with problem through a large number of random trials, and this thought is based on the similarity between probability and volume. In Monte Carlo method, the solved problem is the probability of some random event or the expectation of some random variable. At this moment, through test method, the frequency which is used to replace the probability or some numerical characteristic of random variable can be regarded as the solution to problem.
In solving the problem of polygon area, the total area is assumed to be
Assume an event

As a result, when
In this article, Monte Carlo method is selected to calculate the area of polygon accordingly. Before computing flaw area, the problem that how many points

Sketch map of flaw area calculation by Monte Carlo method.
As shown in Figure 3, there are six points on the edge of polygon, which are sequentially selected by mouse. It is important to note that the first point is very close to the sixth point, and these two points can be seen as a point. In Figure 3, connecting each point in sequential order constitutes the closed region, which is exactly the flaw area needed to be solved. The white polygon is surrounded by the external black rectangle. The length of the rectangle is

As a result, the area of white polygon is acquired in the following. Equation (9) is exactly the formula of flaw area

From the above calculation, it can be seen that 3D coordinates of feature point are required for flaw evaluation. It is worth noting that any feature points on structural surface are also feature points on flaw images captured by the left and right cameras, respectively. According to the disparity of the same feature point on the left and right images, the binocular stereovision approach is employed to reconstruct the 3D coordinate of feature point through feature extraction and matching. Therefore, the main problem of surface flaw evaluation is how to identify the same feature point on the left and right images.
Feature extraction
In this article, two kinds of feature point extraction algorithm are used to match feature points on the left and right images.
Scale invariant feature transform algorithm
Currently, there exist all kinds of feature point extraction algorithms such as Harris corner detection algorithm, 24 SUSAN corner extraction algorithm, 25 and scale invariant feature transform (SIFT) algorithm.26,27 Because of the robustness to distortion, noise, changes in light intensity, and so on, SIFT algorithm is adopted to automatically extract feature points on the left and right images in this article.
On the base of scale selection of image feature, SIFT operator builds the multi-scale space of image, and the Gauss pyramid image is developed by the continuous filtering with the different scale Gaussian kernel functions and down-sampling. Then, the multi-scale difference-of-Gaussian (DOG) space is gained through subtracting two adjacent scale Gaussian images. Furthermore, each point is compared with the adjacent scale and the position point in DOG scale space, and the local extreme position, namely the position of feature point and the corresponding scale, is achieved. Finally, the feature point is precisely located by curve-fitting; some points with lower contrast and edge points are removed. The feature extraction process of SIFT algorithm is shown in Figure 4.

Feature extraction process of SIFT algorithm.
In this article, the threshold value controls the amount of feature points extracted by SIFT algorithm. Through testing, the extraction amount of feature points is proper when the threshold is about 0.65; this can meet the demand of multipoint measurement in engineering. The nearest-neighbor algorithm 28 is utilized to match feature points extracted by SIFT algorithm. The Euclidean distance of each feature point’s descriptor is computed, and two feature points with the shortest Euclidean distance can be seen as the matching point. To improve matching accuracy, the limit constraint and uniqueness constraint are adopted to remove point pairs that cannot comply with these two constraints.
As illustrated in Figure 5, blue points on the left and right flaw images, which are expressed by the same number, are the feature points extracted by SIFT algorithm. Any three points numbered 2, 154, and 43, which are not located on surface flaw, are selected to build the reference plane, namely the structural plane where surface flaw is located. As can be seen from Figure 5, SIFT algorithm only automatically extracts some feature points on the local region of surface flaw and cannot position other region where feature points cannot be extracted by SIFT algorithm. This means that the flaw evaluation cannot be conducted on some region where even surface flaw is existed.

Establishment of the equation of structural plane: (a) left image and (b) right image.
Feature extraction based on area matching
To randomly extract any feature point on structural surface, a feature extraction algorithm based on area matching is presented to deal with this problem in this article. In this algorithm, any feature point on the left image is extracted by mouse, and then the corresponding point on the right image is automatically matched through area matching. To accomplish this algorithm, both the correlation criterion and the window size of area matching need to be confirmed in advance.
Nowadays, there exist many correlation criteria that can conduct area matching,
29
such as the sum of squared differences (SSD) criterion, the normalized sum of squared differences (NSSD) criterion, the zero-normalized sum of squared differences (ZNSSD) criterion, the cross-correlation (CC) criterion, the normalized cross-correlation (NCC) criterion, and the zero-normalized cross-correlation (ZNCC) criterion. These correlation criteria can be divided into two groups, namely CC criteria and SSD criteria.
30
It is important to note that the CC criteria are related to the SSD criteria. Among these correlation criteria, both the ZNCC and ZNSSD correlation criteria have the most robust noise-proof performance and are insensitive to the linear scale and offset in lighting on the left and right images. Considering the requirement of application, the ZNCC correlation criterion is chosen to conduct area matching; the ZNCC correlation criterion

where
The important assumption of area matching is that the disparity value of pixel is continuous within the matching window. To achieve high-reliability matching, the enough image information should be contained in matching window. This means that the matching window should be big as possible for improving the signal-to-noise ratio of matching window. However, if the window size is too big, the discrete disparity area forms due to the discontinuous depth, and this is contrary with the assumption of area matching. Besides, the over-smoothing disparity map may result in the edge blurring of object. Therefore, the reasonable selection of window size is very important for area matching
To acquire the disparity map of Tsukuba image pair, the ZNCC correlation criterion is used to conduct area matching with the different window sizes. As shown in Figure 6, the Tsukuba image pair comes from the Middlebury database. 31 Currently, many scholars adopt the pictures in the Middlebury database to testify all kinds of image algorithm. Three groups of window size are used to calculate the disparity map, which are 7 × 7, 15 × 15, and 21 × 21; the calculation results are given in Figure 7.

Tsukuba image pair and disparity: (a) left image, (b) right image, and (c) disparity map.

Disparities of different windows sizes: (a) 7 × 7 window, (b) 15 × 15 window, and (c) 21 × 21 window.
As can be seen from Figure 7(a), the disparity map of Tsukuba image pairs is discontinuous and seems to be broken when the window size is 7 × 7. Although the disparity map has good continuity in Figure 7(c), the edge and detail are blurry when the window size of 21 × 21 is utilized. As shown in Figure 7(b), only the window size of 15 × 15 acquires the disparity map which has the good continuity and outstanding detail. Therefore, the window size of 15 × 15 is chosen to perform area matching in this article.
Comparison test
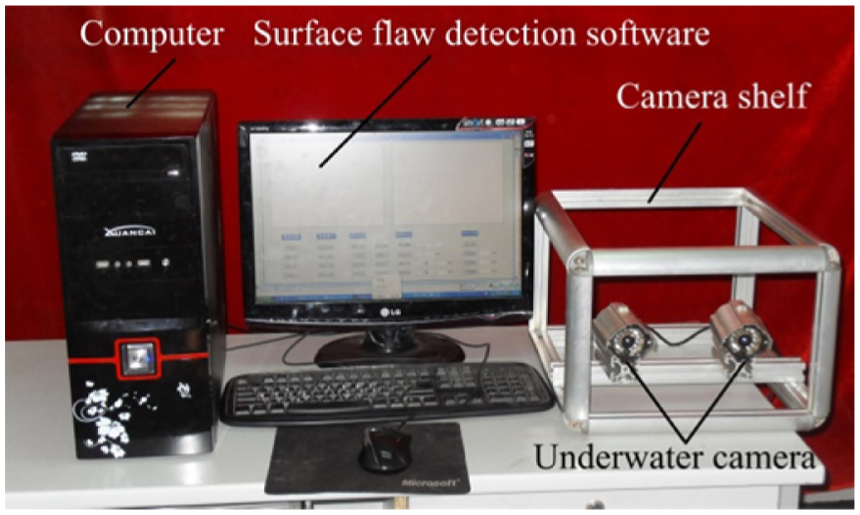
As shown in Figure 8, the underwater stereovision measurement system includes a computer, two underwater charge-coupled device (CCD) cameras, camera, shelf and surface flaw evaluation software, this system can collect flaw images and evaluate surface flaws. Considering working environment, two DV-24520 CDW underwater cameras are employed to integrate the stereovision measurement system. The cameras with the lens of 6mm fixed focal length could record images with a pixel resolution of 752 × 576 at 25 fps, and they are equipped with the built-in led light with the minimum illumination of 0.5lux. In addition, the underwater cameras carry 30 m heavy-duty double-shielded cables to connect with the computer. This stereovision measurement system can realize the synchronous trigger of two CCD cameras through the software and hardware controls.
Underwater stereovision measurement system.
As shown in Figure 8, the outline border of camera frame is made of aluminum alloy, whose geometry size is 200 mm × 300 mm × 300 mm. Two cameras are mounted on the sliding beam, and the sliding beam can move on the border to control the distance between two cameras and the detected structural surface. To obtain the clear field-of-view, the outer shell made of stainless steel and perspex is manufactured to hold clear water.
Length and depth measurement test
To verify the proposed stereovision algorithm, three steel specimens are used to conduct the precision test in lab. As illustrated in Figure 9(a), the size of steel specimen is 110 mm × 110 mm × 20 mm; these three specimens, which are put in water tank, are set as shown in Figure 9(b) and (c). During test, the angle between two optical axes of cameras is about 10°, and the optical center distance of two CCD cameras is about 175 mm.

Photos of precision test: (a) steel specimens, (b) left image, and (c) right image.
Before test, the waterproof plane pattern is used to calibrate the stereovision measurement system. According to Zhang’s calibration algorithm, the intrinsic and extrinsic parameters including the nonlinear distortion factors of the stereovision measurement system are all obtained; then
During test, three corner points
In the same way, the 3D coordinates of the out-of-plane point
Distance measurement results between two points of two methods.

Table 1 indicates that the distance between the out-of-plane point
Area measurement test
To verify the precision of area measurement of Monte Carlo method, an area measurement test is conducted on a checkboard, which has eighty-one 30 mm × 30 mm black and white squares.
First, four feature points on left image in Figure 10(a) are selected by mouse and shown in the red cursors, the corresponding feature points on right image can be obtained by area matching, and the image coordinates of each feature point on left and right image can be obtained accordingly. One thing needs to be noted that only the left images of measured areas are illustrated in Figure 10. Each measured area on checkboard is given in a closed green curve in Figure 10. Since each square on checkboard is known, each measured area on checkboard can be calculated to compare with the calculation results of Monte Carlo method.

Measured area on checkboard with Monte-Carlo method.
Then, 3D coordinates of each feature point can be gained according to equation (1). Because the surface of checkboard is a plane,the reference plane is exactly the plane where the checkboard is located. Therefore, the z coordinate value of each feature point is set to be 0. The x and y coordinate values of each feature points are the real physical coordinates of checkboard.
Subsequently, the measured area is filled by white color, as shown in Figure 3, and the pixel numbers of measured area are counted accordingly. In Figure 10(a), the measured area on checkboard is equal to the area of external rectangle; therefore, the pixel numbers of external rectangle are equal to the pixel numbers of measured area. Finally, the measured area in Figure 10(a) can be calculated according to equation (9).
In the same way, other seven measured areas in Figure 10 can also gained through above process, and the area measurement results obtained by Monte Carlo method are given in Table 2. From Table 2, when Monte Carlo method is used to calculate the area, the maximum relative error of area calculation of checkboard is 0.97%, and the average relative error is 0.44%. Experimental results show that Monte Carlo method can achieve the higher area measurement precision.
Area measurement results by Monte-Carlo method.

In addition, the performance evaluation test of the stereovision measurement system is conducted in lab, which include the comparison tests on the different measurement distances between cameras and specimen, different sloping angles, and different turbid waters. Experimental results show that the sloping angle of cameras has little effect on the measurement result, and the stereovision system has a better stability and precision at the object distance of 0.1–0.5 m. In turbid water, the image quality has impact on measurement results. Therefore, if possible, the detection test should be proceeded in clear water to obtain clear images.
To sum up, above two comparison tests demonstrate that the proposed stereovision-based surface flaw detection is effective and reliable, and the proposed stereovision method can be used to detect surface flaws on foundations of bridge structure.
Surface flaws detection test of Yiqiao Bridge
Experimental setting
The Yiqiao Bridge across Puyang river was opened to traffic in December 1995 and links the north and south sides of Yiqiao town of Xiaoshan district of Hangzhou city. The Yiqiao Bridge is the overall length of 420 m with six spans of 30 m and twelve side spans of 20 m, and the deck width is 12 m, which includes 9 m driveway and 1.5 m pavement of each side. The piers photo of Yiqiao Bridge is shown in Figure 11; each main pier of substructure includes three cast-in-place concrete piles, whose diameter is 150 cm, and each side pier is composed of two bored piles with 120 cm diameter.

Pier photo of Yiqiao Bridge.
As illustrated in Figure 12, the main piers of Yiqiao Bridge are consecutively numbered 5–11 from north to south, and each main pier has three concrete piles arranged from east to west. As service time increases, all kinds of flaws can be found at the different parts of Yiqiao Bridge. To evaluate the safety condition of Yiqiao Bridge, the foundation is inspected with the underwater stereovision measurement system in this article.

Sketch map of piers of Yiqiao Bridge: (a) serial number of main pier and (b) profile of main pier.
During test, the camera frame (see Figure 13(a)) containing two cameras is put into the outer shell (see Figure 13(b)), and then clear water is poured into the outer shell. It should be noted that two cameras must face the perspex surface of outer shell, as shown in Figure 13(b). The perspex surface of outer shell is placed closely to the measured pier by a metal rod, as illustrated in Figure 13(c). This metal rod fixed on the top of outer shell can control the lifting and steering of cameras; two cameras can see the pier’s surface clearly within 15 cm in front of lens. As a result, the distance between cameras and pier must be kept within 15 cm during detection.

Photos of camera shelf: (a) side view, (b) outer shell, and (c) top view.
Experimental results and discussions
During the in situ test of Yiqiao Bridge, the main piers numbered from 5 to 11 are measured one by one. Big flaws are rarely found on these main piers, and flaws located on piers are close to water surface. Only the detection results of several typical flaws are given in this article.
Concrete spalling measurement
The concrete spalling is located on the west pier of the eighth main pier. During test, the left and right images of concrete spalling are synchronously captured by the stereovision measurement system in this article. The feature extraction results of SIFT algorithm are shown in Figures 14 and 15. It can be seen that there exist enough feature points to evaluate the concrete spalling in Figures 14 and 15. To measure the depth of concrete spalling on the west pier, three feature points numbered 2, 108, and 114 are selected to establish the reference plane.

Depth measurement result 1 of concrete spalling depth.

Depth measurement result 2 of concrete spalling depth.
As illustrated in Figures 14 and 15, the black triangle is the reference plane built by these three points; the stars show the positions of feature points whose depth need to be measured, the numbers of feature points are 71 and 16, respectively. According to the proposed stereovision method in this article, the depths of two feature points are 75.1 and 78.0 mm, respectively. Taking an average of two values, therefore, the depth of concrete spalling is about 76.6 mm.
Hole measurement
The hole is located on the middle pier of the seventh pier, and the detection result of the hole is shown in Figure 16. As can be seen from Figure 16, the blue points on the left and right images are feature points extracted by SIFT algorithm. However, there exist no feature points on the hole, and only a little feature points surround the hole. Figure 16 indicates that SIFT algorithm cannot automatically extract enough feature points for evaluating the geometry size of hole. To deal with this problem, the proposed feature extraction algorithm is adopted to extract feature points.

Measurement result of hole’s depth and width.
Among feature points extracted by SIFT algorithm, three feature points numbered 13, 30, and 55 are chosen to establish the reference plane by the proposed feature extraction algorithm. In Figure 16, the reference plane is expressed by the black triangle, and the feature point selected by the proposed feature extraction algorithm is marked as the red cursor. This red cursor surrounded by a black star (see Figure 16) is the position of measured depth of hole; the green line linking two red cursors denotes the maximum width of hole. As can be seen from Figure 16, the depth of hole is 59.8 mm, and the maximum width of hole is 107.1 mm.
Figure 17 gives the detection result of hole area. Three feature points selected by the proposed feature extraction algorithm are marked as blue cursors in Figure 17 and used to build a reference plane. However, the reference plane is not marked in Figure 17; the aim is to avoid covering the hole region and influence the area measurement. As shown in Figure 17, the hole edge is drawn in the black curve and the hole area is expressed by red color. According to Monte Carlo method, the hole area is 16,758.25 mm2. It can be seen that the selected red color region in Figure 17 is less than the hole region in Figure 16. The reason is that the depth of the unselected region is relatively shallower, and it has a greater difference from the depth of the selected red region. Therefore, the hole area computation only considers the deeper red region of hole.

Measurement result of hole area.
From the measurement results of concrete spalling and hole, the reference plane influences the detection result of surface flaw; the reason is that the area and depth calculation are related with the reference plane. Consequently, we had better select any three feature points on structural surface where no flaw can exist.
Concrete crack measurement
The concrete crack is located on the east pier of the seventh pier. Due to the limited distance between the cameras and the seven piers, two cameras cannot shoot the full picture of crack and only capture the local field-of-view of concrete crack. Therefore, the overall length of concrete crack cannot be acquired in this article, Figure 18 only gives the measurement result of crack width. Among the blue points extracted by SIFT algorithm, three feature points numbered 7, 10, and 19 in Figure 18 are chosen to establish the reference plane which is drawn in the black triangle. In Figure 18, the distance between two feature points numbered 52 and 43 is the maximum width of concrete crack, which is 93.7 mm.

Measurement result of concrete cracking.
From the above measurement results, the surface flaws on the foundations of Yiqiao Bridge are damaged in different degrees. These flaws are mainly located on the junction between pile and column. Especially, the surface flaws located on the sixth and seventh piers are the most serious damage. The reason is that the navigation span of Yiqiao Bridge is located between the sixth and seventh piers. The damages of concrete are also found on the joint between pile and column accordingly, which are impacted by ships. Besides, Yiqiao Bridge is lying at the joint of Puyang River and Qiantang River where there is the rising tide. The currents continually scour concrete members on the joint between pile and column, and this also leads to concrete spalling and corrosion of steel bars on the joint between pile and column.
Conclusion
To measure surface flaws on piers of bridge structures, a stereovision-based surface flaw detection approach is presented in this article. Both SIFT algorithm and a feature extraction algorithm based on area matching are employed to match feature points on structural surface, and the comparison test of distance measurement is performed on steel specimen to verify the effectiveness of the latter algorithm. Two area calculation methods are employed to obtain the area of surface flaw in this article. One is accumulation of area of each triangle which is obtained by dividing surface flaw, and the another is to adopt the Monte Carlo method to calculate the flaw area. Checkboard area measurement test verifies that the Monte Carlo method has a higher measurement accuracy. Based on the above algorithms, the surface flaw detection software is compiled and the underwater stereovision measurement system is integrated to evaluate surface flaws on bridge structures. In situ tests of surface flaws are conducted on the piers of Yiqiao Bridge at Hangzhou bay, surface flaws such as spalling, concrete crack, and hole on piers are detected by the stereovision measurement system. In situ experimental results show that the stereovision-based surface flaw detection approach can accurately evaluate the geometry size of surface flaw; this suggests that the proposed stereovision method is feasible and useful for evaluating different types of surface flaws on piers of bridge structures. As can be seen from the in situ test of Yiqiao Bridge, if clear image can be captured and enough feature points can be extracted, the good measurement results can be achieved accordingly. For the image quality influences measurement result, we suggest that high performance cameras should be adopted to detect surface flaws in test.
Footnotes
Academic Editor: Simon Laflamme
Declaration of conflicting interests
The author(s) declared no potential conflicts of interest with respect to the research, authorship, and/or publication of this article.
Funding
The author(s) disclosed receipt of the following financial support for the research, authorship, and/or publication of this article: This article is supported by the National Natural Science Foundation of China under grant no.51478148, the Natural Science Foundation of Heilongjiang under grant no. E201434, and the foundation of Harbin City under grant no. 2015RAQXJ028.