
Abstract
Road traffic congestion has become a normal state and caused many problems in large cities of China, and lane-changing model has attracted increased attention in recent years. This study is aimed to explore the changing trend and quantify the logical relationship between driver’s heart rate and lane-changing behavior under urban traffic congestion. First, the testing scheme of driver’s heart rate and lane-changing has been designed. Tested drivers and testing paths are chosen strictly to achieve the experiments as well. Then, with the drivers’ behavior-related data, the backpropagation neural network theory is introduced to build the driver’s “pressure–state–response” model under urban traffic congestion, which takes driver’s pressure and state as input variables, and driver’s response is selected as output variables. As the result of pressure–state–response model, it is significant that effect of urban traffic congestion on driver’s heart rate and lane-changing proportion. The validation results indicate that the pressure–state–response model works well to predict the proportion of risky lane-changing, and the pressure–state–response model can be used for warning the risky lane-changing directly under urban traffic congestion.
Introduction
Drivers have lived under complicated road traffic conditions, and the continuous pressure from traffic congestion may cause drivers negative and irritable. So, the risky driving behavior is common in daily life according to the statistical data. Such as, with estimates of aggressive driving behavior reported for drivers in the big cities, it is reaching upward of 34%. 1 A lot of research has been carried out, although it is still unclear how much the risky driving behavior directly contributes to road traffic accidents. 2 The drivers always work in a certain social and traffic environment, and gradually, the mental workload of drivers is proved to be an important factor to risky driving behavior. 3 Road congestion has become a normal state in city of China, and road congestion can cause mental stress to the drivers. 4 Therefore, analysis on the driver’s physiological and psychological characteristics under the state of traffic congestion is appropriate and important in recent years.
There are a lot of driver’s physiological and psychological indexes, and how to choose them is a key problem. Based on the physiological signals, Miller et al. 5 studied a new assessment method for the driver’s mental workload. The electrocardiograph, electroencephalograph (EEG), and electro-oculogram are three kinds of physiological signals to driver’s mental workload. Ryu and Myung 6 constructed a comprehensive index to determine the driver’s mental workload via blink interval and heart rate variability. Brookhuis and de Waard7,8 simulated the driving process using driver’s heart rate and EEG parameters related to mental workload. In addition, skin potential, blood pressure, and respiration are the common driver’s physiological signals.9,10 In China, drivers reporting higher level of anger in some conditions tended to be younger and from a more congested city. 11 In recent years, driver’s characteristics have been taken into lane-changing models. 12 The driver’s characteristic data related to lane-changing are important, and Sun and Elefteriadou13,14 have designed an instrumented vehicle-based experiment to observe the drivers’ action under various urban lane-changing scenarios, and they established a driver’s lane-changing model on arterials using driver behavior–related data. For these reasons, the indexes of heart rate and lane-changing are good choices to study driver’s pressure response in congested state.
Previous research has consistently found the relationship between driving anger and aggressive driving. Driving anger is an important factor to the road accident. 15 The effect of global pressure and its joint effect with personality on driving behavior have received attention, and Ge et al. 16 showed that pressure is an important factor to risky driving behavior, but personality traits can mediate the effect on driving behavior. 17 As a basis, pattern of driver’s “pressure–state–response” (PSR) in traffic congestion has been established to reveal the characteristics of driver’s eye movement in the congested condition, and PSR model is the theoretical foundation to study the effect of traffic congestion on driver’s characteristics. 18
So, PSR model will extend to the aspect about driver’s mental workload and behavior, then the accuracy and practicability of the PSR model is also proved. Testing design and implementation scheme are the key parts to establish the effect model of urban traffic congestion.
Testing design and implementation scheme
In order to reveal the relationship between the indexes of the driver’s heart rate and lane-changing behavior under traffic congestion, the testing scheme must be designed first in actual traffic environment. The premise of testing is the selection means of the drivers.
Gender, age, and driving years for the drivers are selected as the main characteristic indexes in the experiment, and every tested driver has been chosen carefully for the experiment. Among the chosen drivers, the average age of female drivers is 33 years old, the youngest is 21 years old, and the oldest is 50 years old. Furthermore, the standard deviation of female driver’s age is 8 years. The average age of male drivers is 36 years old, the youngest is 21 years old, and the oldest is 58 years old. In addition, the standard deviation of male driver’s age is 11 years.
A total of 80 drivers have participated in the testing, and the detailed information of drivers is shown in Table 1. All tested drivers have qualified driving licenses, and the average value of their driving year is 9 years. All participants have been declared that anyone can quit the experiment by his or her own accord, if they feel discomfortable during the process of testing.
Driver’s characteristics for the experiment.

M: male; F: female.
The experimental paths covered many kinds of roads and intersections. For example, the selected roads include Dacheng Street, Xuanqing Street, Huanghe Road, Nanzhi Road, Huaihe Road, Hongqi Street, Xianfeng Road, Songshan Road, Liaohe Road, Maduan Street, and Xuanhua Street. The total length of the tested roads is 9085 m, and the detailed information of each road is shown in Table 2.
Characteristics of testing road under traffic congestion.

The experimental procedure and content are designed as follows:
First, the experimental designers investigate all of the selected urban roads thoroughly, so as to confirm that all sorts of road conditions and traffic facilities are normal operation. And an emergency plan has been made to improve the experiment scheme.
Second, with spirit-10C multi-channel physiology recorder, the changes of different drivers’ heart rate are determined under various traffic flow states in urban road, and then the preliminary statistical analysis is adopted to find out the regularity for the collected data.
Third, the characteristics of the driver’s lane-changing behavior are determined under various traffic flow states in urban road via the camera and GPS navigator, which will be analyzed with the indexes of the driver’s heart rate synchronously.
Finally, after that each of the tested drivers finishing the testing process in the selected paths, the data and video files of the driver’s heart rate, lane-changing behavior, and vehicle running state are exported and stored.
In the testing process, the indexes of driver’s heart rate are relatively precise and significant, and the indexes of driving behavior characteristics are easy to observe for video, so driver’s heart rate and lane-changing are selected as the key factors to establish PSR model in this article.
Changing regularity of driver’s heart rate indexes
The samples of drivers’ heart rate under different traffic conditions are analyzed statistically, 19 which include unblocked state, mild congested state, moderate congested state, and severe congested state. The four types of traffic flow states are distinguished via data from GPS system, and driver’s anticipant speed and actual vehicle operation speed are the key factors to calculate grading thresholds for traffic conditions. The average values of heart rate from all sample points have been calculated with taking minute as the length of standard time. Furthermore, according to real-time traffic flow state of the experiment, the sample points are divided into four parts for analyzing respectively. In accordance with the four stages of traffic flow states (unblocked state, mild congestion, moderate congestion, and severe congestion), the influence of traffic congestion on the driver’s heart rate can be described respectively and specifically as follows:
The unblocked state. According to the distribution of sample points in Figure 1(a), traffic flow on the urban road run orderly in the unblocked state, and drivers can get high speed when vehicles run on the road. Moreover, drivers are satisfied with the operation of the traffic flow basically. And drivers could control the trajectory of the vehicle via acceleration, deceleration, and normal lane-changing. At the moment, drivers feel comfortable, their emotion is stable, and their heart rate fluctuates gently.
The mild congestion. According to the distribution of sample points in Figure 1(b), vehicles run less orderly in the mild congested traffic state than those in the unblocked state. The speed that the driver can get begins to decline when vehicles run on the road. In addition, drivers are less satisfied with the operation of the traffic flow. Higher speed can be obtained by means of acceleration, deceleration, and lane-changing. With low anxiety, drivers feel less comfortable, and their emotion is less stable. The fluctuation of heart rate begins to increase.
The moderate congestion. Judging by the distribution of sample points in Figure 1(c), traffic flow begins to disorder under the moderate congested state. The speed that drivers can get decreases more remarkably when vehicles run on the road. Furthermore, drivers are not satisfied with the operation of the traffic flow. Drivers obtain higher speed by risky lane-changing. With moderate anxiety, drivers feel depressed, and their mood is unstable. The fluctuation of heart rate increases further.
The severe congestion. Judging by the distribution of sample points in Figure 1(d), traffic flow is in the severe congested state. The speed that drivers can get drops sharply when vehicles run on the road. Moreover, drivers are very dissatisfied with the operation of the traffic flow. And there is scarcely extra space for drivers to get higher speed by changing lane. With severe anxiety, drivers feel bad and sad, and their mood is very unstable. The fluctuation of heart rate becomes discrete, and the number of heartbeats also increases gradually.
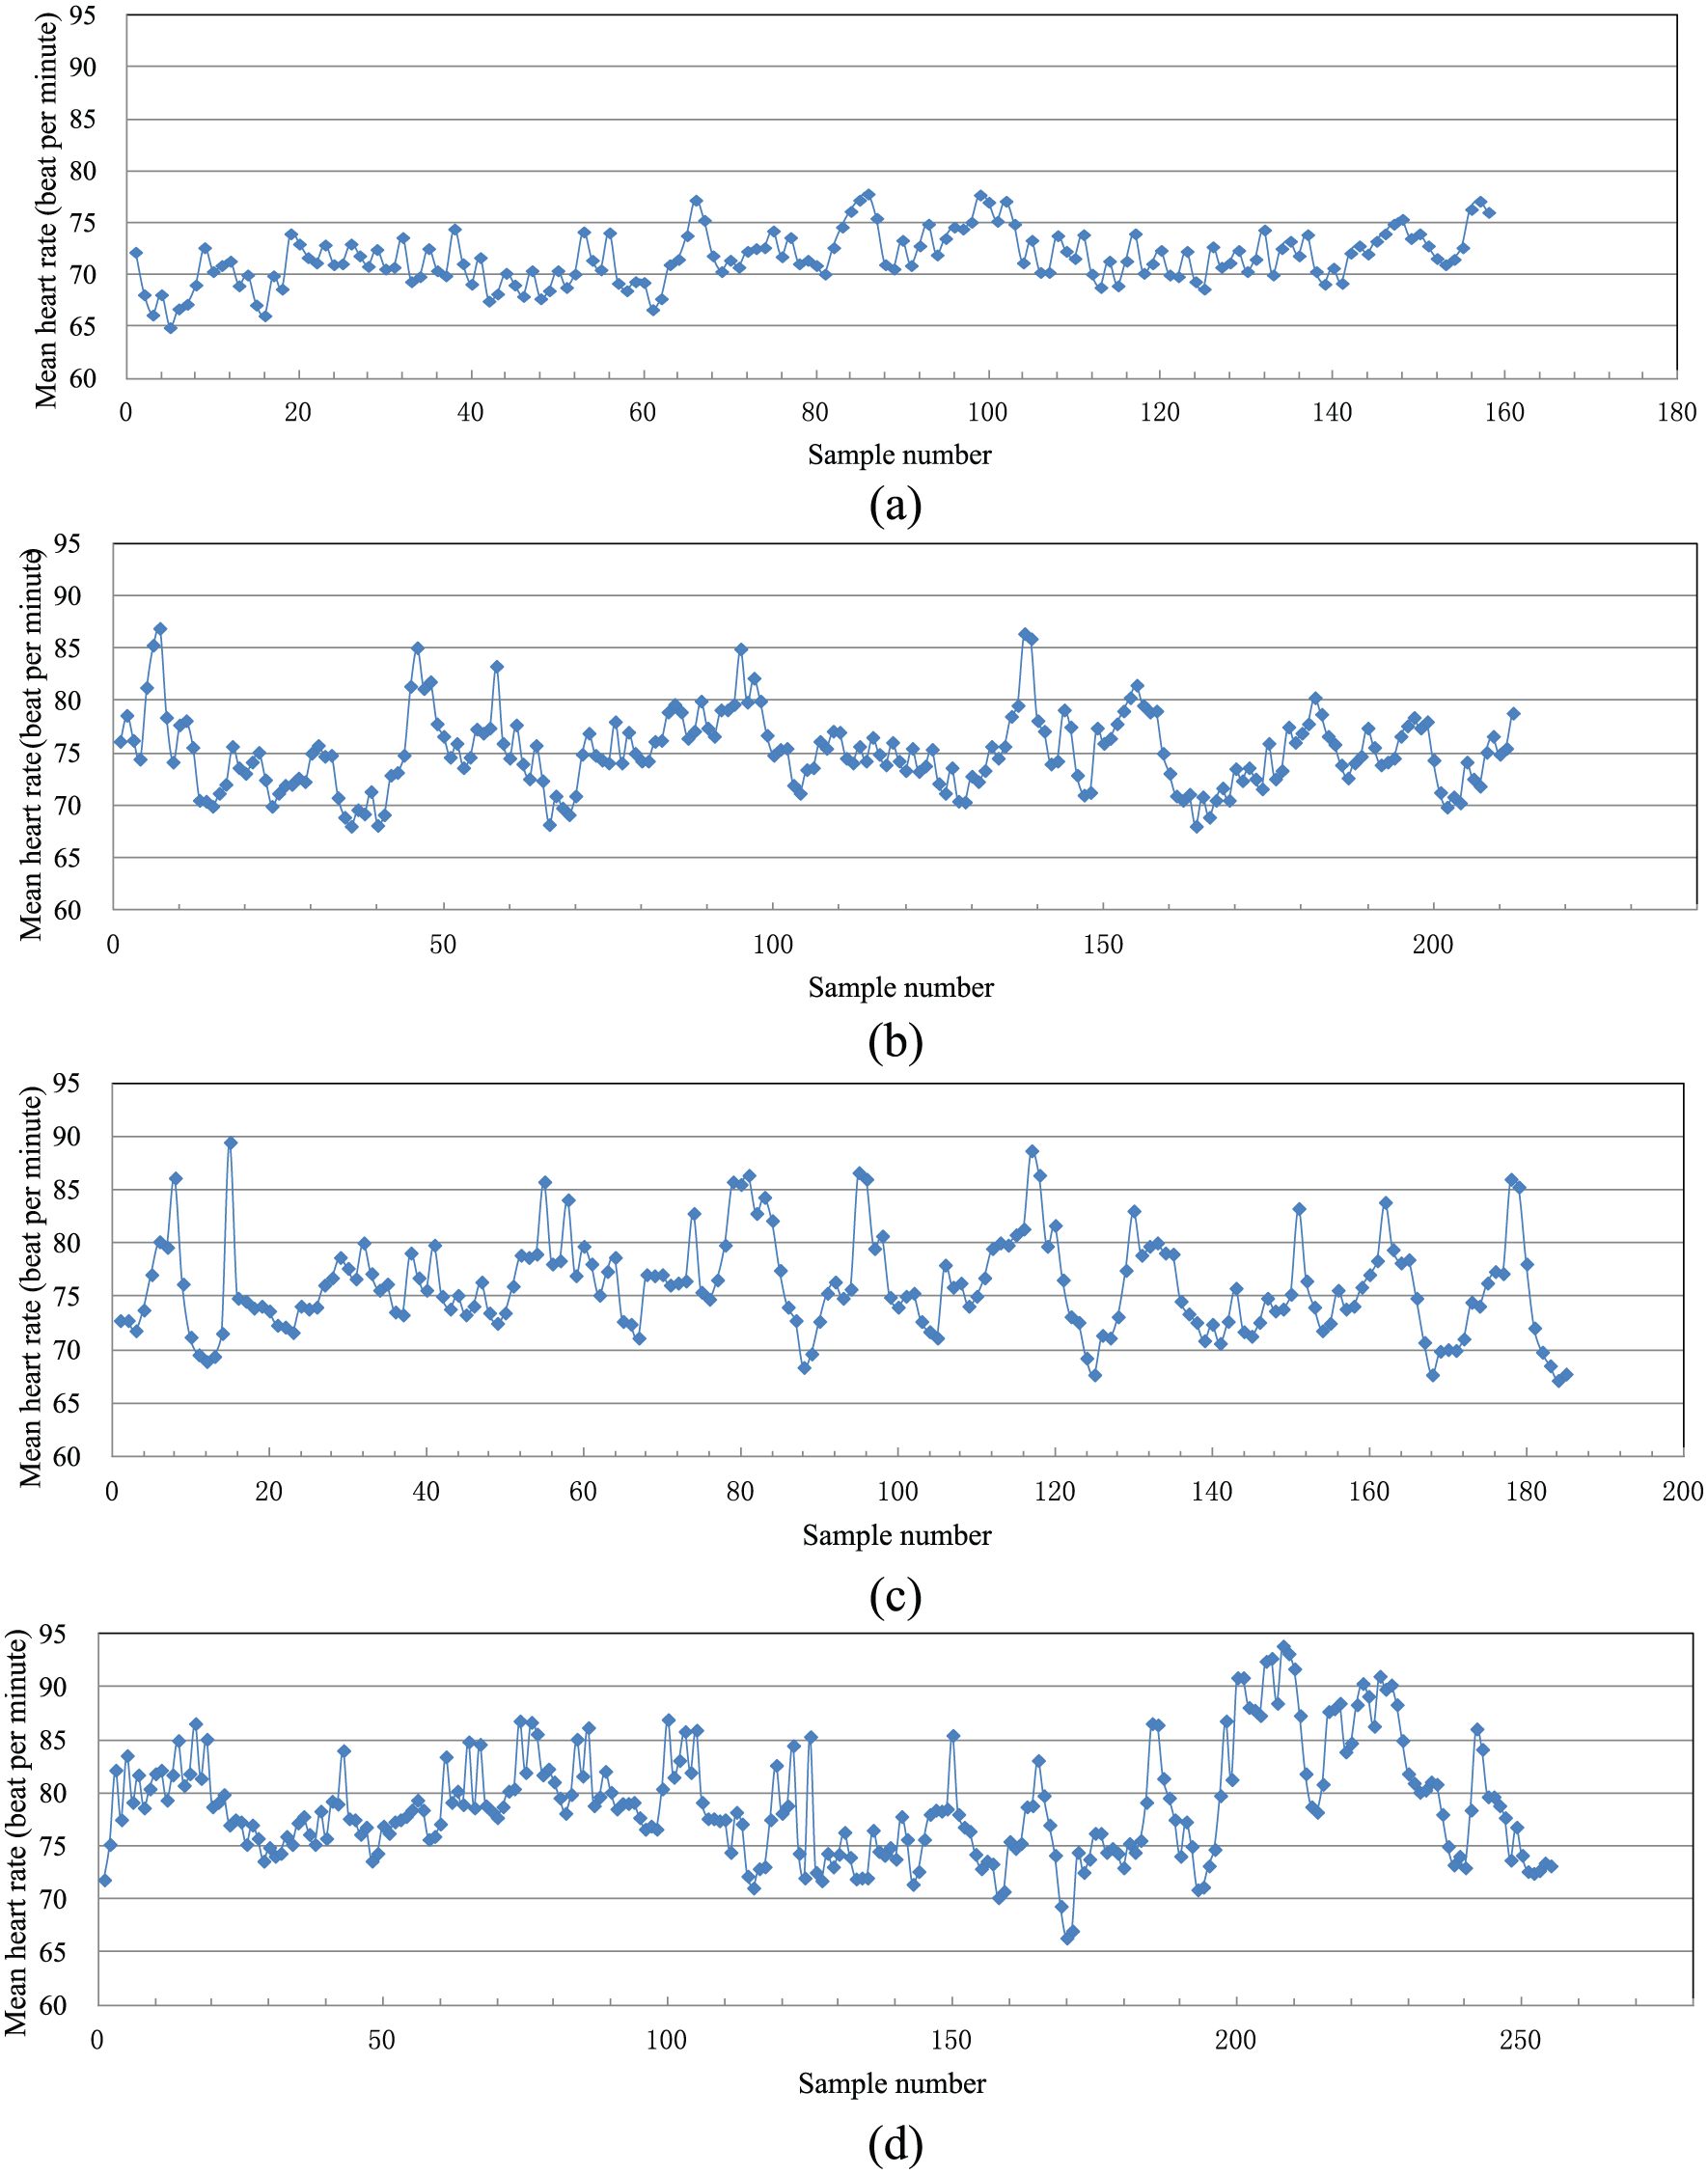
Driver’s heart rate statistic characteristics under different traffic flow states: (a) in unblocked state, (b) in mild congested state, (c) in moderate congested sate, and (d) in severe congested state.
PSR model of driver’s lane-changing behavior
PSR model of lane-changing directly
Depending on the different degree of traffic conflicts, driver’s lane-changing behavior can be divided into three types under the traffic congestion, which include lane-changing directly, lane-changing pressingly, and lane-changing selectively. Driver’s lane-changing behavior data and driving environment data are recorded into videos by SONY cameras. In all, 50% of the samples’ data (40 drivers) are used to construct the PSR model, and the other 50% of the samples’ data are used to verify the accuracy of the PSR model.
This section focuses on the PSR model of lane-changing directly. In order to build a relational model of the pressure coefficient,
18
the average value of heart rate and the proportion of lane-changing directly have been selected as the key indexes, and the original data that obtained from the testing need to be standardized. The standard data are shown in Table 3, and the data are collected from all experimental paths for 40 drivers under different traffic congestion conditions. Besides, the average value of heart rate and average proportion of lane-changing is related to each pressure coefficient value. Among them, the proportion of lane-changing directly is called
Data of driver’s heart rate and lane-changing in traffic congestion (lane-changing directly).

On the basis of passing the input and output data through a standardized process, the training program of the PSR model is designed via backpropagation (BP) neural network. Topology structure of the BP neural network is shown in Figure 2. Then, the sample sets of the measured data from experiment are imported into the BP neural network for training, the weight and threshold of the PSR model about the lane-changing directly in the congested state are shown in equations (1) and (2), respectively. 20

Topology structure of the BP neural network.
At the same time, the state parameters of the model are obtained when training is over, which are shown in Figure 3, and the relevance level for regression parameters about the model is shown in Figure 4. Furthermore, the error performance curve of the model training is shown in Figure 5. According to the error performance curve, it is clear that the value of expected error is 0.0001, which has been obtained when the training comes to end, so the precision of the model meets the requirement.
Weight

Threshold


State parameters of driver’s PSR model on training end (lane-changing directly).

Relevance level of PSR parameter between target and output (lane-changing directly).

Error performance curve of driver’s PSR model (lane-changing directly).
PSR model of lane-changing pressingly
This section focuses on the PSR model of lane-changing pressingly. The data after standardization are shown in Table 4. Among them, the proportion of the lane-changing pressingly is called
Weight

Threshold

Data of driver’s heart rate and lane-changing in traffic congestion (lane-changing pressingly).


State parameters of driver’s PSR model on training end (lane-changing pressingly).

Relevance level of PSR parameter between target and output (lane-changing pressingly).

Error performance curve of driver’s PSR model (lane-changing pressingly).
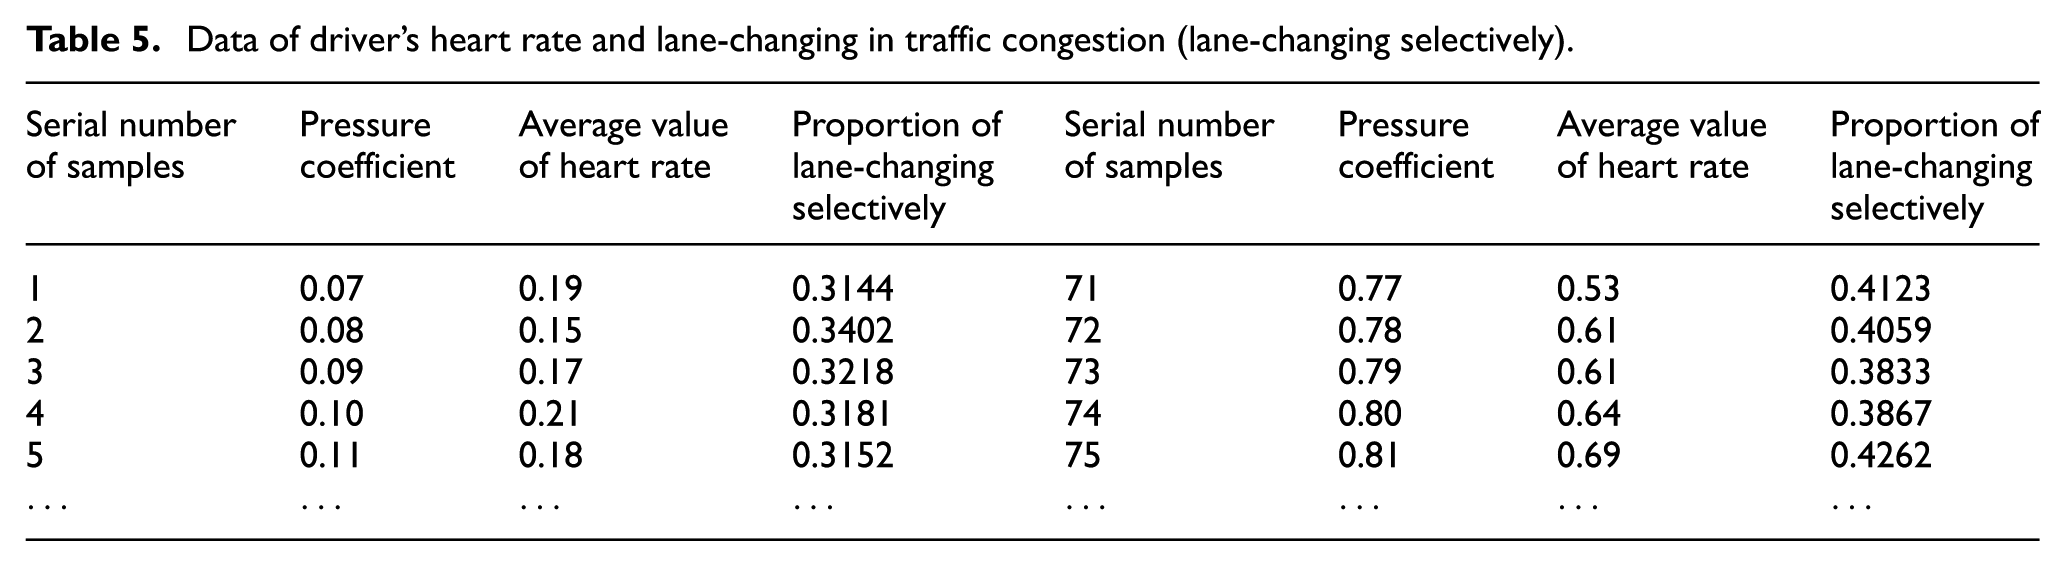
PSR model of lane-changing selectively
This section focuses on the PSR model of the lane-changing selectively. In order to build a relation model of the pressure coefficient, the data after standardization are shown in Table 5. The proportion of the lane-changing selectively, which is called
Data of driver’s heart rate and lane-changing in traffic congestion (lane-changing selectively).
Meanwhile, the state parameters of the model are obtained when the training is over, as shown in Figure 9. And the relevance level for regression parameters about the model is shown in Figure 10. Furthermore, the error performance curve of the model is shown in Figure 11. According to the error performance curve, the expected error (0.0001), which has been set up, is obtained when the training comes to end, so the precision of the model meets the requirement.
Weight

Threshold


State parameters of driver’s PSR model on training end (lane-changing selectively).

Relevance level of PSR parameter between target and output (lane-changing selectively).

Error performance curve of driver’s PSR model (lane-changing selectively).
Based on the PSR model building process of the lane-changing behaviors, it can be summed up that the PSR model based on the BP neural network follows the process of “experimental testing–data standardization–program designing–data training–error analyzing–precision checking,” and all stages of the process require to be strict and cautious. Among them, the experimental testing and program designing are the most important because the accuracy of the input and output variables is up to the two stages. If deviation appears in the testing process, the meaning of building model will be lost. Furthermore, the speed of iteration convergence and the accuracy of the PSR model are determined by the program designing.
Validation of driver’s PSR model
Driver’s PSR model could predict the proportion of risky lane-changing behavior via the driver’s heart rate and traffic congested level, and the forecast accuracy is the precondition for the application of driver’s PSR model. So, an additional sample data from the 40 tested drivers are used to carry out the prediction accuracy and practicability of the PSR model under traffic congestion. The data for validation of driver’s PSR model are completely independent from the data for building the PSR model.
First, the input variables’ values of another sample data are imported into the driver’s PSR model. The analog data of the precondition are output. According to the serial number of samples, the measured data are compared with analog data correspondently to confirm the forecast accuracy. Then, in the different situation of traffic congestion and driver’s physiology, the contrast curve of testing results and simulating results about lane-changing directly have been shown in Figure 12(a), 20 lane-changing pressingly in Figure 12(b), and lane-changing selectively in Figure 12(c).
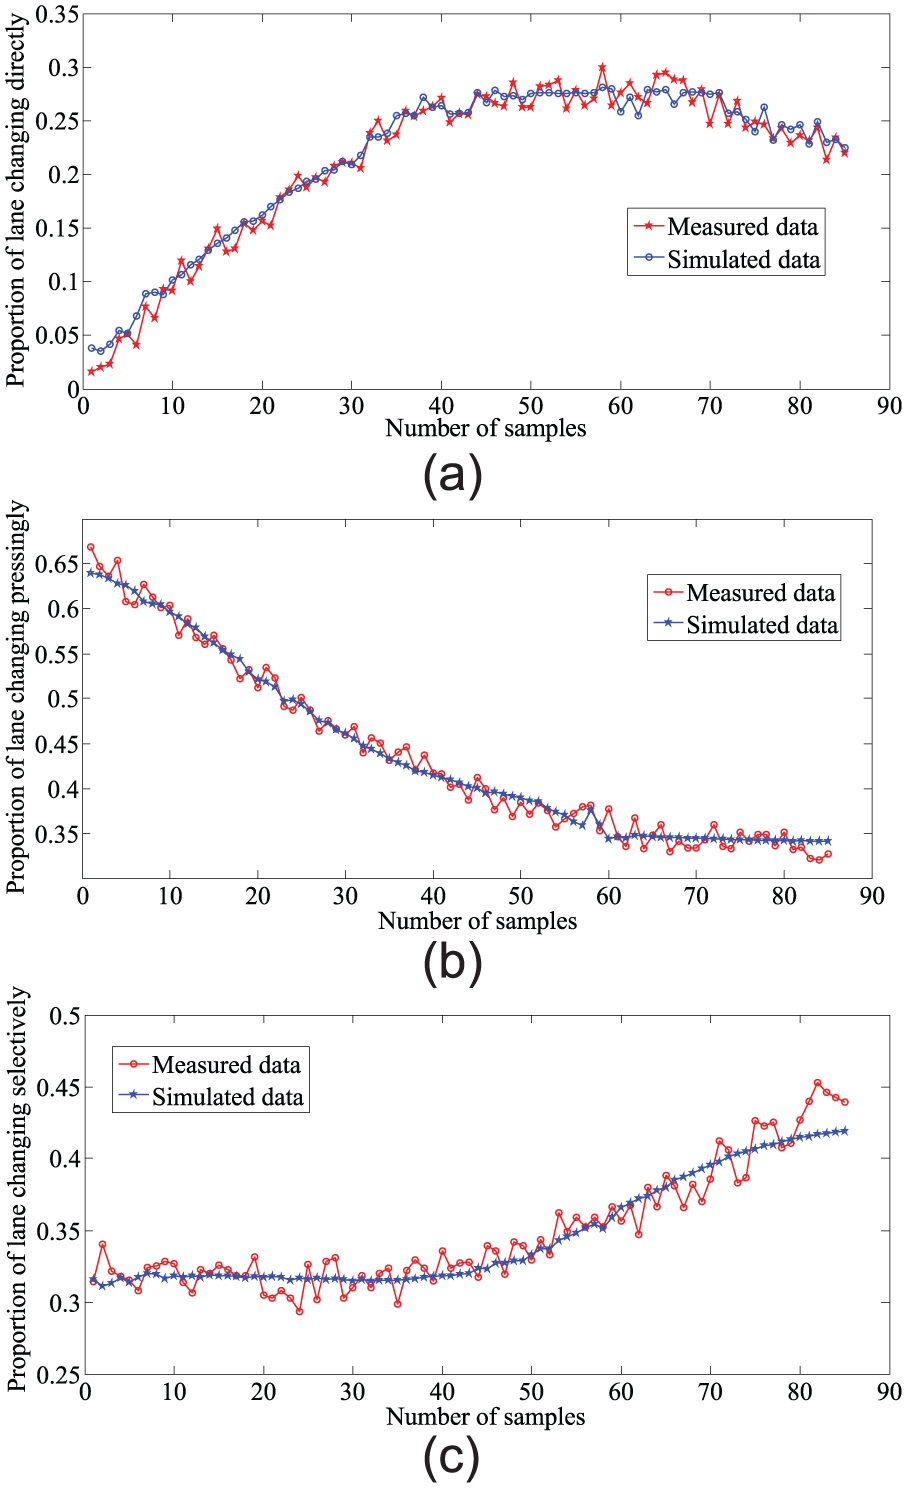
Testing results of driver’s PSR model in traffic congestion: (a) lane-changing directly, (b) lane-changing pressingly, and (c) lane-changing selectively.
In Figure 12(a), the measured data and analog data of lane-changing directly extend long with serial number of samples synchronously, and they intertwine with each other. The trend, fluctuation, ups, and downs of the measured data can be reflected by the analog data accurately. In Figure 12(b), the measured and analog data of lane-changing pressingly extend long with serial number of samples synchronously, and the simulated curve runs through the curve of measured data. The smooth and slipping trend of the measured data can be reflected by the analog data accurately. In Figure 12(c), the measured and analog data of lane-changing selectively extend long with serial number of samples synchronously, and the simulated curve runs through the measured curve. The earlier steady and later rise trend of the measured data can be reflected by the analog data accurately.
The validation results of the driver’s PSR model under traffic congestion show that the models based on the BP neural network can simulate the quantitative relationship well, which should consist of pressure coefficient, heart rate, and risky lane-changing in the congested state. In addition, it is able to accurately reveal the changing law for the driver’s lane-changing characteristics under the influence of traffic congestion pressure. In summary, the feasibility and practicability of the PSR models have been demonstrated.
In the three types of lane-changing directly, pressingly, and selectively, lane-changing pressingly and lane-changing selectively have less influence on traffic safety, but the lane-changing directly leads to serious traffic conflicts, which may cause traffic accidents. Therefore, the PSR model can be used to predict the proportion of lane-changing directly in the three types of lane-changing behaviors, and the right threshold proportion of lane-changing directly is set to warn drivers to care about the pressure from congestion.
Conclusion
By analyzing the driver’s characteristics comparatively in the four-type states (especially in the congested state) of traffic flow on urban road, the study on the driver’s heart rate and lane-changing indexes based on the measured data has been carried on, and the main conclusions can be summarized as follows:
On the basis of the selection for tested drivers and testing paths, the testing scheme and operational process of the driver’s heart rate and lane-changing indexes are discussed in detail under traffic congestion, which provides data support for the variation analysis and model construction on driver’s mental pressure under the traffic congestion.
By analyzing average value statistically of the driver’s heart rate in the unblocked, mild congested, moderate congested, and severe congested states, it is found that the average value of the driver’s heart rate is influenced by road traffic congestion obviously. Furthermore, with the space and time of traffic congestion increasing, the average value of heart rate rises gradually, and its discreteness enhances as well. That is to say, the driver’s emotion is unstable under the severe congested state.
Adopting the BP neural network to build the driver’s PSR model of the risky lane-changing behavior under traffic congestion, the PSR model reveals the quantitative relationship of the driver’s heart rate indexes and lane-changing behavior under the urban traffic congestion, and it provides theoretical support for predicting risky lane-changing behavior. Thus, it can be adapted to the warning of risky lane-changing.
Footnotes
Academic Editor: Yongjun Shen
Declaration of conflicting interests
The author(s) declared no potential conflicts of interest with respect to the research, authorship, and/or publication of this article.
Funding
The author(s) disclosed receipt of the following financial support for the research, authorship, and/or publication of this article: This study was supported by the Natural Science Foundation of Guangdong Province (2016A030310427), the Fundamental Research Funds for the Central Universities (2015ZM025), Research Institute Funds of Hefei Normal University (2015JG13), and the Young Creative Talents Foundation in Universities of Guangdong Province.