
Abstract
Although road traffic congestion is an objective state of traffic flow, drivers have different feelings about road traffic congestion. First of all, in order to reveal the law that driver’s mental state changes along with congested degree of road traffic, the targeted questionnaire was designed to analyze the driver’s psychological feeling under different state of traffic flow. Then, from the perspectives of the driver’s subjective feeling, the new definition of road traffic congestion was put forward, so the pressure coefficient of traffic congestion, which is written as
Keywords
Introduction
The concept of traffic congestion is often understood, but less frequently defined. The definition given by the Highways Agency captures the wide understanding of congestion as the situation when the hourly traffic demand exceeds the maximum sustainable hourly throughput of the link. 1 Alternatively, Goodwin 2 defines congestion as “the impedance vehicles impose on each other, due to the speed-flow relationship, in conditions where the use of a transport system approaches its capacity.” So, in the case of safety, Mussone et al. 3 described that congestion can lead driving behavior whereby vehicles have reduced headways; drivers may lose attention to the driving task or (due to frustration) take risks in the task, increasing the accident rate.
The research about traffic congestion focused largely on traffic congestion prediction, congestion charging, and geographical information systems. Yang 4 thinks traffic congestion prediction plays an important role in route guidance and traffic management; congestion charging is currently being considered an important public policy. Grisolía et al. 5 analyzed which factors should be considered to increase acceptability, and think the public acceptability is very important. The global positioning system (GPS) and geographical information systems provide a rich source of information for studies of travel times and delays, congestion levels, and energy and emissions. 6 So research about the stress from road congestion is relatively rare.
Road safety is a research hot part of the transportation system.7,8 Driver’s feeling is an important factor to analyze the level of stress, which will vary based on different driving conditions (such as different congested state), and excess stress can influence driving performance and increase in crash risks.9,10 Different driving tasks and roadway conditions may influence the stress perceived by drivers.11,12 So how can the traffic congestion inflect on driver’s emotion and behavior? It is a viable way to build a new grade division standard for road traffic congestion based on the driver’s feeling. 13
In the aspect of the impact of traffic congestion on the drivers’ characteristics, the research about assessment of the drivers’ mental and physical stress is usually based on the drivers’ emotional or mood states.14,15 Katsis et al. 16 designed a wearable test system that was used to collect the drivers’ physiological signals during the simulated driving process, and has analyzed drivers’ emotional status. So it is worthy to study the effect of different traffic congestion on the drivers’ characteristics.17,18 But the influence of traffic congestion on the driver’s bad mood cannot be reflected by the existing definition on traffic congestion well.
The principal contribution of this article is to illustrate how drivers care about traffic congestion, and how traffic congestion impacts on drivers’ mood and behavior. First, a new grade division for road traffic congestion based on driver’s feeling is established. Then, heart rate variability (HRV) of drivers is analyzed comparatively under different congested states. The results can be applied in the study of the influence of traffic congestion on driver’s physiological and psychological characteristics.
Driver’s psychological states under different traffic environment
Although traffic congestion is an objective state of traffic flow, each driver has independent expectation relatively for moving states of his/her own vehicle, and the expectation changes with trip purposes, trip time, and trip paths. Because different drivers have different expectations on vehicles’ movement, there is difference in the influence of traffic congestion on the driver’s physiology and behavior inevitably, which is described by objective parameters. In order to reveal the difference, we must put forward the definition of traffic congestion from the view for driver’s subjective feeling, and the subjective feeling toward traffic congestion is associated with the objective parameters of traffic flow via statistical method. On one hand, this way that combines the subjectivity with objectivity can reflect the driver’s actual feeling; on the other hand, the influence of traffic congestion pressure on the driver’s physiology and lane changing characteristics can be studied theoretically.
Urban road resources are consumed excessively by traffic participants for personal interests, whose behaviors lead to traffic congestion, and traffic congestion also has influence on the changes of the driver’s psychological states. To quantify the influence of urban road traffic congestion on the driver’s psychological states, the study team designs an investigation form for the driver’s psychology and traffic environment. From the perspectives of qualitative analysis, the driver’s psychological states are determined by the form. Furthermore, the driver’s psychological states have been divided into five levels via inquiring the experienced drivers. The five levels, which are good state, relaxed state, general state, agitated state, and angry state, are identified by drivers’ feeling. So the driver’s psychology data can be obtained by inquiring drivers and recording synchronously. And the driver’s behavior data and traffic environment data are recorded into videos by SONY cameras. In the process of data analysis, the method that combines artificial recording with pattern recognition is adopted to analyze the driver’s psychological characteristics and driving behavior thoroughly in different traffic environment. For the better correspondence and unification between the driver’s psychology and traffic environment, the driver’s psychology and traffic environment are recorded in the same form, as shown in Table 1.
Record of the driver’s psychology and traffic environment.
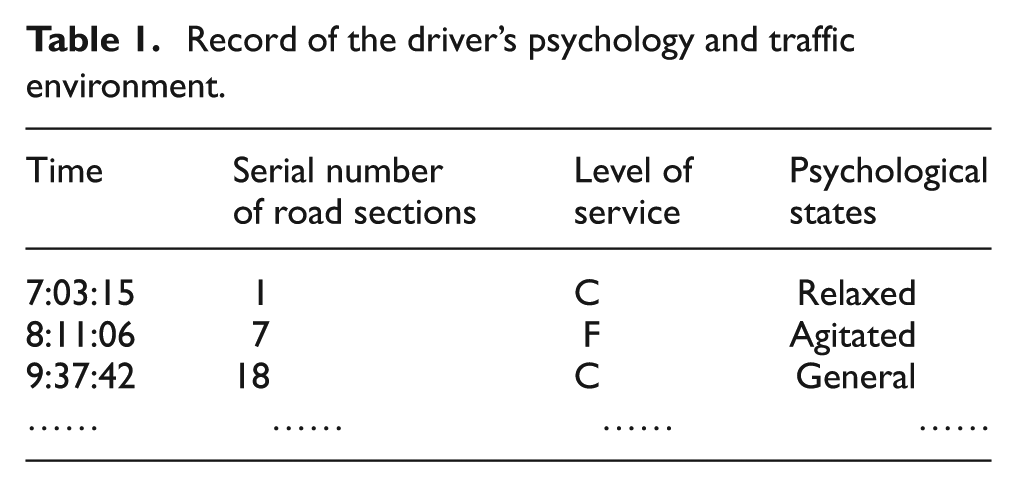
In the process of driving on the urban road, vehicle flow changes as impulse type under the influence of traffic management and control. If vehicle flow encounters an intersection, then most vehicles will get together to wait in line after stop signs of the intersection. Due to real-time changes of road traffic flow in the process of driving, it is difficult to calculate the link traffic volume accurately at each moment. Therefore, only the way of time recording and qualitative discrimination can be adopted. The index, which is most commonly used to judge traffic congestion degree, is level of service. There are mainly two types of standards for qualitative evaluation on level of service. One is the five-level hierarchy of China, and the other is the six-level hierarchy of the United States. 19 Furthermore, the two methods have the same essence. In order to classify traffic congestion degree more accurately, this article adopts six-level hierarchy of the United States (such as “level of service” in Table 1). So the grading standard for the service level is shown in Figure 1.

Evaluation on level of service for road traffic.
Combining inquiry results of the driver’s psychological feeling in Table 1 with the grading standard of level service in Figure 1, on the basis of arrangement and analysis of survey data on the driver’s psychology and traffic environment, changing trends of the driver’s psychological states are obtained under different levels of service, which are shown in Figure 2.

Changing trends of the driver’s psychological states under different levels of service.
According to Figure 2, it is known that the service level of urban road varies from A to F. Moreover, five levels of the driver’s psychological states, which are good state, relaxed state, general state, agitated state, and angry state, present the following changing law:
With levels of service of urban road varying from A to F, the proportions of good state, relaxed state, and general state have reduced gradually.
With levels of service of urban road changing from A to F, the proportions of agitated state and angry state rise step by step.
It illustrates that the changing levels of service on urban road have a significant impact on the driver’s psychological states. Furthermore, with traffic congestion degree on urban road rising up, the frequency of drivers’ anger and anxiety increases significantly. Due to obvious changes in the driver’s psychological states under traffic congestion, in the process of grade division for traffic congestion, both the driver’s subjective feeling parameters and objective descriptive parameters of traffic flow states had better be taken into consideration. And detailed ideas are shown in Figure 3.
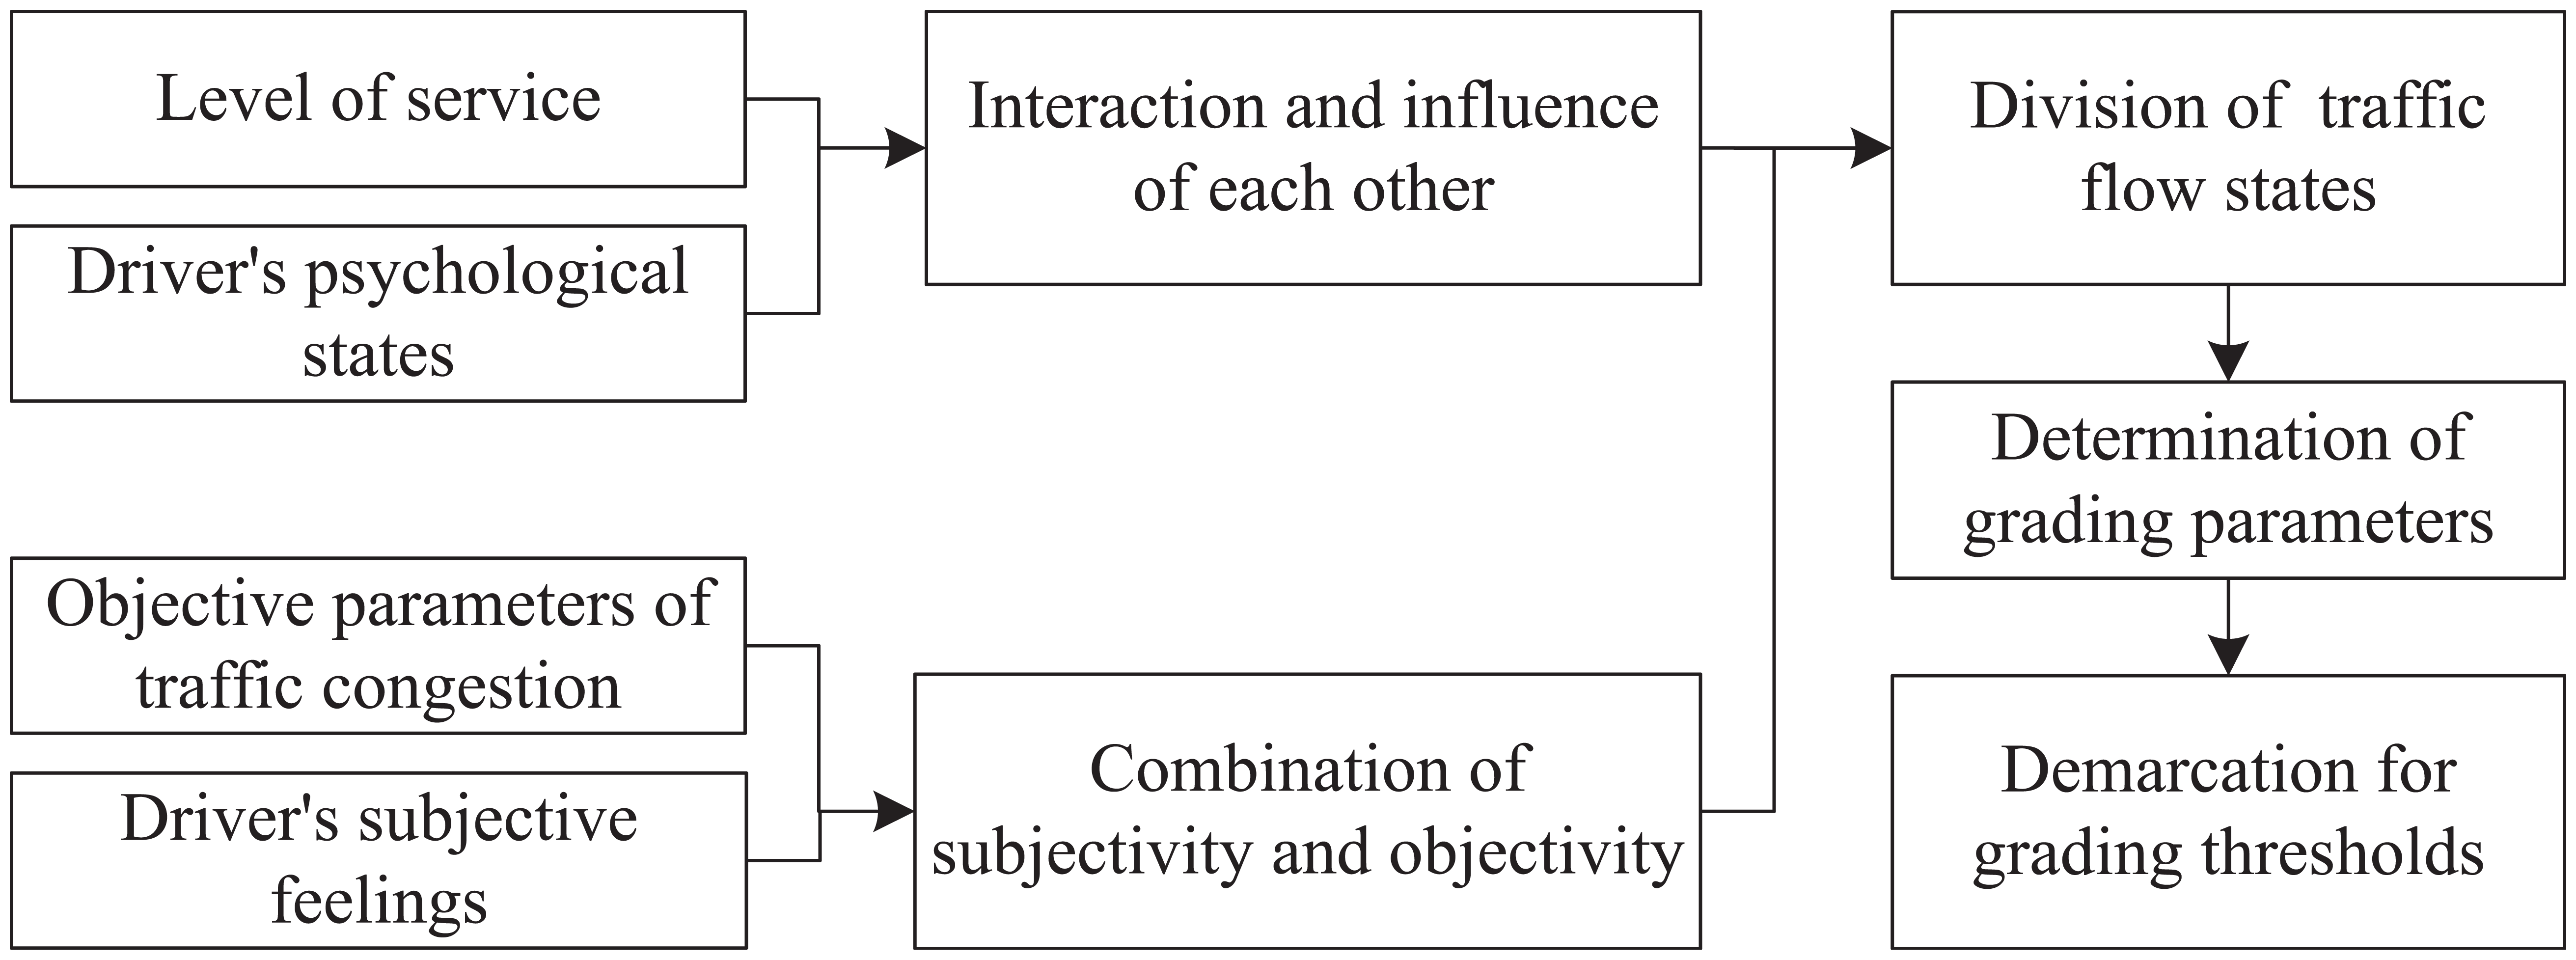
New ideas for the state division of traffic congestion.
In conclusion, the definition of urban traffic congestion based on the driver’s feeling is given as follows: urban traffic congestion is a state of the traffic flow corresponding to the smooth traffic state. It is the driver’s integrated feeling toward the vehicle speed and running time according to their own cognition and values. In order to facilitate the study on traffic congestion degrees, traffic congestion is divided into mild congestion, moderate congestion, and severe congestion.
Grade division for traffic congestion considering driver’s feeling
By questionnaires, it is determined that road traffic congestion had an impact on the driver’s psychological state. Furthermore, put forward the new definition for traffic congestion from the perspectives of the driver’s feeling. Based on the research conclusion above, grading process for road traffic congestion is developed, as shown in Figure 4.

Grading process for urban traffic congestion.
According to the new idea of grade division for traffic congestion states (in Figures 3 and 4), associating the driver’s subjective feeling with the objective states of traffic flow, an objective parameter should be defined to describe the degree of urban road traffic congestion, which is capable of embodying the driver’s subjective feeling. In terms of drivers, the influence of traffic congestion mainly reflects in their comprehensive feeling for vehicle speed and running time. In case that travel distance is determined, the vehicle speed is inversely proportional to running time. Therefore, only one of the two variables above can be chosen. Because the speed variable is more intuitive for drivers, and the time variable requires converting frequently, the speed variable is chosen to ascertain description parameters of the states of urban traffic congestion combining with the driver’s feeling.
Thus, the variable which is called pressure coefficient of traffic congestion is defined to represent the driver’s pressure given by urban traffic congestion, and it can quantify the driver’s feeling on vehicle speed under traffic congestion. Furthermore, pressure coefficient of traffic congestion is a cumulative index, which represents what in a certain period under traffic congestion, cumulative effect of difference values between the driver’s anticipant speed and actual vehicle operation speed is divided by time cumulative effect of the driver’s anticipant speed. According to the definition, the pressure coefficient of traffic congestion can be expressed as follows 20

In equation (1),
On the basis of the definition, equation (1) of pressure coefficient in traffic congestion, the simplified one, can be represented as equation (2). For the sake of the accuracy for collected data and the actual application, the driver’s anticipant speed is replaced by the average speed of vehicles on the path S in the flat peak period. And the average speed of vehicles on the path S in the peak period takes the place of the actual operation speed. According to the definition, equation (2) of the driver’s pressure coefficient under traffic congestion can be replaced by equation (3)


In equation (2),
Parameter calibration for grading thresholds of traffic congestion state
The states of traffic flow are divided into smooth state, mild congestion, moderate congestion, and severe congestion. Referring to the empirical mode of calculation method for speed-limit threshold on expressway, we select the critical values of pressure coefficient, which correspond to the 15th, 50th, and 85th percentiles of cumulative probability distribution curve, as grading thresholds of the four states above.
According to equation (3), the value of pressure coefficient for traffic congestion varies in the interval [0.1], so the higher traffic congestion degree is, the more hardly the driver can accept. In order to demarcate the quantitative relationship between traffic congestion degrees and pressure coefficient from the perspectives of the driver’s feeling, the driver’s feeling values toward traffic congestion can be obtained in the inquiry manner.
First of all, we design a professional questionnaire, which reflects the driver’s feeling toward traffic congestion. The content of the inquiry consists of the driver’s running speed on the path S at off-peak and peak hours, and the driver’s feeling toward traffic congestion on the path S at peak hours. Time-lapse inquiry is adopted to obtain the driver’s real-time feeling toward traffic congestion: whether the driver can accept the vehicle speed or not, and the “yes” or “no” have been marked in accordance with the driver’s answer.
After the experiment, sort out inquiry data on the path S, which correspond to each inquiry moment, including running speed

Driver’s pressure coefficient evaluation results for traffic congestion.
In Figure 5, in view of the driver’s feeling toward traffic congestion, “1” is used to represent “yes,” and “2” is used to represent “no.” And the corresponding point of coordinate (0.48, 2) in the scatter diagram is the changing point of the driver’s feeling toward traffic congestion. It illustrates that if the value of pressure coefficient in traffic congestion
There are more than 30 drivers participating in the experiment. In accordance with the definition of the threshold above, the experimental data are analyzed to confirm which statistical distribution function it is by MATLAB tools. Then, the results of statistical analysis on thresholds of multiple drives’ pressure coefficient toward traffic congestion are shown in Figure 6. Figure 6 demonstrates that multiple groups of statistical data obey normal distribution. For regression result of probability density function and cumulative probability distribution function, respectively shown in equations (4) and (5), the grading thresholds of the four states of traffic flow have been calculated as follows:
The value of pressure coefficient
The value of pressure coefficient
The value of pressure coefficient

Statistical analysis results of the driver’s pressure coefficient thresholds: (a) probability density function and (b) cumulative probability distribution function.
In conclusion, if
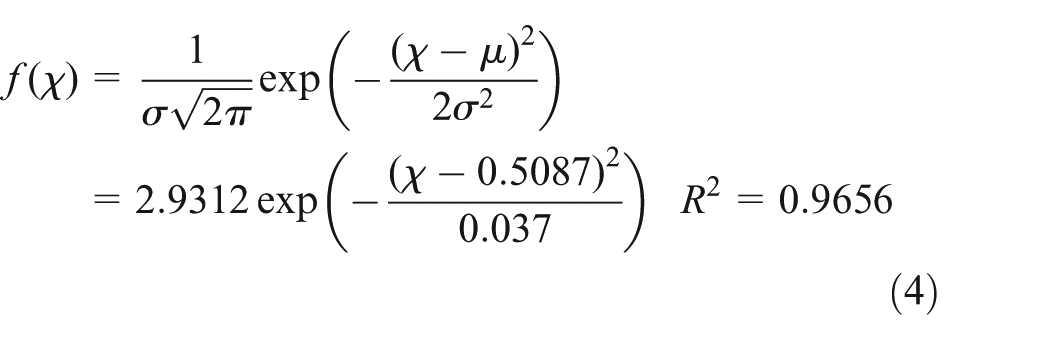
In equation (4), f(χ) represents probability density function of the driver’s cognition toward traffic congestion degrees. And χ is the driver’s pressure coefficient

In equation (5), F(χ) represents the cumulative probability distribution function of the driver’s cognition toward traffic congestion degrees. And the meaning of χ is as same as that in equation (4).
Application for traffic congestion grading considering driver’s feeling
In the above paragraph, referring to the empirical mode of calculation method for expressway speed-limit threshold, we select the values of pressure coefficient, which correspond to the 15th, 50th, and 85th percentiles of cumulative probability distribution curve, as grading thresholds of the four states. Furthermore, the thresholds about the four kinds of traffic flow state are
Specifically speaking, frequency domain analysis of the driver’s HRV is also called power spectral analysis method. By fast Fourier transform (FFT) or autoregressive (AR), it converts continuous R-R interval values in a certain period into heart rate power spectrum, which takes frequency as abscissa and takes power spectrum as ordinate. Furthermore, it provides basic information of the distribution for energy changing with frequency. Research result shows that people’s power spectrum of HRV is in the range of 0.0–0.5 Hz, and it can have three peak values of power spectrum. (Because of the influence of various environmental conditions and posture, peak values of power spectrum may change or disappear temporarily.)
Basic principle of Fourier integral
If f(t) is a function which is defined in the interval

Fourier Transform and Inverse Transform functions demonstrate as follows: If f(t) satisfies conditions of Fourier integral theorem, then the equation
Result application on grading for traffic congestion
On the basis of the testing experiment for the driver’s heart rate states under traffic congestion, and referring to the grading thresholds for traffic congestion based on the driver’s feeling, Fourier Transform theory is adopted to calculate the domain frequency indexes of the driver’s HRV for the four states. The results are shown in Table 2 and Figure 7.
Domain frequency indexes of the driver’s heart rate variability under different congested states.


Domain indexes comparison of the driver’s heart rate variability under different congestion states.
According to the experiment results in Table 2 and Figure 7, with the degrees of traffic congestion rising up, low frequency power (LF) goes up, which illustrates that excitation of the driver’s sympathetic nerve strengthens. But high frequency power (HF) comes down, which illustrates that excitation of the driver’s vagus nerve descends. Furthermore, the ratio of LF/HF goes up, it is demonstrated that balance of the driver’s heart rate adjustment inclines to the sympathetic nerve. So the analysis results indicate that the influence of traffic congestion on the driver’s physiological and psychological states is reflected well by the grading standard for traffic congestion based on the driver’s feeling.
Conclusion
With the development of our society and the improvement of traffic system, traffic participants’ physical and mental health has been focused by academic circles. 22 The article takes the driver’s actual feeling under traffic congestion as a study object, and our team carries on experimental tests and model building for the driver’s feeling on traffic congestion. Mainly, the following results are obtained:
By questionnaire, we associate traffic flow states with driver’s subjective feeling. And the changing law of the driver’s psychological states has been studied, which illustrates that traffic congestion has a significant impact on the driver’s feeling.
Road traffic congestion is defined newly from the perspectives of the driver’s subjective feeling. Furthermore, pressure coefficient of traffic congestion is adopted to represent the pressure of traffic congestion on drivers. In addition, the mathematical statistics method is used to demarcate grading thresholds of the four traffic states.
On the basis of grading method for traffic congestion based on the driver’s feeling, Fourier integral theorem is adopted to calculate the domain frequency indexes of the driver’s HRV for the four states. The results illustrate that the changing trend of the domain frequency indexes of the driver’s HRV relates to the new grading standard for traffic congestion closely, which verifies the feasibility and actual application value of the new grade division method.
Because the data for drivers’ feeling are mainly collected in the northern city of China, the research results need to be further validated via a full sample of data, especially about the southern city of China. And the potential future work is to test and collect data to establish a model with universal applicability for the impact on drivers from traffic congestion.
Footnotes
Academic Editor: Geert Wets
Declaration of conflicting interests
The author(s) declared no potential conflicts of interest with respect to the research, authorship, and/or publication of this article.
Funding
The author(s) disclosed receipt of the following financial support for the research, authorship, and/or publication of this article: The study is supported by China Postdoctoral Science Foundation funded project (2015M570716), the Fundamental Research Funds for the Central Universities (2015ZM025), and the National Natural Science Foundation of China (51378222).