
Abstract
Water tank is a commonly used unit which has been frequently applied for thermal energy storage units. In order to enhance the thermal performance of the water tank, the phase change material is utilized by embedding paraffin into water tank. But the key question is whether a competitive charging could be achieved. Therefore, an experimental system has been constructed. In this article, two key indices, the energy storage capacity and the energy storage intensity, are investigated. The performances of the phase change material–thermal energy storage tank during the heat charging processes are investigated experimentally, and a series of experiments are carried out under different heat transfer fluid flow rates and distance between phase change material plates. The temperature evolutions of the phase change material plates and heat transfer fluid are obtained during the experiments. The thermal performance of the phase change material–thermal energy storage tank was observed to be more effective than the conventional sensible thermal energy storage tank. It is found that water flow rate of 1.3 m3/h is taken as the optimal working condition, and the 3-cm plate distance is considered as the optimal design.
Keywords
Introduction
The continuous increase in the greenhouse gas emissions and the depletion in the fossil fuels at an alarming rate are the main driving forces to more effectively utilize renewable energy. One of the options is to develop effective energy storage technologies, which are as important as developing new sources of energy. 1 Energy storage technology is a good way to solve this problem. A good designed energy storage technology would not only reduce the mismatch between the energy supply and demand but also improve the efficiency and reliability of the systems.2,3 Due to the particular characteristic of phase change material (PCM), the combination of PCM and energy storage technology is researched.
The combination of PCM and energy storage technology is currently one of the most intensive research topics. In terms of application of PCMs, SS Chandel and T Agarwal 4 summarized the study of PCM materials, energy storage, and environmental effects and analyzed the potential fields that former study did not cover. In terms of reinforced heat transfer of PCMs, Akhilesh et al., 5 using the method of numerical calculation, carried out simulation analysis of heat transfer reinforcement of paraffin by vertical metal fin, where result shows that heat transfer performance of the material can be significantly improved by adding vertical metal fin. By adding aluminum powder of size 80 μm into paraffin, Mettawee and Assassa 6 found after the experiment that melting time of paraffin was shortened by 60% and heat release rate was improved. Ismail et al. 7 analyzed the influence of embedded vertical fin on heat release character of cylindrical energy storage unit and found that influence of length quantity of fin on superheat degree of PCM is bigger than that of fin thickness during the heat release process of cylindrical energy storage unit. In terms of phase change unit, N Nallusamy et al. 8 encapsulated paraffin inside ball as PCM and water as heat transfer medium and studied the energy storage unit combining both, and pointed out the advantage of the planar PCM water tank. In terms of encapsulating form specified for different shapes, M Esen et al. 9 studied two kinds of cylindrical thermal storage water tanks by evaluating the influence of various PCMs, cylindrical radius, pipe radius, total PCM volume in the tank, mass flow rate, and inlet temperature of heat transfer fluid (HTF) on energy storage.
Previous study emphasized on the thermal performance of latent thermal energy storage (LTES) units, thermal properties of PCMs, and heat transfer enhancement between HTF and PCM. However, the investigation of latent heat storage (LHS) water tank is less well established, especially the experimental study. Therefore, this article aims to report the operating characteristics about LTES water tank with PCM.
Experimental setup
Some studies suggested that implementing PCMs inside the tank could increase the energy density of hot water tanks. To investigate the thermal storage characteristic and heat transfer performance of a phase change material–thermal energy storage (PCM-TES) tank, an experimental system has been constructed.
Materials
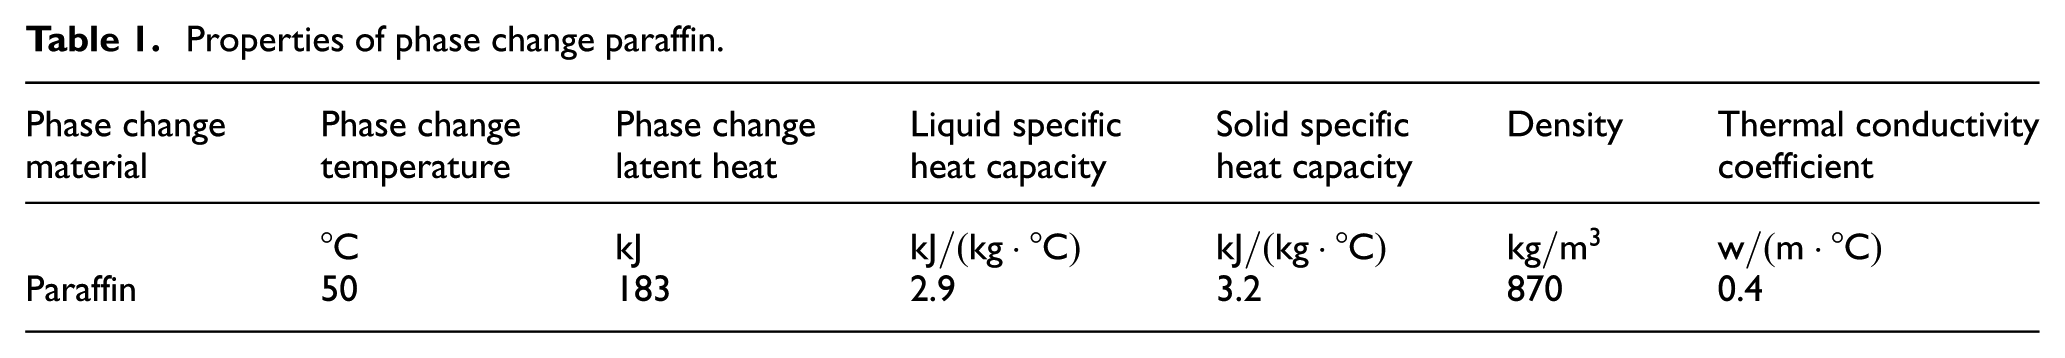
Paraffin is a commonly used PCM which has been frequently applied for TES units. Pure paraffin is appropriate for the LTES systems due to its appropriate thermo-physical properties. The properties of paraffin are listed in Table 1.
Properties of phase change paraffin.
Apparatus
The schematic diagram of the experimental setup is shown in Figure 1. The experimental setup can switch between the heat charging and discharging. In the heat charging process, the electric heater in the insulation tank is open. Hot HTF from insulation tank flows through the PCM-TES tank and exchanges heat with the PCM and then flows back to insulation tank. The flow rates and direction of the HTF are controlled by valves. Front view of the experimental setup is shown in Figure 2.

Schematic diagram of the experimental setup.
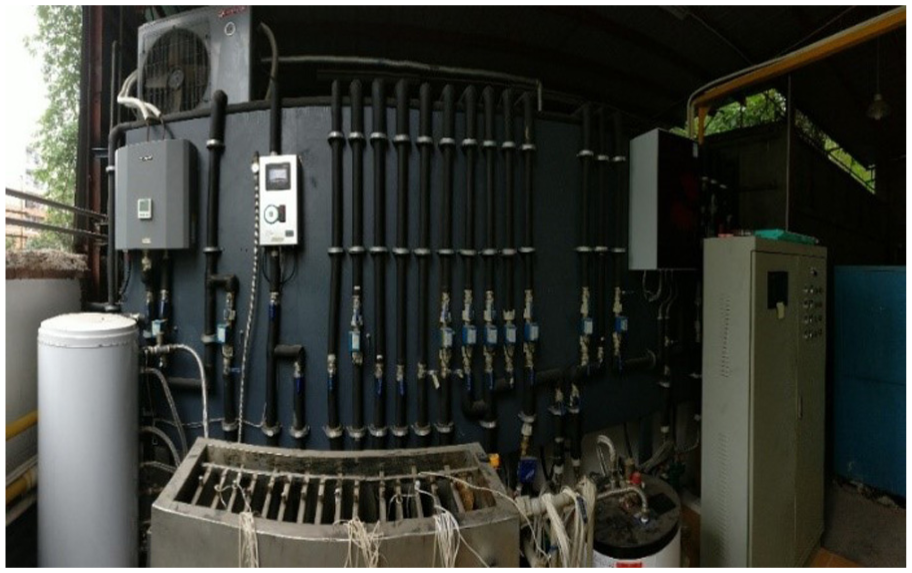
Front view of the experimental setup.
The PCM-TES tank is illustrated in Figure 3. The distance between PCM plates can be changed by changing the metal slots in the tank. The PCM plate is in rectangular shape and the outer shell made by steel. The PCM plate is filled with the paraffin.
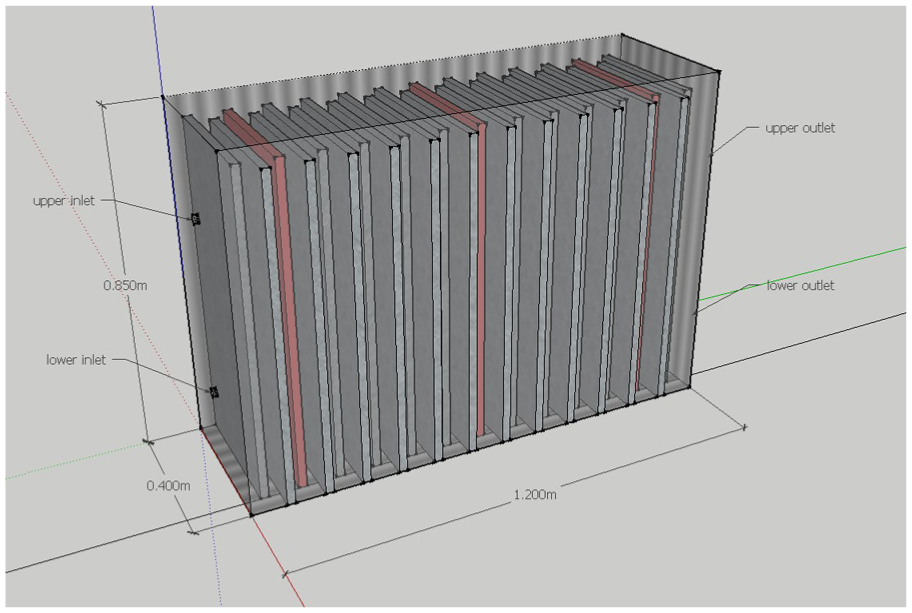
Schematic illustration of the PCM-TES tank.
Among all the PCM plates under different distances, three PCM plates are set as monitor PCM plates, which consist of 16 monitor points in each plate. The monitor PCM plate is illustrated in Figure 4. The three monitor PCM plates are approximately equidistantly arranged. The metal slots make the PCM plates in the PCM-TES tank to be aligned in a Z-shaped fluid channel. The temperatures of the monitoring points are recorded by the data acquisition system (Agilent 34970A) and then are stored in a computer for further analysis.

Schematic illustration of the monitor PCM plate.
Experimental procedure
The purpose of this study is to investigate the thermal performance of PCM-TES tank under different HTF flow rates and multiple distances between PCM plates.
In the heat charging process before the commencement of the experiments, the HTF at 20°C flows through the LTES unit for several minutes to make the composite PCM at a uniform initial temperature. During the heat charging process, the HTF from the hot water tank flows through the LTES unit and the temperature of the PCM increases. When the temperatures of three monitoring PCM plates are above the target temperature of 60°C, the heat charging process comes to an end.
The following experiments were carried out:
Charging process under different HTF flow rates: 1.0, 1.3, and 1.6 m3/h;
Charging process under different distances between PCM plates: sensible thermal energy storage (STES) tank, PCM-TES tank under 2, 3, and 5 cm;
STES tank under 1.3 m3/h.
Theoretical analysis
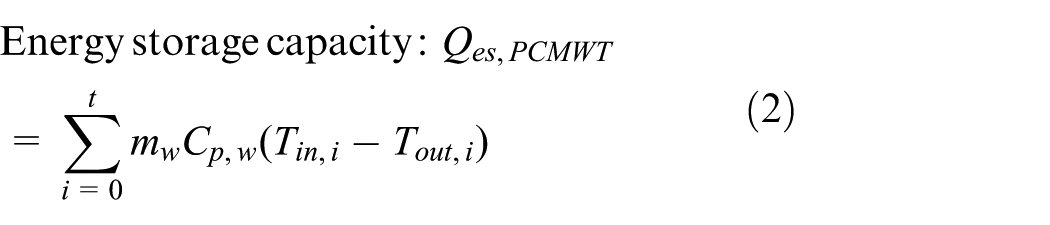
Energy storage capacity
1. Overall energy storage capacity of water tank with PCM
HTF enters the tank after being heated, releases the energy into the PCM-TES tank, and then flows out

There is a time interval for data collection, so change data from integral form to difference form when processing date
2. Energy storage capacity of water in PCM water tank

3. Energy storage capacity of PCM
Energy storage capacity of PCM cannot be obtained directly by temperature and flow monitoring, so indirect calculation method will have to be adopted; energy storage capacity of PCM is actually the difference between overall energy storage capacity of PCM water tank and water energy storage capacity of PCM water tank

Energy storage intensity
1. Overall energy storage intensity of PCM water tank
Energy storage intensity is related to the speed of storing energy. The concept of energy storage intensity is put forward as the energy storage capacity of PCM water tank per unit time

2. Energy storage intensity of PCM

Results and discussion
Comparative analysis of experimental results under different water flow rates
In this section, in order to analyze the effect of the water flow rates on the energy storage characteristics of the LTES tank with PCM (PCM-TES tank), the PCM plates’ distance of 2 cm is investigated when the water flow rates are 1.6, 1.3, and 1.0 m3/h, respectively. Meantime, the volume of the PCM plates accounts for 37.9% of the PCM-TES tank volume.
Analysis of the energy storage under the water flow rate of 1.0 m3/h
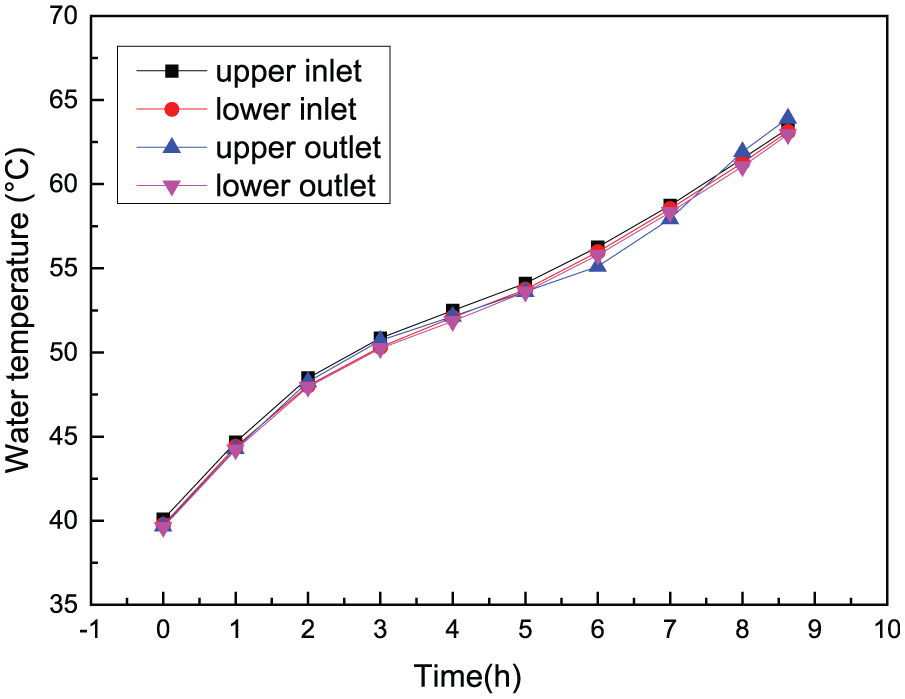
In this section, the water flow rate of 1.0 m3/h is considered to study the performance of PCM-TES tank during heat charging process. The temperature evolutions of the HTF in the heat charging process are shown in Figure 5. According to this figure, it is indicated that the HTF temperature at the upper monitoring point increases slightly quickly than that of lower positions at the initial stage of experiment and the phase transition stage, which can be attributed to the reason that the heat is as the latent heat absorbed by the PCM.
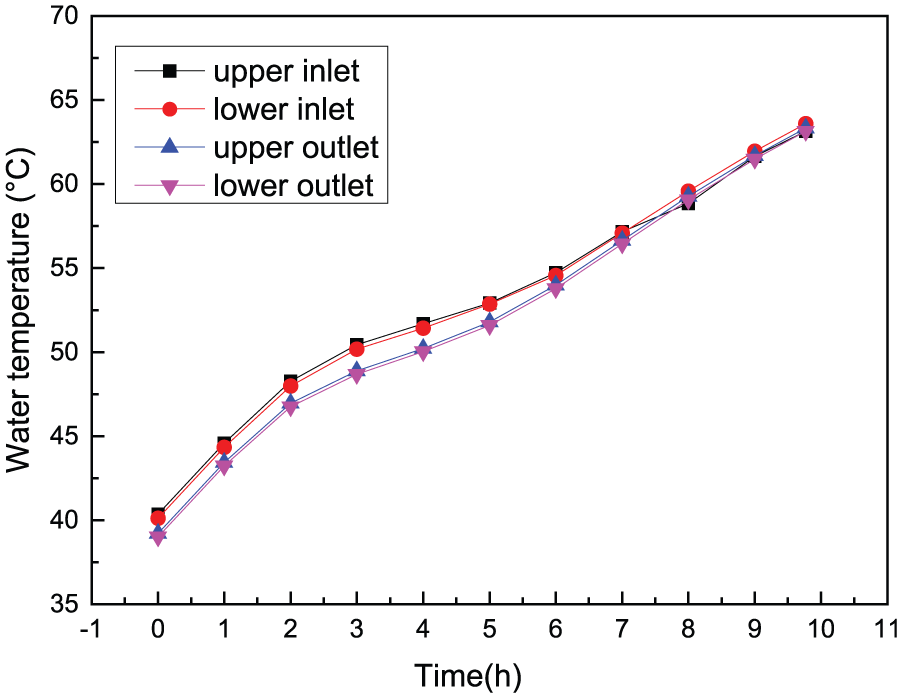
Temperature evolutions of the HTF between the inlet and outlet (water flow rate: 1.0 m3/h).
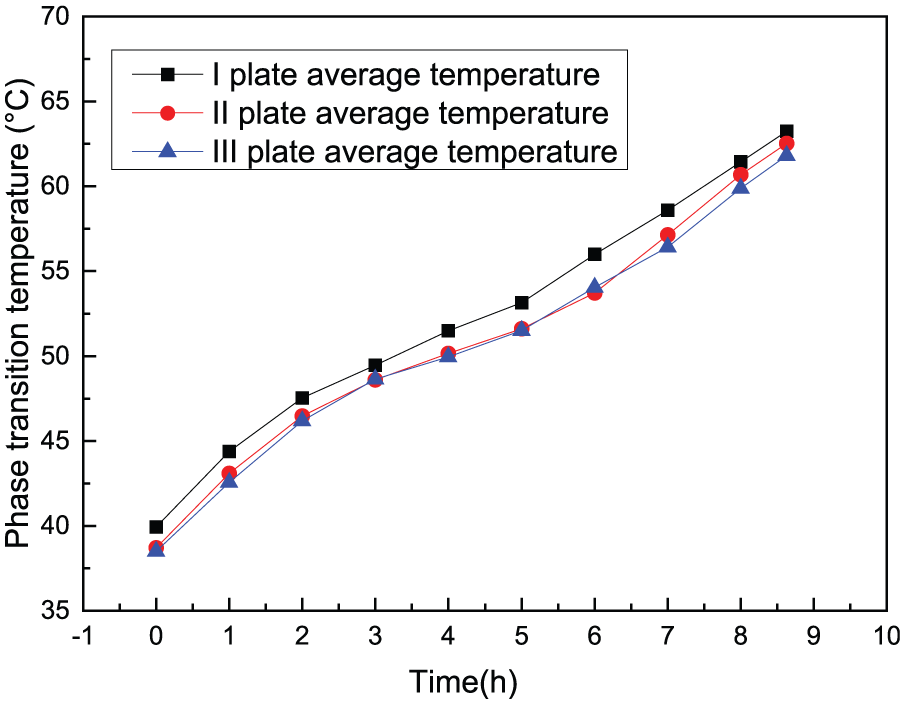
Figure 6 shows the temperature evolutions of the PCM plates in the heat charging process. As seen in Figures 5 and 6, the phase transition process begins at the 2.5th hour and finishes at the end of the 6th hour. In addition, it is observed from Figure 5 that at the same experimental time, the temperature of inlet plate I is higher than that of middle plate II and outlet plate III.

Temperature evolutions of the PCM plates (water flow rate: 1.0 m3/h).
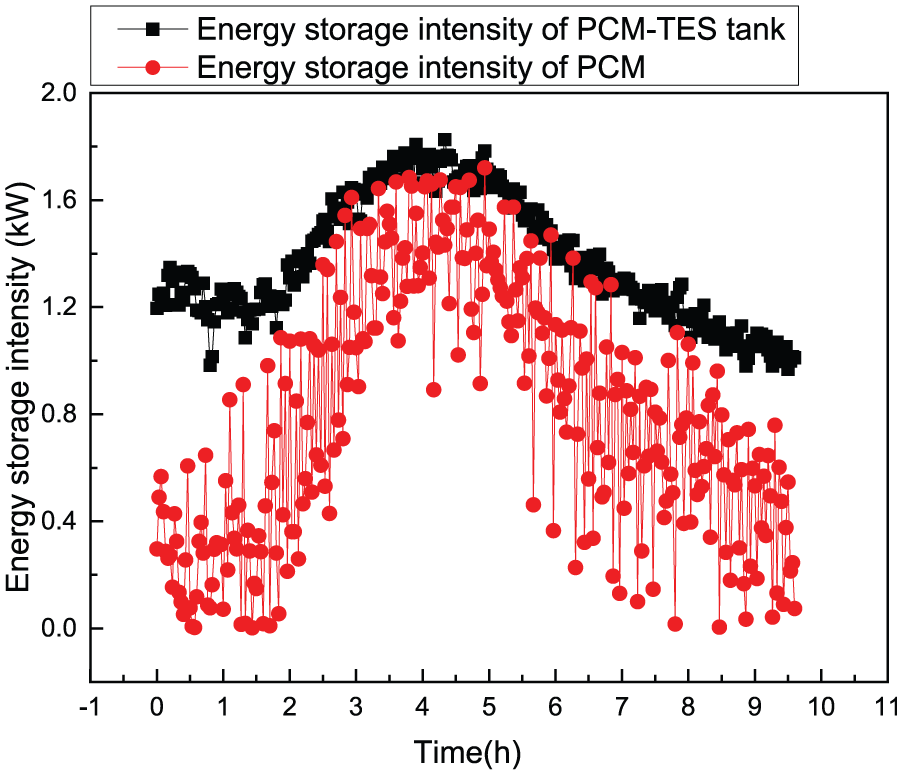
The energy storage intensity variation of PCM-TES tank and PCM during the heat charging process is shown in Figure 7. It can be seen that the maximum energy storage intensity of PCM-TES tank is 1.77 kW, which appears in the 4.1th hour. At the same time, the energy storage intensity of PCM is 1.48 kW.

Energy storage intensity variation during the heat charging process (water flow rate: 1.0 m3/h).
Figure 8 shows the variation of the accumulative energy storage capacity over time in PCM-TES tank, water, and PCM. The results indicate that the accumulative energy storage capacity of PCM-TES tank reaches to 47230 kJ, in which the proportion of the PCM energy storage capacity is 57.8%.
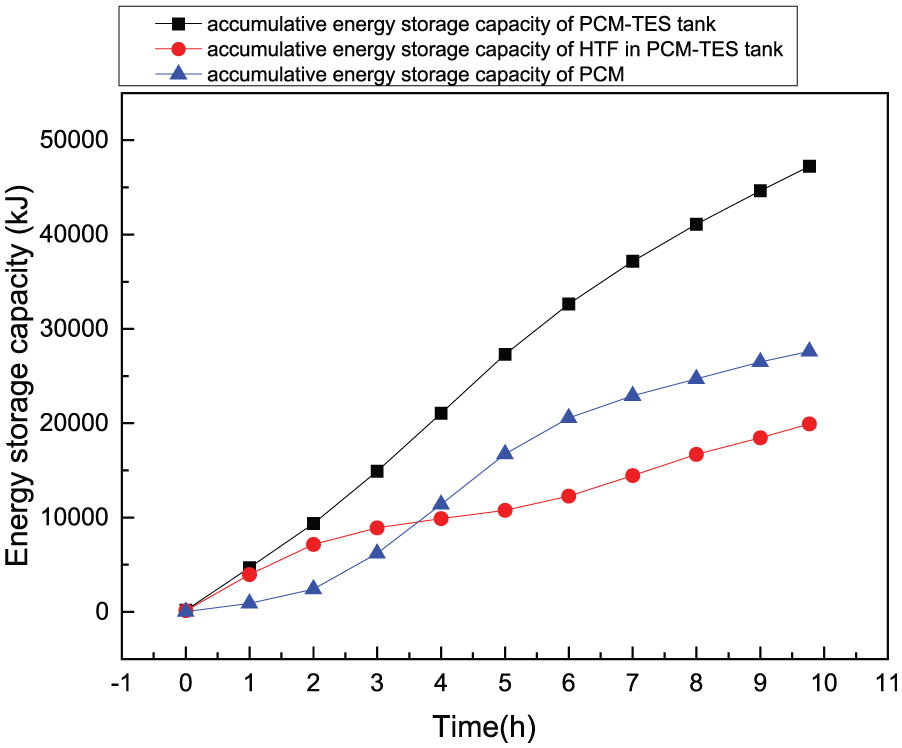
Accumulative energy storage capacity variation over time (water flow rate: 1.0 m3/h).
Analysis of the energy storage under the water flow rate of 1.3 m3/h
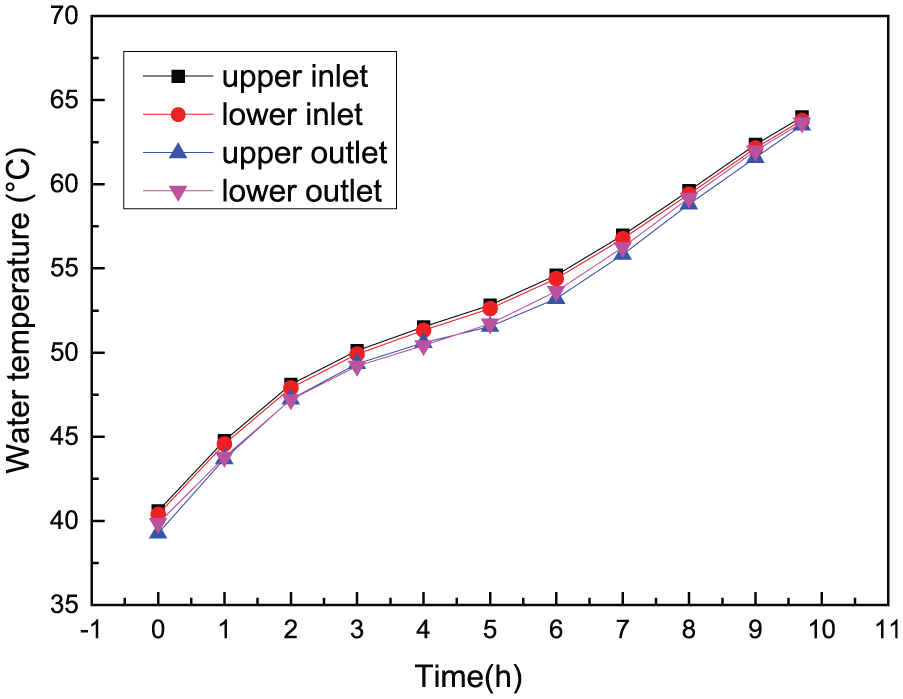
The water flow rate of 1.3 m3/h will be taken into consideration and discussed in detail in the following context. The HTF temperature evolutions of the heat charging process are shown in Figure 9. The result shows that the HTF temperature difference between the inlet and the outlet is 0.8°C.

Temperature evolutions of the HTF between the inlet and the outlet (water flow rate: 1.3 m3/h).
The temperature evolutions of PCM plates during the heat charging process are shown in Figure 10. It can be observed in Figures 9 and 10 that the phase transition process begins at the 2.1th hour and finishes at the end of the 5.53th hour. Furthermore, similar to the result of Figure 6, the temperature of the inlet plate I is higher compared to that of the middle plate II and the outlet plate III.

Temperature evolutions of the PCM plates (water flow rate: 1.3 m3/h).
Figure 11 shows the variation of energy storage intensity in PCM-TES tank. From this figure, it can be seen that the maximum energy storage intensity of PCM-TES tank is 1.83 kW, which appears in the 4.3th hour. Meantime, the energy storage intensity of PCM is 1.52 kW.
Energy storage intensity variation during the heat charging process (water flow rate: 1.3 m3/h).
Figure 12 shows the variation of accumulative energy storage capacity in PCM-TES tank, water, and PCM. As can be seen from Figure 12, the accumulative energy storage capacity of PCM-TES tank reaches to 47,688 kJ, in which the proportion of the PCM energy storage capacity is 57.9%.

Accumulative energy storage capacity variation over time (water flow rate: 1.3 m3/h).
Analysis of the energy storage under the water flow rate of 1.6 m3/h
The water flow rate of 1.6 m3/h is investigated in this section. Figure 13 shows the temperature changes of the HTF at upper and lower sides of inlet and outlet during the heat charging process. It is seen that the HTF temperature difference between the inlet and the outlet is 0.8°C.
Temperature evolutions of the HTF between the inlet and the outlet (water flow rate: 1.6 m3/h).
The temperature changes of PCM plates over time are shown in Figure 14. As observed in Figures 13 and 14, the phase transition process starts at 2nd hour and the phase transition process is completed at 5.4th hour. As shown in Figures 6 and 10, it was observed in Figure 14 that the temperature of inlet plate I is higher compared to that of middle plate II and outlet plate III.
Temperature evolutions of the PCM plates (water flow rate: 1.6 m3/h).
Figure 15 shows the energy storage intensity evolutions of PCM-TES tank during the heat charging process. It can be found that in the 3.3th hour, the PCM-TES tank has the highest energy storage intensity. In the meantime, the energy storage intensity of PCM-TES tank and PCM are 1.99 and 1.70 kW, respectively.

Energy storage intensity variation during the heat charging process (water flow rate: 1.6 m3/h).
Figure 16 shows the variation of the accumulative energy storage capacity over time in PCM-TES tank, water, and PCM. The result shows that the energy storage capacity of PCM-TES tank is 47,549 kJ at the end of the experiment, in which the proportion of the PCM energy storage capacity is 55.6%.

Accumulative energy storage capacity variation over time (water flow rate: 1.6 m3/h).
A comparison of Figures 5, 9, and 13 shows that the temperature difference between the inlet and the outlet in PCM-TES tank is not influenced by the variation of the water flow rate.
By comparing Figures 5, 6, 9, 10, 13, and 14, it reveals that in the case of higher water flow rates, the start time of the phase transition process is earlier. Moreover, it also illustrates that the higher the water flow rates, the shorter the duration time of phase transition process. The main reason is that turbulence effect and heat transfer strengthen as the water flow rate increases.
A comparison of Figures 7, 11, and 15 indicates that higher water flow rates can enhance the heat transfer between the HTF and the PCM, thus the maximum energy storage intensity of PCM-TES tank increases. And the energy storage intensity of PCM is also improved in the case where the energy storage intensity of PCM-TES tank is highest.
Comparing Figure 8 with 12, the result shows that the total energy storage capacity of PCM-TES tank and PCM is improved when the water flow rate increases from 1.0 to 1.3 m3/h. On the contrary, comparing Figure 12 with 16, the total energy storage capacity of PCM-TES tank and PCM decreases when the water flow rate increases from 1.3 to 1.6 m3/h. It can be attributed to the reason that the thermal energy cannot be effectively absorbed by paraffin when the water flow rate is excessive. Therefore, the total energy storage capacity of PCM-TES tank and PCM is highest when the water flow rate is 1.3 m3/h in this experiment.
The heat charging time of PCM-TES tank is compared in Table 2 when the water flow rates are 1.0, 1.3, and 1.6 m3/h, respectively. The result shows that the heat charging time of PCM-TES tank is shortest when the water flow rate is 1.3 m3/h.
Sheet of the characteristic parameters between the PCM-TES tank and the STES tank.
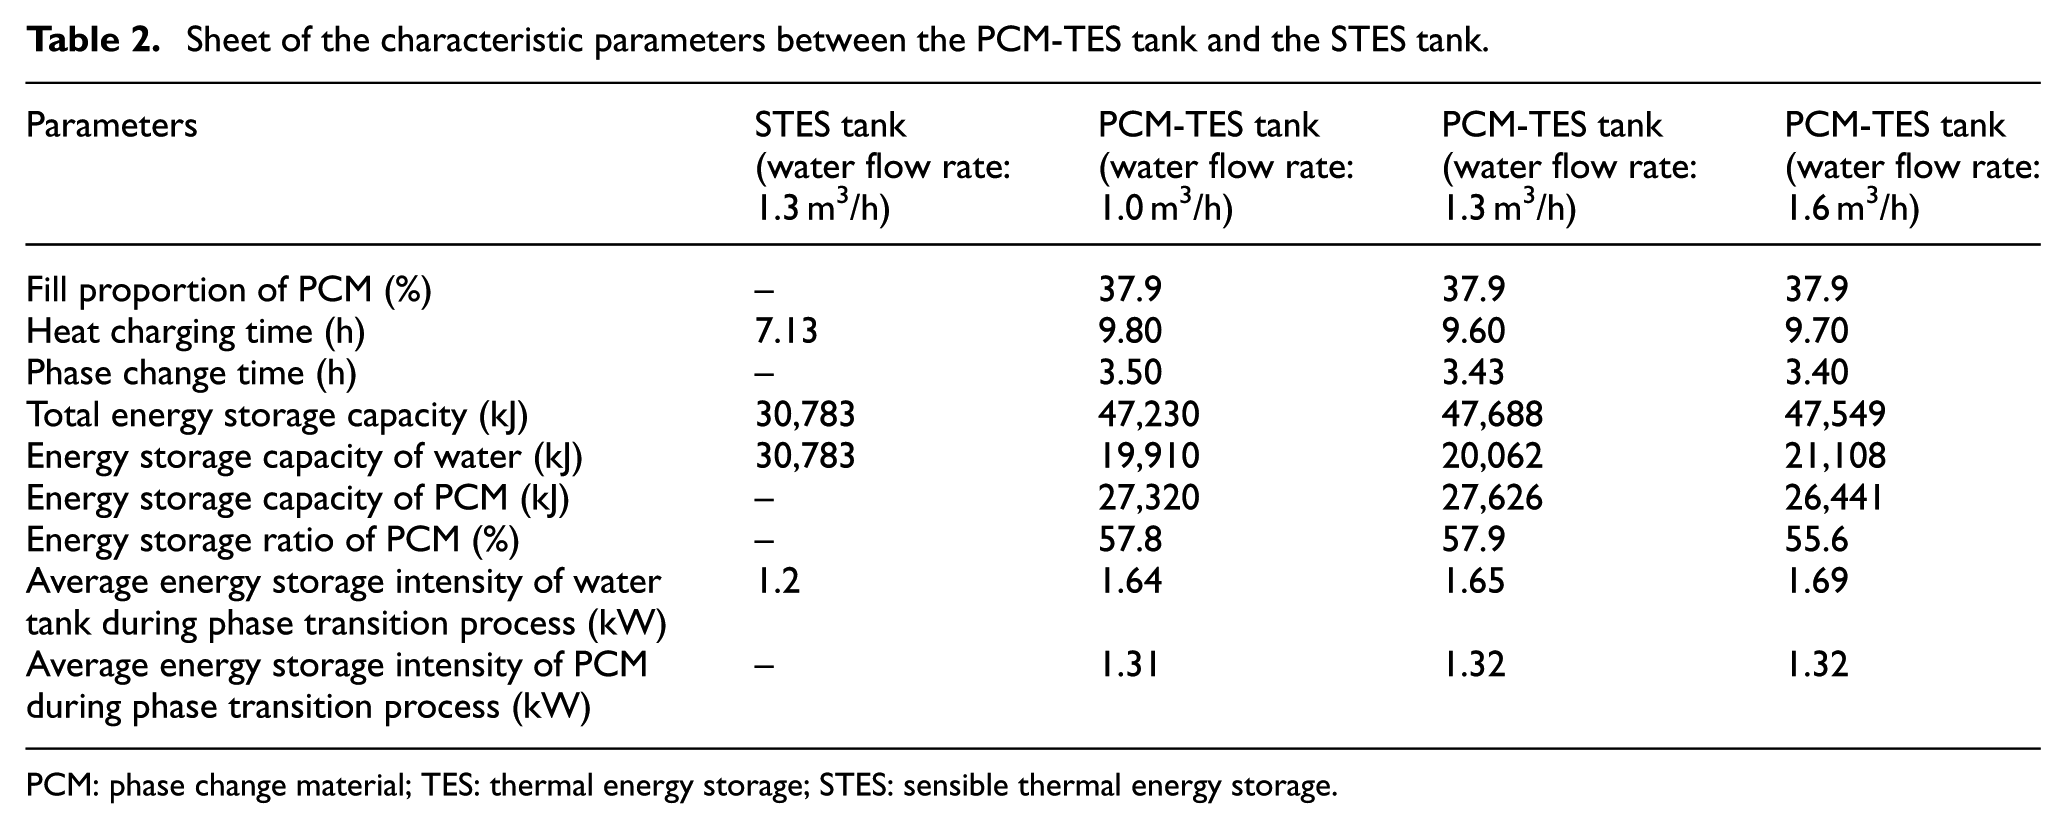
PCM: phase change material; TES: thermal energy storage; STES: sensible thermal energy storage.
Generally, the following conclusion can be drawn when the PCM plates’ distance is 2 cm and the water flow rates are 1.0, 1.3, and 1.6 m3/h, respectively: (1) the higher the water flow rate, the earlier the initial time of the phase transition process; the shorter the duration time of phase transition process, the higher the energy storage intensity of PCM-TES tank and PCM. (2) The heat charging time of PCM-TES tank is shortest, and the total energy storage capacity of PCM-TES tank and PCM is highest at the water flow rate of 1.3 m3/h. Therefore, the water flow rate of 1.3 m3/h can be seen as the optimal condition in this experiment.
Energy storage analysis of STES tank under the water flow rate of 1.3 m3/h
In the front part of the article, the water flow rate of 1.3 m3/h is considered to be the best. In this section, the conventional STES tank is investigated under the water flow rate of 1.3 m3/h.
The water temperature evolutions at upper and lower sides of inlet and outlet are shown in Figure 17. The result revealed that the water temperature of STES tank rises linearly with the heating of STES tank, and that reaches to 60°C at the 7.13th hour and then is maintained at 60°C. It can also be seen that the water temperature change profiles at upper and lower sides of inlet and outlet are almost coincident, which manifest that there are no temperature stratification in the heating process of STES tank.

Temperature evolutions of water in STES tank.
Figure 18 describes the variation of the energy storage intensity and the energy storage capacity over time in STES tank. The energy storage intensity of STES tank fluctuates around 1.2 kW in which the maximum is 1.86 kW and the minimum is only 0.05 kW; the energy storage capacity of STES tank rises linearly and reaches to 30,783 kJ after 7.13th hour.
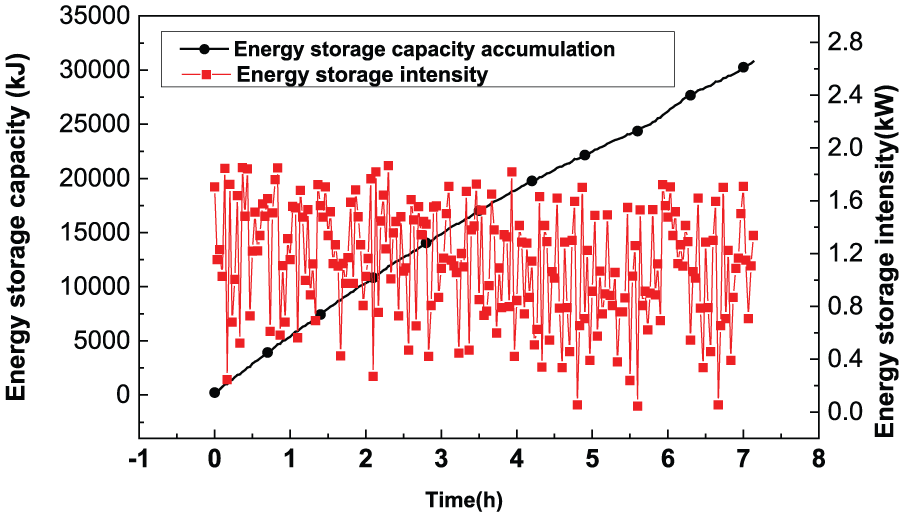
Variation of the energy storage capacity and the energy storage intensity of STES tank.
Figure 19 compares the water temperature of the STES tank at the water flow rate of 1.3 m3/h and that of the PCM-TES tank at the water flow rates of 1.0, 1.3, and 1.6 m3/h, respectively. The result shows that the water temperature of STES tank is higher than that of PCM-TES tank before the phase transition process. The above conclusion can be contributed to two reasons. One reason is that the specific heat capacity of paraffin is about 3.2 kJ/(kg°C) less than that of water (4.2 kJ/(kg°C)) during the sensible heat storage process. The other reason is that paraffin has low thermal conductivity. It can be also seen that the water temperature of STES tank is markedly lower than that of PCM-TES tank after 4th hour. The main reason is that PCMs store energy in the form of LHSs during the phase transition process.
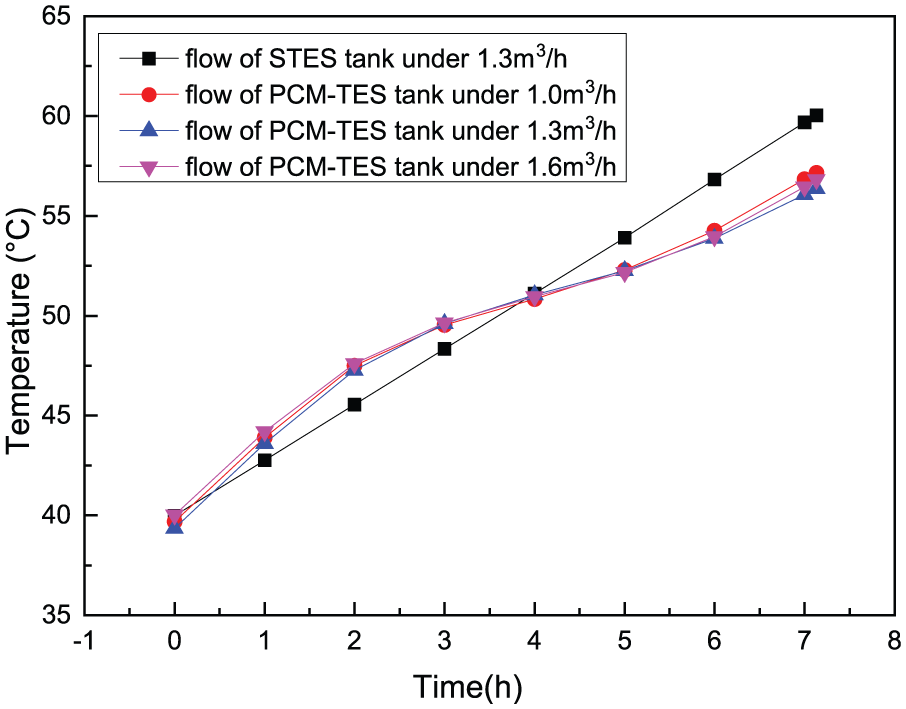
Temperature evolutions of water in PCM-TES tank and STES tank (PCM plate distance: 2 cm).
Figure 20 compares the energy storage capacity variation of the STES tank at the water flow rate of 1.3 m3/h and that of the PCM-TES tank at the water flow rates of 1.0, 1.3, and 1.6 m3/h, respectively. The results indicate that the energy storage capacity of STES tank is higher than that of PCM-TES tank before the phase transition process; the energy storage capacity of PCM-TES tank rises quickly and exceeds that of STES tank during the phase transition process, and the energy storage capacity of STES tank is dramatically lower than that of PCM-TES tank after the phase transition process.

Energy storage capacity variation of PCM-TES tank and STES tank (PCM plate distance: 2 cm).
Comparative analysis of energy storage under different water flow rates between PCM-TES tank and STES tank
In order to compare the energy storage performance of the STES tank with the PCM-TES tank in detail, the experimental results on different water flow rates are shown in Table 2.
Comparing the energy storage intensity of the STES tank with the PCM-TES tank, it can be seen that the average energy storage intensity can be significantly improved by adding PCM. Moreover, the results also show that the average heat intensity can be increased to 40.83% and the total energy storage capacity can be increased to 54.92%. The main reason is that although the paraffin has low heat capacity in sensible heat storages, the heat storage performance of paraffin can effectively improve in LHSs.
Comparative analysis of experimental results under different plate distances
From the previous analysis, it is found that the water flow rate of 1.3 m3/h is the optimal. Therefore, in the following experiments, the investigation of PCM plates’ distance will be carried out under the water flow rate of 1.3 m3/h.
Comparative analysis of energy storage under the plate distance of 3 cm
In this section, the PCM plates’ distance of 3 cm is investigated and the duration of the heat charging is 8.63 h. Moreover, the 21 pieces of PCM plates are encapsulated in the PCM-TES tank, and the PCM plates in the PCM plates’ distance of 3 cm is reduced by 5 pieces compared to the case where the distance of PCM plates is 2 cm. The volume of the PCM plates accounts for 30.6% of the PCM-TES tank volume.
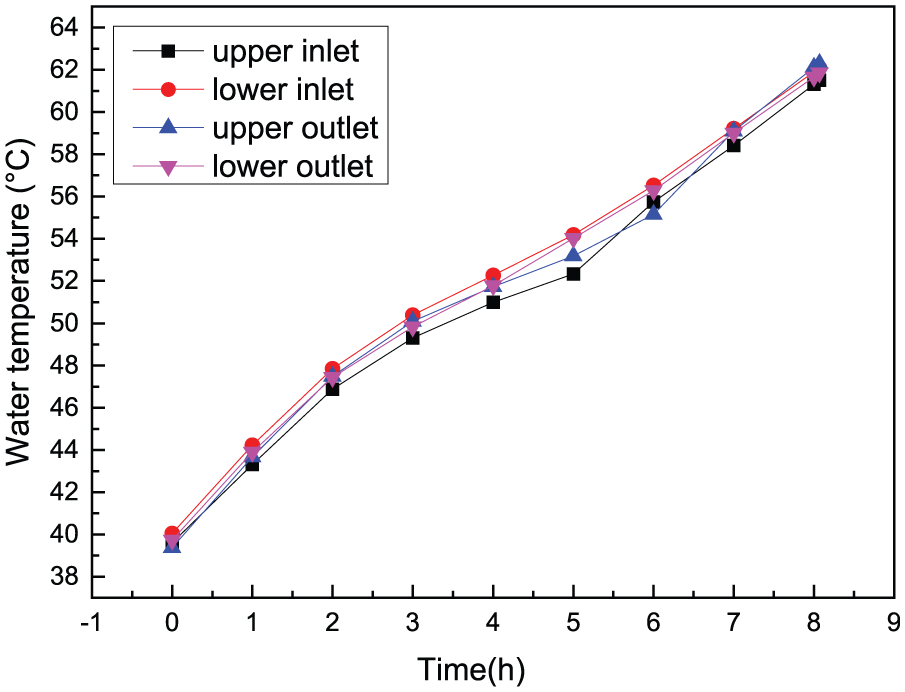
Figure 21 shows the HTF temperature changes at upper and lower sides of inlet and outlet. The result shows that the HTF temperature evolution trend at upper and lower sides of inlet and outlet is similar.
Temperature evolutions of the HTF between the inlet and the outlet (PCM plate distance: 3 cm).
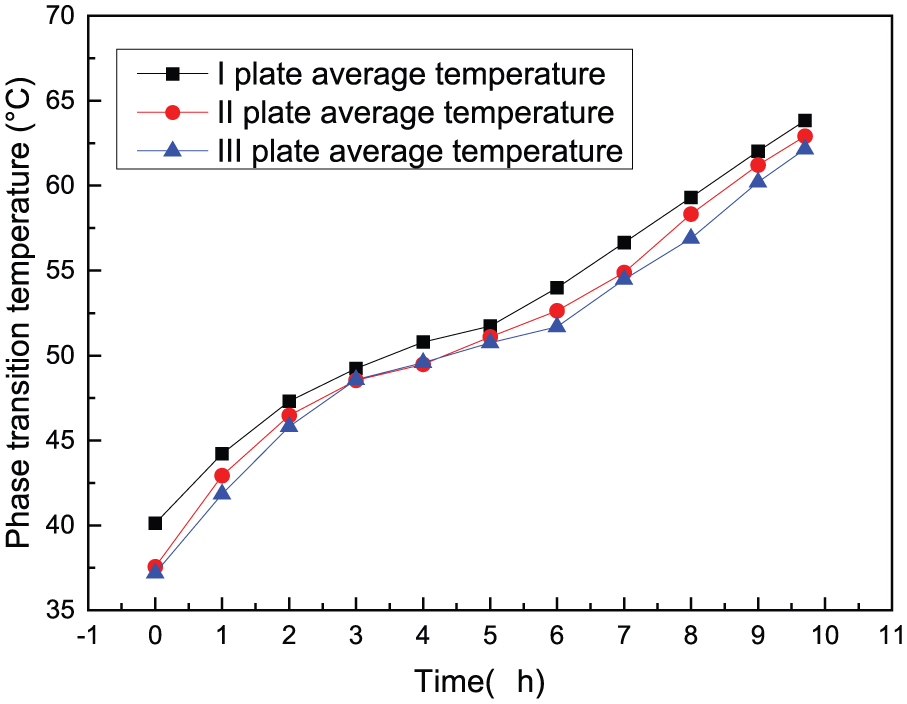
Figure 22 shows the temperature changes of PCM plates over time. It can be seen in Figures 21 and 22 that the phase transition process begins at the 2.3th hour and finishes at the 5.5th hour. In addition, it also shows that at the same experimental time, the temperature of inlet plate I is markedly higher than the middle plate II and the outlet plate III.
Phase transition temperature of PCM plates (PCM plate distance: 3 cm).
Comparative analysis of energy storage under the plate distance of 5 cm
In this section, the PCM plates’ distance of 5 cm is considered to study the performance of PCM-TES tank and the duration of the heat charging is 8.07 h. The 16 pieces of PCM plates are encapsulated in the PCM-TES tank, and the PCM plates in the PCM plate distance of 5 cm is reduced by 5 pieces compared to the PCM plate distance of 3 cm. The volume of the PCM plates accounts for 23.3% of the PCM-TES tank volume.
The temperature evolutions of the HTF and the PCM plates in PCM-TES tank are shown in Figures 23 and 24. From Figures 23 and 24, it can be seen that the phase transition process begins at the 2.4th hour and finishes at the 5.3th hour. Similar to the result of Figure 22, the temperature of the inlet plate I in Figure 24 is also markedly higher than the middle plate II and the outlet plate III. By comparing Figures 21–24, the result shows that the duration of the phase transition is shortened when the PCM plates decreased.
Temperature evolutions of the HTF between the inlet and the outlet (PCM plate distance: 5 cm).

Phase transition temperature of PCM plates (PCM plate distance: 5 cm).
Comparative analysis of energy storage intensity under different plate spacing
Figure 25 compares the energy storage intensity of the PCM-TES tank under the PCM plate distance of 2, 3, and 5 cm, respectively. It is observed that the fluctuation of energy storage intensity during the PCM plate distance of 2 and 3 cm is smaller than that of the PCM plate distance of 5 cm. The main reason is that the energy storage stability of the PCM-TES tank is improved when the PCM plates increase.
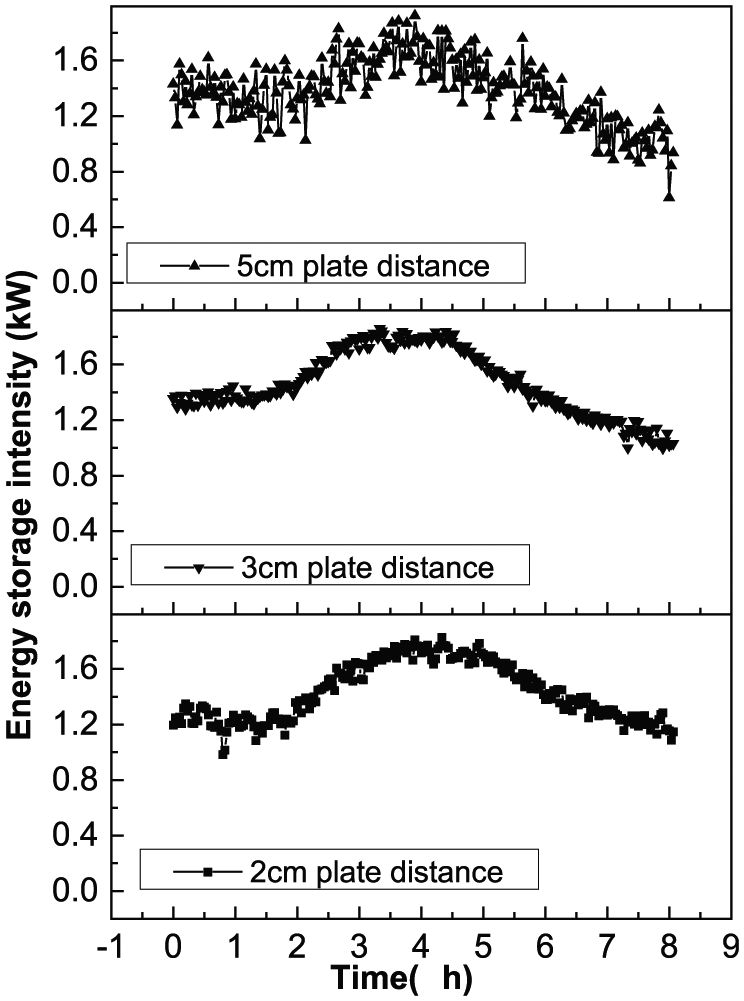
Comparison of the energy storage intensity under the PCM plate distance of 2, 3, and 5 cm.
The energy storage intensity of PCM under the PCM plate distance of 2, 3, and 5 cm is shown in Figure 26 for comparison. Similar to the result of Figure 25, the energy storage stability of PCM under the PCM plate distance of 2 and 3 cm is better than that of the PCM plate distance of 5 cm.
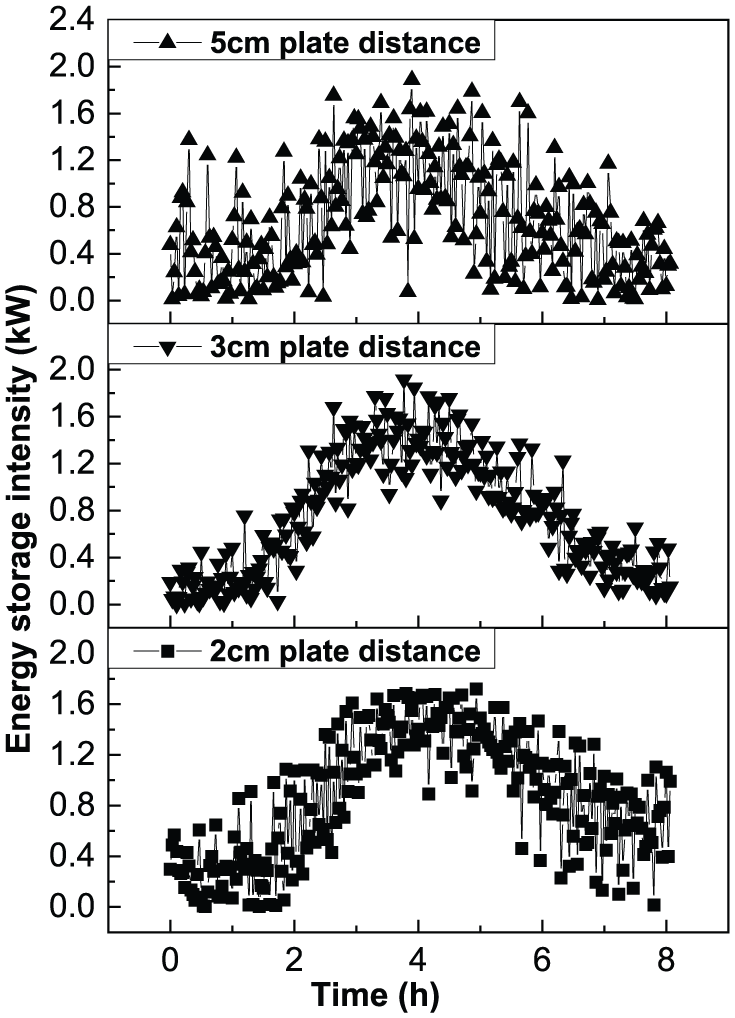
Comparison of the energy storage intensity under the PCM plate distance of 2, 3, and 5 cm.
In order to compare the energy storage intensity of Figure 25 with 26 in detail, the experimental results of different PCM plate distances in the process of experience and phase transition are shown in Table 3.
Statistical table of energy storage intensity.

PCM: phase change material; TES: thermal energy storage.
Compared to different PCM plate distances, it is shown in Table 3 that the average energy storage intensity of PCM-TES tank under the PCM plate distance of 3 cm is highest during the heat charging process, and that of PCM-TES tank under the PCM plate distance of 2 cm is higher than the PCM plate distance of 5 cm. Therefore, at the optimum water flow rate of 1.3 m3/h, the PCM plate distance of 3 cm is the best.
Comparative analysis of energy storage under different plate distances between PCM-TES tank and STES tank
Comparing the water temperature changes of PCM-TES tank at different PCM plate distances with that of STES tank, it can be seen from Figure 27 that the water temperature of PCM-TES tank is obviously higher than that of STES tank before the 2.3th hour. However, the water temperature of PCM-TES tank increased slowly after the 2.3th hour, meanwhile, the water temperature under the PCM plate distance of 3 cm is higher than that of the PCM plate distances of 5 and 2 cm. At the end of the experiment, the water temperature of STES tank reaches 60°C, and the water temperature is 56.37°C, 58.82°C, and 59.36°C when the PCM plate distances are 2, 3, and 5 cm, respectively.

Temperature evolutions of water in PCM-TES tank and STES tank (water flow rate: 1.3 m3/h).
Figure 28 compares the energy storage capacity of PCM-TES tank at different PCM plate distances with that of STES tank. The results show that the energy storage capacity of STES tank is close to that of PCM-TES tank in the PCM plate distance of 5 cm before the phase transition process, which is higher than the energy storage capacity of PCM-TES tank under the PCM plate distances of 2 and 3 cm. Then, the energy storage capacity of PCM-TES tank significantly increases during the phase transition process. During the end of experiment, it can be observed that the PCM-TES tank under the PCM plate distance of 3 cm has the highest energy storage capacity, and the energy storage capacity of PCM-TES tank under the PCM plate distance of 2 cm is higher than that of the PCM plate distance of 5 cm.

Energy storage capacity variation in PCM-TES tank and STES tank (water flow rate: 1.3 m3/h).
Table 4 compares the energy storage parameters of the STES tank with the PCM-TES tank in different PCM plate distances. It can be seen that the energy storage percentages of PCM are 57.9%, 51.1%, and 43.7% when the PCM plate distances are 2, 3, and 5 cm, respectively. And compared to the STES tank, the heat storage capacity of the PCM-TES tank is increased by 54.9%, 45.7%, and 30.6% when the PCM plate distances are 2, 3, and 5 cm, respectively. The main reason is that adding PCM into water tank can obviously improve the energy storage capacity and maintain a constant temperature.
Parameters of PCM-TES tank under different plate distances.

PCM: phase change material; TES: thermal energy storage; STES: sensible thermal energy storage.
Conclusion
The influence of the water flow rates and the PCM plate distance on the heat storage performance of the PCM-TES tank is investigated in this article. Meanwhile, at the water flow rate of 1.3 m3/h, the thermal storage performance of STES tank is investigated to compare with that of PCM-TES tank. The following conclusions can be obtained.
Under the PCM plate distance of 2 cm, the energy storage intensity of PCM-TES tank and PCM is improved and the duration time of the phase transition process is shortened when the water flow rate rises from 1.0 to 1.6 m3/h.
Under the PCM plate distance of 2 cm, the total energy storage capacity of PCM-TES tank and PCM is highest at the water flow rate of 1.3 m3/h. The average heat intensity increases by 37.5%, and the total energy storage capacity increases by 45.68% compared to that of STES tank.
At the water flow rate of 1.3 m3/h, the duration of the phase transition process is shortened when the PCM plate distance increases. And the average energy storage intensity with the PCM plate distance of 3 cm in PCM-TES tank is highest.
The water flow rate of 1.3 m3/h and the PCM plate distance of 2 cm are the best cases in this article. In this case, the average heat intensity increases by 42.5% and the total energy storage capacity increases by 54.9% compared to that of STES tank.
Footnotes
Appendix 1
Academic Editor: Jiin-Yuh Jang
Declaration of conflicting interests
The author(s) declared no potential conflicts of interest with respect to the research, authorship, and/or publication of this article.
Funding
The author(s) disclosed receipt of the following financial support for the research, authorship, and/or publication of this article: This work was sponsored by Sichuan Province Science and Technology Support Program (no. 2014GZ0133) and the National Science Foundation of China (no. 51478058).