
Abstract
In this article, computational fluid dynamics technique has been applied to examine the disk friction loss and leakage effect on performance of a Francis model turbine, and a model test for obtaining hydraulic efficiency of the turbine was also conducted. The analysis of the results shows that near the optimal operating point, computational fluid dynamics can predict accurately the turbine hydraulic efficiency compared with experimental value, validating the applied computational fluid dynamics method. The disk friction loss of the runner is observed to increase with the increment of unit speed, and the band surface of the runner produces more disk friction losses than the runner crown surface. Furthermore, the disk friction loss from the inner surfaces of the band and crown is basically equivalent to the one from the outer surfaces. Doubling the clearance size reduces the total friction loss but decreases the turbine efficiency as well. It is also observed that the pressure field on the runner blade suction side is more sensitive to the clearance size than on the pressure side. Moreover, the leakage flow from the clearance near the runner band deteriorates the inflow condition for the downstream draft tube and the flow pattern inside resultantly. It is also observed that the phenomenon of rotor–stator interaction has very limited effects on both the disk friction loss and leakage loss.
Introduction
In turbomachinery, the disk friction loss is produced due to viscosity when a fluid flows through a gap between the rotor and stationary component, resulting in energy loss on the outer surface of the rotor.1,2 For a Francis turbine, the disk friction loss is assumed to be very critical for predicting accurately the overall efficiency of the turbine. 3 In addition, the leakage flow through the runner clearance influences strongly the flow in the downstream draft tube and consequently the turbine performance.
The disk friction loss has been extensively examined in pumps. Van Esch and Kruyt 4 applied computational fluid dynamics (CFD) results obtained by a potential flow model to calculate the disk friction loss of a mixed flow pump, with several empirical formulations being compared. Guelich 5 developed a model to predict the disk friction loss for shrouded impellers of pumps, covering laminar and turbulent flow, as well as smooth and rough flow regimes. Mikhail et al. 6 reported by experiment that for centrifugal pumps, the disk friction coefficient increases parabolically with increasing specific speed and decreases with increasing pump capacity. Moreover, some other work regarding the disk friction loss has been reported by some researchers.7–9
However, the research related to disk friction loss in hydraulic turbines is relatively scarce. The empirical models obtained from pumps may not be applied directly to hydraulic turbines since two types of fluid machines have totally different flow structures: acceleration in flow for turbines and deceleration in flow for pumps.
CFD technique has been successfully applied in simulating flow fields of fluid machinery. There is lots of research using CFD for simulating internal flow fields and performance prediction for Francis turbines10–14 but very limited research focusing on disk friction loss or leakage flow. Ma et al. 15 reported some results on the sealing clearance dimension effect on the operation stability of a Francis turbine unit. Li and Zou 16 examined the influence of leakage flow from the runner band clearance on the runner inlet flow for a Francis turbine using CFD method. Celic and Ondracka 17 implemented CFD to investigate the influence of disk friction on efficiency of a Francis turbine.
In this article, the disk friction loss and leakage effect of a Francis model turbine were studied both qualitatively and quantitatively using CFD, and model tests were conducted to validate the results from CFD simulations. The components of disk friction losses have been determined separately and compared in detail. In addition, the effects of rotor–stator interaction and the size of clearance on disk loss and leakage loss were also investigated.
Numerical simulations and experiment
Geometry and mesh generation
The Francis model turbine under investigation has a runner diameter D1 = 0.35 m, with a specific speed of 232.6 (r/min, kW, m). The turbine is comprised of a spiral casing, 24 stay vanes, 24 guide vanes, a runner with 13 x-shaped blades, and an elbowed draft tube. The circular diameter of guide vanes is D0/D1 = 1.13, and the relative height of guide vanes is b0/D1 = 0.265. The computation domain of the model turbine is illustrated in Figure 1. In addition, the meridional view of the runner is given in Figure 2, including two side chambers: crown chamber and band chamber. The clearances near the runner crown and band are 0.15 mm for this model turbine, shown in enlarged views in the figure for a better view.

Computational domains of the model turbine.
Runner meridional view with clearances.
The mesh generation of flow components was accomplished using AYSYS ICEM CFD with high-quality structured grids. The mesh was separately created for each flow component, and different meshes were combined through the way of general grid interface (GGI). For flow components with blades and vanes, such as stay vanes, guide vanes, and especially runner, a combination of H-grid and O-grid was applied with multi-block strategy. The O-grid was arranged around the blades and vanes, and H-grid was applied in the left region. In order to capture the complex flow structure in the clearance regions, the mesh inside has been well-controlled and refined. In the minimum gap of 0.15 mm, there were 15 nodes placed in the direction parallel to the gap. The mesh quality is evaluated by minimum angle of 35.8°, minimum determinant of 0.45, and maximum aspect ratio of 32.6. The mesh views of model turbine flow components are presented in Figure 3, including meridional view.

Mesh view for flow components, including meridional view: (a) runner, (b) runner midspan, (c) spiral casing, (d) stay and guide vanes, (e) draft tube, (f) meridional view, and (g) enlarged view at runner meridional plane.
Numerical procedure
The internal flow field inside the Francis model turbine was obtained using ANSYS CFX-16.0. For boundary conditions, a constant total pressure was defined at the casing inlet, with flow direction normal to the inlet surface. At the outlet of the draft tube, mass flow rate was specified. Smooth and no-slip condition was imposed on walls. Three interfaces were introduced to connect different domains in simulations. Second-order accuracy was chosen for space discretization method and advection terms. The SST (Menter’s Shear Stress Transport) turbulence model was utilized to close the time-averaged Navier–Stokes (N-S) equations. This model is assumed capable of predicting accurately flow separations under adverse pressure gradient conditions.18,19
Turbine model test
The experimental test of the model turbine was accomplished in a hydraulic universal test stand shown in Figure 4, with a picture demonstrating the turbine runner under investigation. All measuring devices and test methods in this test stand are based on the requirements from the international standard IEC-60193 for model acceptance tests for hydraulic machines. 20 The total uncertainty of efficiency measurement is small than 0.20%. According to the code of IEC-60193, the measured efficiency of a model turbine is the hydraulic value, and the disk friction loss and leakage loss (i.e. volumetric loss) are considered as parts of hydraulic losses. Therefore, the measured efficiency of the model turbine can be directly compared with that predicted by CFD simulations. Therefore, by default, the turbine efficiency in this article is referred to hydraulic efficiency, which is named efficiency in short.

Model test stand (upper) and model runner (lower).
Results
Results from steady simulations
For steady simulations, the “frozen rotor” method is applied between mesh interfaces between different frames of reference, in which the flow flux is transferred from one component to the next while keeping the relative position between them unchanged. The convergence criterion of simulation is that maximal residuals are below 10−4 for all governing equations.
Numerical errors in a solution due to mesh should disappear with an increasingly fine mesh theoretically. 21 Therefore, it is important to get a mesh-independent solution. A mesh refinement study is performed for the steady calculations of the model turbine, and the turbine efficiency is chosen to be the judging criterion which is defined in equation (1)

where M is the torque around the turbine rotating axis, ω is the angular velocity, ρ is the density, Q is the turbine flow rate, and H is the head.
The relationship of turbine efficiency and mesh size is plotted in Figure 5, for the best efficiency operating point. It can be observed that the change in efficiency is less than 0.01% when the mesh size is increased from 12 million to 14 million. Therefore, using a mesh of 12 million is assumed for this Francis model turbine to obtain a mesh-independent CFD result. With this mesh size, the y+ is generally below 50 in the whole computational domain, enabling a good resolution on boundary layer and consequently accurate predictions on losses and flow separations. Moreover, the mesh discretization error has been calculated using grid conversion index (GCI) method,22,23 and the value of GCI for the selected number of grid nodes is about 1.2% for the turbine efficiency at the best efficiency point.

Turbine efficiency at different mesh size.
Figure 6 illustrates the turbine hill chart obtained from the model test. The unit speed n11 and unit flow rate Q11 are defined as follows


Hill chart of the model turbine from model test.
It can be observed that the best efficiency is 95.4% occurring at n11 = 68.8 r/min, Q11 = 0.718 m3/s.
For CFD simulations, six operating points located at the best guide vane opening α = 23.4° based on model test results are chosen to compare with experiments. The mentioned operating points listed in Table 1 are marked in the hill chart in Figure 6, with OP2 being the best efficiency point. In addition, the head used for CFD simulation is kept constant at H = 30 m, which is the same with the head applied in experiment.
Operating points for CFD simulations.

CFD: computational fluid dynamics.
The comparison of turbine efficiency between numerical simulations and experiments is given in Figure 7 for different operating points listed in Table 1. The operating point is represented by the unit speed n11 acting as the horizontal axis coordinate, based on the fact that the disk friction loss is reported dependent on rotating speed, and the difference in unit flow rate Q11 among the selected operating points is relatively small (less than 10%). Two cases have been given in CFD results: with and without consideration of the disk friction loss. It can be seen that the turbine efficiencies predicted by CFD without the disk friction loss are higher than experimental results for all shown operating points. However, after taking into account the disk friction loss in CFD results, the agreement between CFD results and experiment near the best efficiency point OP2 becomes much better, and the discrepancy in efficiency is generally less than 0.11% for operating points OP1, OP2, OP3, and OP4. At these operating points, no flow separation or backflow is observed in the flow field after checking CFD results. However, for the operating points deviating highly from the best efficiency point OP2, such as OP5 and OP6, the discrepancy between CFD and experiment results starts to increase, resulting in a difference of 2.2% at OP6. Through checking CFD results at OP5 and OP6, it is found that flow separation occurs on the runner suction side (SS) due to an excessive incidence at the leading edge. In addition, flow separation is also found in the draft tube, which is induced by the bad inflow condition produced by the upstream runner. The reason for increasing discrepancy could be the deficiency in accuracy of CFD results under the conditions with flow separations and backflows by the applied steady simulation method. In this case, CFD generally overpredicts the hydraulic losses, resulting in a lower hydraulic efficiency.
Efficiency comparison.
In order to examine the characteristic of each part of disk friction loss in detail, Figure 8 shows the components of efficiency loss caused by the disk friction, namely, the disk friction loss, as a function of unit speed. The disk friction loss is caused by the inner and outer surfaces of the crown and band of the runner (see Figure 2), which is defined as follows

where Md is the torque generated by the surface of the crown and band of the runner, which is in the opposite direction of the main torque generated by the runner blades, expressed in a negative value.
Disk friction loss distribution.
It can be observed from Figure 8 that all components from the disk friction loss increase with unit speed n11, consequently with rotating speed
Table 2 gives the leakage mass flow rate
Leakage mass flow from runner band clearance.

Figure 9 depicts pressure contours in the runner meridional plane at OP2. It can be observed that the pressure in the upper crown chamber is much higher than in the lower band chamber. The pressure in the crown chamber decreases gradually with radius, and the pressure gradient in the band chamber is much smaller than in the crown chamber.
Pressure contours in runner cross section at optimal point OP2.
In order to investigate the leakage flow effect on flow structure in the downstream draft tube, the comparison of meridional velocity profiles at the runner outlet between with and without considering the leakage flow is shown in Figure 10, for a severe off-design condition OP6 (see Figure 6). The leakage flow reduces the meridional velocity near the crown and increases the velocity gradient in the blade height direction. This effect deteriorates the inflow condition for the draft tube, further the flow pattern inside the downstream draft tube. By comparing the streamlines in the draft tube for this operating point in Figure 11, it is found that the flow separation on the right side of the pier has become stronger.
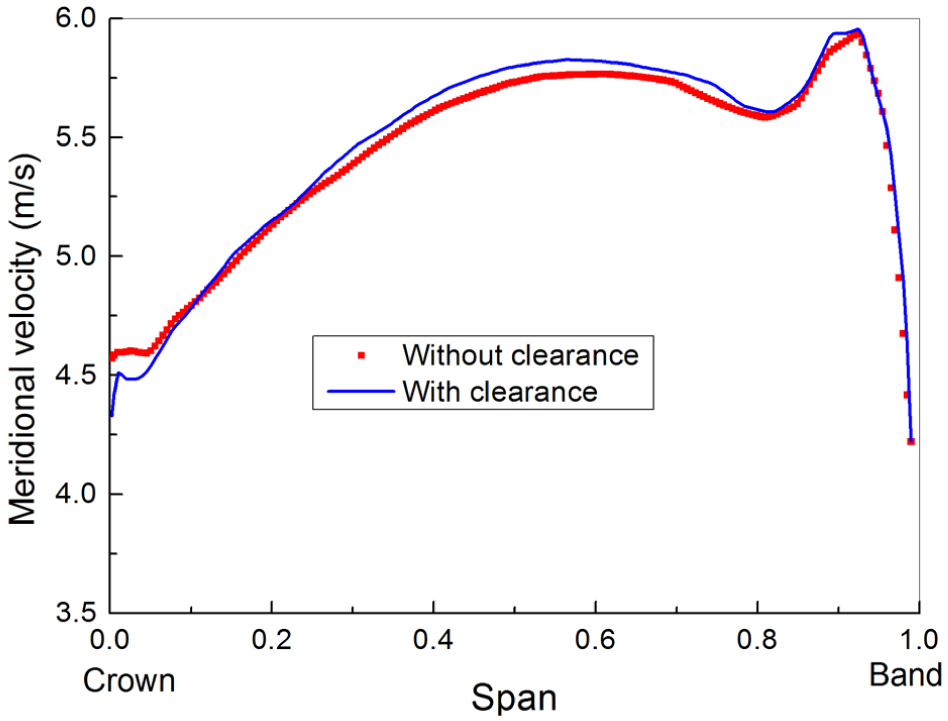
Meridional velocity profile at runner outlet at OP6 (n11 = 90 r/min, Q11 = 0.663 m3/s).
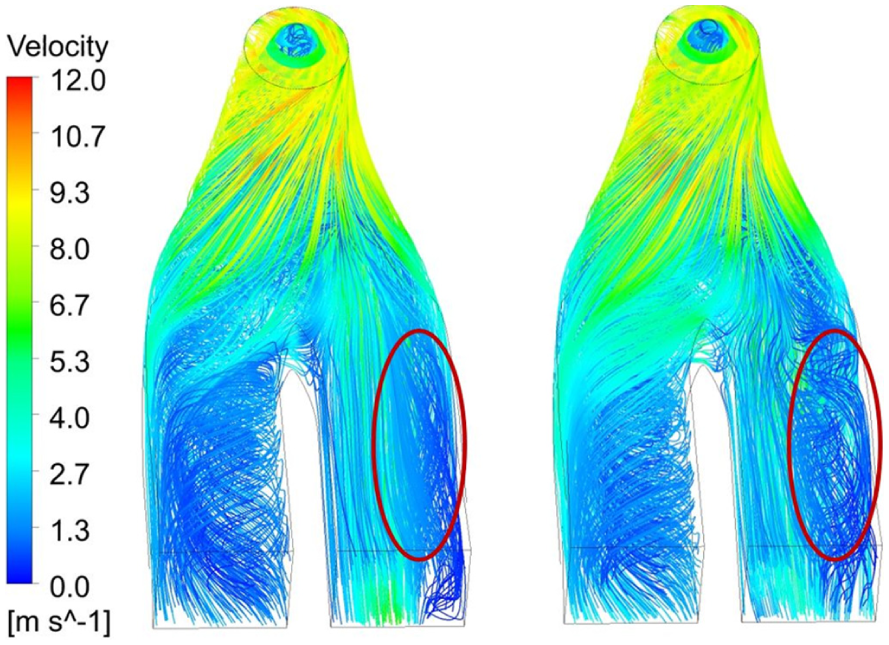
Streamlines in draft tube at OP6: with runner clearance (left) or without runner clearance (right).
Effect of clearance size
The size of clearance has been doubled to 0.3 mm, to examine the clearance size effect on the total disk friction loss. According to Figure 12, the total disk loss has the same trend, increasing with n11. The increment of clearance size brings a decrease in total friction loss in the whole range, generally in approximately 10% in relative magnitude, which is not evident. However, the increase in clearance size leads to a bigger decrease in runner efficiency than the decrease in total friction loss, as shown in Figure 13, resulting overall in a reduction in turbine efficiency.

Comparison of total disk loss between different sizes of clearance.

Comparison of total hydraulic efficiency of the turbine between different sizes of clearance.
The comparison of leakage flow from runner band clearance is illustrated in Figure 14 for the two sizes of clearance. It shows that the volumetric loss increases with increasing clearance, as expected. The volumetric loss at the clearance of 0.30 mm is about 0.5%, slightly increasing with unit speed n11, much higher than the value of around 0.18% for the clearance of 0.15 mm.

Comparison of leakage flow from runner band clearance between different sizes of clearance.
The comparison of pressure on runner blade surface at OP2 is plotted in Figure 15. It is seen that the effect of clearance on the pressure field on the runner surface becomes stronger with an increasing clearance size, and the effect is more evident near the runner band than near the crown. Furthermore, the blade SS of the runner is more sensitive to the clearance size than the pressure side (PS), indicated by a higher variation of pressure among different clearance sizes.
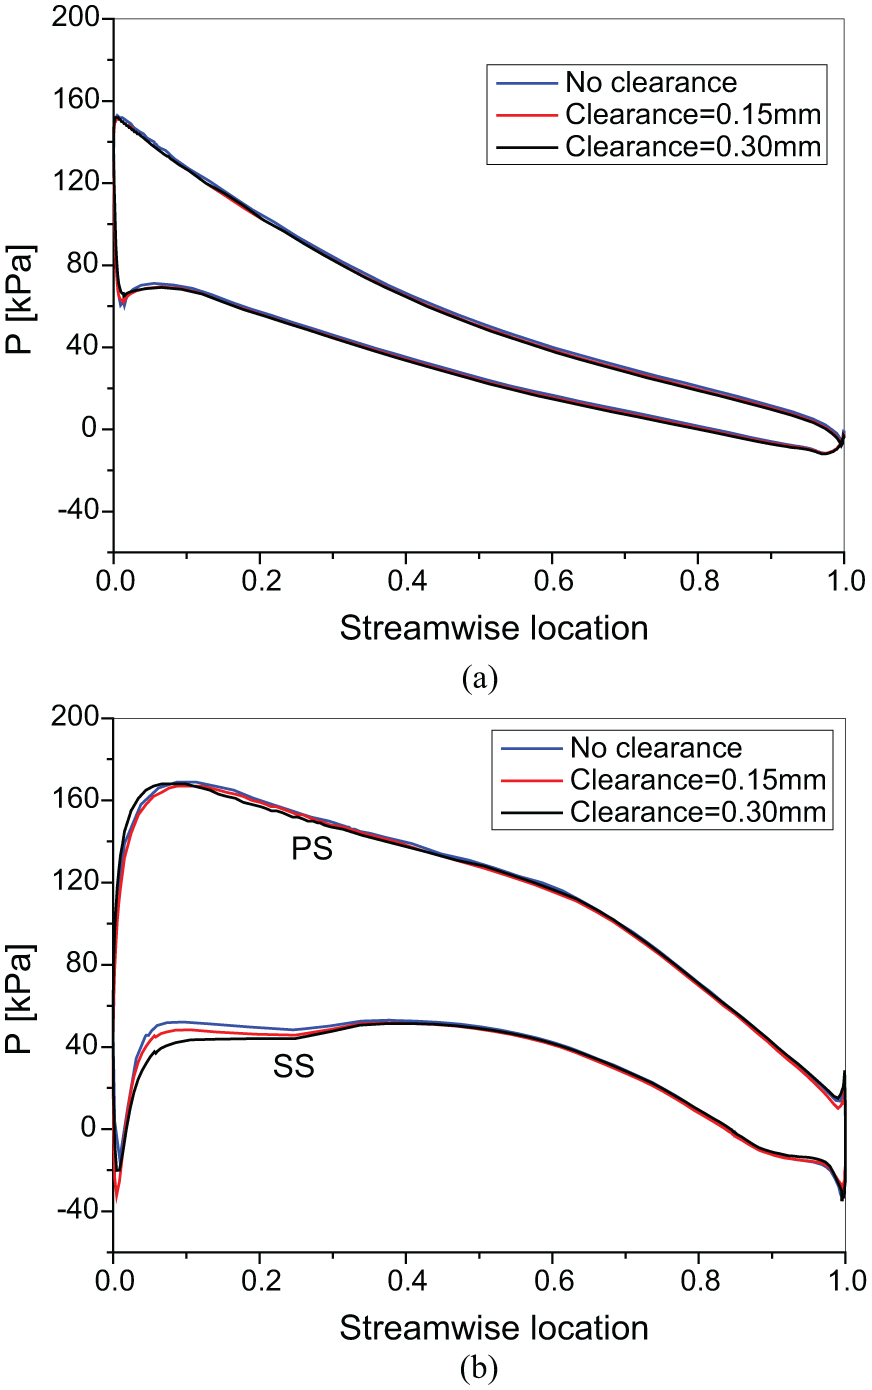
Pressure comparison on runner blade surface at OP2: (a) near crown, span = 0.01 and (b) near band, span = 0.99.
Results from transient simulations
Transient simulations have been performed for the optimal operating point OP2 and one off-design condition OP5, to examine the effect of rotor–stator interaction on disk friction loss and leakage loss. The time step
The fluctuations of disk loss components for OP2 at one turbine period T are plotted as a function of time t in Figure 16. Here, inner disk includes the inner surface of the runner crown and band, and outer disk represents the outer surface of the runner crown and band. It is found that 13 peaks and valleys exist in the variations of the efficiency loss both by the inner and outer disks, corresponding to the runner blade number Zr = 13. Therefore, the frequency spectra of these fluctuations are predominated by the passing frequency of the runner blades. In addition, the magnitude of the inner disk loss is quite close to that of the outer disk loss. The fluctuating amplitude of disk loss is relatively small, only in a relative magnitude of 0.15%. This suggests that the runner rotation accompanying with different relative positions between the rotating and stationary components influences hardly the disk friction loss. Therefore, the phenomenon of rotor–stator interaction affects hardly the disk friction loss. The same feature has been observed in the leakage mass flow from the runner band clearance in one turbine rotation period shown in Figure 17, with a relative fluctuating magnitude of 0.03%.

Disk friction loss as a function of time for optimal point OP2.

Leakage mass flow from runner band clearance as a function of time at OP2.
At off-design conditions, there are some low frequencies in the flow field, caused by flow separations, backflows, and vortex ropes in draft tube. Therefore, the computation is more time-consuming for obtaining a convergent, that is, periodic result. Figure 18 depicts the variations of head and runner torque as functions of simulating time at off-design condition OP5. It can be observed that the period for both head and torque fluctuation curves is now 3.8 times bigger than the turbine period T. This period has also been verified by the dominating frequency,

Head and total torque at off-design condition OP5: (a) fluctuations and (b) frequency spectrum.
Figure 19 shows the variation of disk friction loss for the off-design condition OP5 obtained from transient simulations. The same period (3.8T) can be observed with that in head and torque in Figure 17. However, the relative fluctuating amplitude is quite small, around 0.1%, denoting again that the disk friction loss is hardly influenced by rotor–stator interaction.

Disk friction loss as a function of time at OP5.
Conclusion
CFD has been successfully applied to examine the disk friction loss and leakage effect on performance of a Francis model turbine, and a model test for obtaining turbine efficiency was also conducted for validating CFD results. Through the CFD result analysis and its comparison with experiments, the following conclusions can be drawn:
Near the optimal operating point, the applied CFD method considering disk friction loss can predict accurately the turbine hydraulic efficiency, which has been validated by the comparison with experimental results. However, CFD overestimates hydraulic losses due to flow separations at severe part-load conditions, resulting in a lower turbine efficiency compared to experimental value.
The runner band surface produces much more disk friction loss than the crown surface. In addition, the total disk loss is proportional to the cube of rotating speed.
Doubling clearance size decreases the total friction loss generally by approximately 10% in relative magnitude and decreases overall the turbine efficiency.
The clearance has a stronger effect near the runner band than near the crown, and the runner blade SS is more influenced by the clearance flow than the PS.
The disk friction loss caused by the inner surfaces of the runner crown and band is basically equivalent to the one due to the outer surfaces of the runner crown and band. Based on it, for a Francis turbine with a very complicated geometry in crown and band chambers, the disk friction loss caused by the runner outer surface could be roughly evaluated by the one of the runner inner surface which could be easily calculated in CFD results without considering the chambers of the crown and band.
The leakage flow from the runner band clearance deteriorates the inflow condition for the downstream draft tube and the flow pattern inside.
The phenomenon of rotor–stator interaction has very limited effects on both disk friction loss and leakage loss.
Footnotes
Appendix 1
Academic Editor: Oronzio Manca
Declaration of conflicting interests
The author(s) declared no potential conflicts of interest with respect to the research, authorship, and/or publication of this article.
Funding
The author(s) disclosed receipt of the following financial support for the research, authorship, and/or publication of this article: This research was supported by the National Natural Science Foundation of China (grant nos. 51679195, 51339005, 51379174, and 51479167).