
Abstract
Production technology has increased rapidly with the development of industrial technology. Conventional human visual inspection is insufficient for conducting quality control under this increased capacity. Therefore, high-speed and high-accuracy automated optical inspection is becoming increasingly crucial. In this article, we propose an automated inspection method for a compact camera lens using a circle Hough transformation, weighted Sobel filter, and polar transformation. Our analysis of defects in the compact camera lens identified problems including of the circular texture and the non-fixed position of the inspection region. To overcome these problems, we design an inspection algorithm for locating and inspecting a circular region. A machine learning support vector machine method is then applied for obtaining a precise detection result. The experimental results show that the proposed inspection method is suitable for detecting defects in a complicated circular inspection region, and that the proposed system exhibited high performance.
Keywords
Introduction
Automatic optical inspection (AOI) techniques are becoming increasingly crucial in various applications because quality control plays an important role in contemporary manufacturing. However, conventional human visual inspection is inefficient because of the following limitations: 1
It is not feasible with increased production capacity.
It does not ensure high quality, because human fatigue may lead to the introduction of inspection errors.
It cannot satisfy increasingly high tolerance requirements.
It is slow and costly.
With technological advancements, surfaces are becoming too complicated to be inspected using human vision.
As a result of these limitations, computers are being used for performing AOI in manufacturing. However, some difficulties are still encountered in AOI. With enough information, human visual inspection can easily recognize defects in a tested product. By contrast, it remains difficult for a computer to recognize a defect accurately because of various defects such as scratches, cracks, stains, scars, and checking. In addition, defect positions are not fixed. The image acquisition environment also affects the quality of the captured image, especially if dust and reflections from metal are present; the resulting bright spots can be easily mistaken for defects, making the inspection problem more difficult. Therefore, AOI methods must be specifically designed for various products under different environments. Studies have already proposed several AOI methods for different industrial products.2–7 These methods can be divided into five categories: the intensity-based, gradient-based, frequency-based, learning-based, and hybrid approaches. In general, operational errors during product assembly lead to product defects. The intensity of these defects, such as scratches and checking, differs with the surroundings. Therefore, the intensity-based inspection approach was developed. 2 The main concept in this approach is that the intensity of defective regions is usually higher than the mean value of the whole image. Thus, a simple thresholding method can be applied to high-intensity defect detection. However, this approach easily fails when the image quality of the captured image is low or has insufficient contrast. In the gradient-based inspection approach, 3 the contrasts of defective regions are usually higher than those of non-defective regions. The gradient measurement is the difference between two pixels. Therefore, the testing image can be converted into a gradient image. A pixel in the testing image is recognized as a defective pixel when the gradient exceeds a preset threshold. However, when the texture of the testing image has a gradient value similar to that of defects, using a gradient to detect a defective region can be more difficult. The aforementioned inspection approaches fail when the intensity or contrast of the defective regions is similar to the texture of the testing image. The frequency-based inspection approach 4 can be applied to solve this problem. Usually, pixels are similar within regions that have the same texture. The shape of the components in a product should be regular. However, when defects are generated, the shapes of defective regions are irregular. Identical shapes usually have the same frequency in the frequency domain. Therefore, the tested image can be transformed from the spatial domain to the frequency domain. Subsequently, a frequency that does not exist in non-defective regions is identified. However, if the shape of a defective region is similar to the texture of the product’s surface, the frequency-based inspection approach cannot be applied. Machine learning classification methods, such as neural network and support vector machine (SVM), have been demonstrated as successfully overcoming this difficult problem. 5 The main concept of the learning-based inspection method is to learn a good decision rule from the features of ground truth data and use this decision rule to identify defective regions. A robust feature such as a defect area and the gradient of a defect can help achieve favorable inspection results. If proper features are used as input data for a learning-based method, we can expect a favorable inspection result. In a learning-based method, finding appropriate features is critical. Many researchers use different features to detect different defects in a learning-based method. However, as mentioned, with technological advancements, the surfaces of manufactured products are becoming more complicated. Therefore, using one of the aforementioned methods to detect defects is insufficient. To overcome this problem, a hybrid inspection method has been proposed.6,7 Instead of using only one approach to inspect product quality, two or more of the aforementioned inspection methods are combined to improve the efficiency of the inspection task. A hybrid strategy is also applied to detect defects when using a compact camera module because this approach can suffer from various defects and problems including defocus, black/white dots, color defects, line defects, and dim defects.8–10 AOI has been used to check the surface of a lens and a printed circuit board.11,12 Discrete cosine transform has been used for measuring energy, which represents the amount of change in intensity. Whether an inspected region is defective is determined according to the amount of energy. It is mentioned in the reference that the particles can appear in various positions during the assembly process. 13 If the particles appeared, part of the captured image will be blocked by the particle. It is big problem, and remaining defects have the same problem, so we need to inspect the micro camera lens to find any defect on lens.
In this article, we propose an automatic inspection method for a compact camera lens using a weighted Sobel filter, polar coordinate transformation, and SVM classification method. In Figure 1, the inspection region is indicated by a red circle. If a circular inspection region can be converted into a rectangular inspection region, a circular texture can also be converted into a horizontal texture. Then, we can simply ignore the horizontal texture when inspecting the surface of the compact camera lens. However, the position of inspection region is not fixed. Therefore, we locate the inspection region before the defect detection procedure. Because the inspection is similar a perfect circle, we apply the circle Hough transformation to locate a circular inspection region with a known radius. To convert a circular inspection region into a rectangular one, a polar coordinate transformation is applied to convert a Cartesian coordinate into a polar coordinate. Subsequently, to compute the gradient while reducing the effect of the texture, a weighted Sobel filter is used to extract the gradient map with a larger weight of vertical components. However, some small noisy regions remain in the gradient map. The morphological operations are used to remove these small noisy regions and fill the hole within large area regions. To obtain a complete candidate defective region, the watershed segmentation method is applied. Finally, to precisely select real defects among candidate defective regions, several proper features are extracted from candidate defective regions as inputs for the SVM classification method.
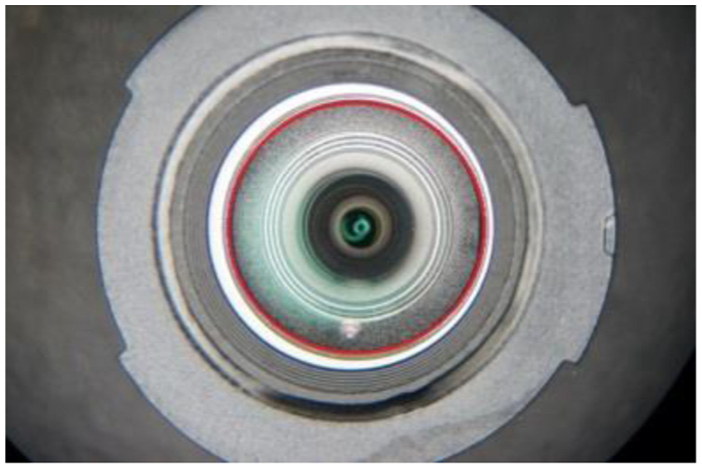
Red circle is the inspection region in testing image.
The rest of the article is organized as follows. In section “Related works,” we briefly review the related works on defect detection. Section “Proposed method” presents our proposed defect detection and classification algorithm in detail. The experimental results are then designed for verifying the proposed method. Finally, we conclude this article in section “Conclusion.”
Related works
Recently, studies have increasingly applied learning-based approaches to perform defect detection from a digital image. Unlike other approaches, learning-based approaches do not require any preset parameters; nonetheless, they can solve difficult decision problems. Chang et al. 5 proposed a learning-based inspection approach using a neural network classifier for defect detection in various regions on an light emiting doide (LED) die. This LED die consisted of two main components, a light-emitting area and a p-electrode, as shown in Figure 2. Chang et al. used the radial basis function neural network (RBFNN) as the mapping algorithm because it possesses a short learning time and favorable generalization ability when performing interpolation in the output space. The network learns from training pairs, which consist of an input and a desired output, and adjusts the weights to minimize the error between the actual and desired responses.

A demonstration of LED die.
For inspecting the light-emitting area, this portion is divided into four “L”-shaped blocks. This division facilitates detection because in a defective chip, features change substantially within a small region. The p-electrode area has an “O”-like shape for inspection. The number of pixels in the p-electrode region, the mean, standard deviation, and a deviation that is smaller than the standard deviation are extracted as features for this region. Subsequently, for feature extraction, the statistical and geometric features are measured and used as inputs for the RBFNN. However, with developments in semiconductor manufacturing, chip surfaces are becoming more complicated. A single inspection approach is inadequate for inspecting the complicated surface of an inspected object. To increase the robustness of an inspection system, Chen et al. 6 proposed a hybrid approach to detect defects on a complicated surface. They divided the chip surface into two parts: the circuit and bump parts. For the circuit part, a ground truth reference image exists. This image is used for comparison with the testing image. A pixel is recognized as a real defective pixel when its difference values exceed the preset threshold after a difference operation is performed on the reference and testing images.
For the bump part, as shown in Figure 3, the area of the probe mark is used to identify defects. If the probe marks on the bumps are either too large or consist of many small defective regions, the chip is recognized as a defective bump. By contrast, a bump is considered non-defective when the area of the probe mark is within the tolerance range. Another problem is that misalignment affects the measurement of the area of the probe mark. Therefore, the referential approach is not feasible for detecting such defects on the bump. Chen et al. applied a design-rule strategy to develop a non-referential approach that locates the bump and evaluates the area of the probe mark on the bump to identify a defect. The inspection method of Chen et al. divides a complicated surface into two parts and then detects defects in each part using different inspection methods. With a hybrid inspection strategy, a difficult inspection problem can be reduced to two or more simple inspection problems.

Demonstration of bump.
According to Moore’s law, the number of transistors in a dense integrated circuit doubles approximately every 2 years. The increasing number of transistors on a chip makes the defect detection problem more difficult. The inspection system must capture an image with larger magnification for accurate defect detection of a chip with a more complex surface. Figure 4 shows several types of defects; red rectangles indicate defects and blue rectangles indicate non-defective regions such as reflection and dust. However, non-defective regions are similar to defects. This will increase the difficulty of defect inspection.

Defects on chip. 7 Center image is testing image that contains different types of defects. The magnification with red rectangle is defects, the left side magnification is low-intensity defect, and the right side magnification is high-intensity defect. Blue rectangles are high-intensity regions that are similar with high-intensity defects, but not defects.
For inspecting such a complicated surface, Chang et al. 7 proposed a hybrid AOI method using a spatial filter and machine learning. The defects on the chip are divided into two categories: high- and low-intensity defects. Chang et al. considered that low- and high-intensity defects differed such that detecting both high- and low-intensity defects is more difficult. In addition, low-intensity defects always appear at the chip boundary. Chang et al. used two different inspection methods for high- and low-intensity defects, respectively. For high-intensity defects, the inspection problem is more difficult. Defects as well as non-defective regions such as reflection and dust exist. To distinguish “real” defects among candidate defects, Chang et al. applied a machine learning classification method to the proposed method. The smoothness, complexity, and structure of defects are used as input features for identifying real defects; the features are shown in Figure 5. The aforementioned inspection methods reveal that for inspecting a complicated surface, a single approach is insufficient for recognizing all types of defects. For the remaining low-intensity defects, a spatial defect detection method is performed to identify the chip boundary and check whether the boundary is defective. Instead of using only one inspection method, two or more inspection methods are combined to establish an inspection system that can increase the robustness of defect detection.
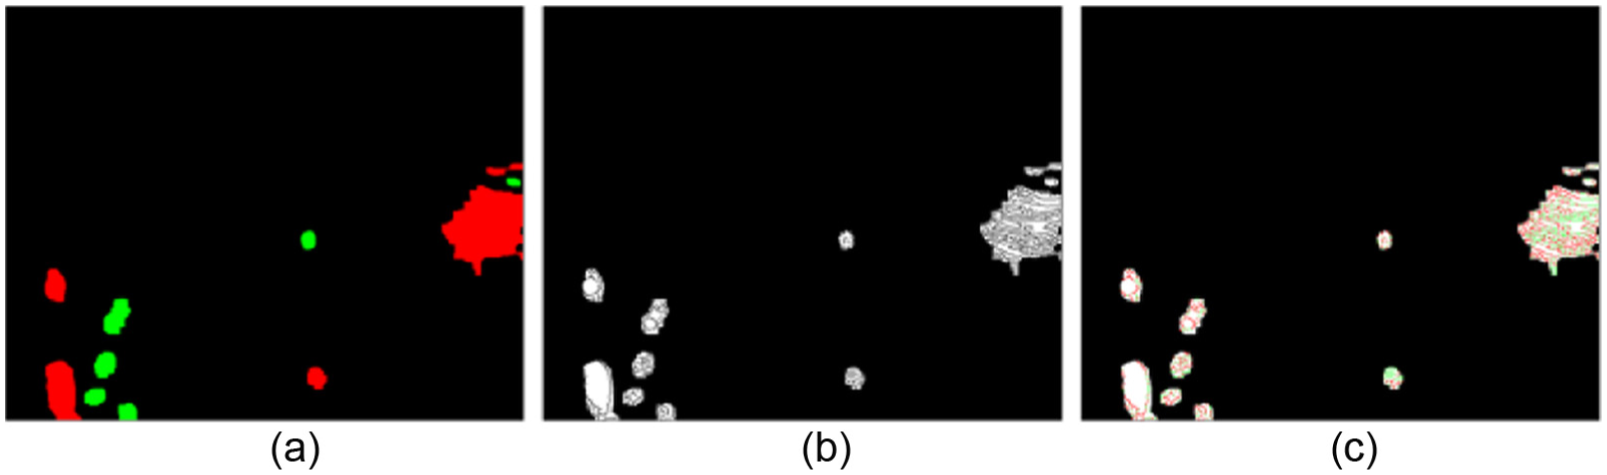
Features of defects 7 : (a) smoothness, (b) complexity of texture, and (c) structure of defect.
An efficient inspection system has also been designed for detecting a defective compact camera module,8–10 because manual inspection is insufficient for inspecting the number of compact camera lenses with varying defects on its surface, including black/white dot, color, line, dim, and defocus defects. AOI is also applied to detect defects on the surface of a lens.11,12 The defects include pinholes, scratches, and possibly small dirt particles that are difficult to detect. To highlight very small changes in intensity, block discrete cosine transform is applied.
According to the aforementioned studies, we can summarize the flowchart in the following steps:
Locate the inspection region.
Extract candidate defect region.
Classification for finding real defects.
We applied these steps to our inspection work. To observe the defect in the testing images, we category the defects into five types of defects include scratch, bright dot, scar, stain, pit, and dot as demonstration in Figure 6. Scratch, bright dot, stain, and scar appear at the surface of lens; pit and dot appear at the part of spacer ring. And the dot and pit defect have small area. The scratch and scar have long and narrow shape. The stain and bright dot have high intensity. Each type of defect has its characteristic; we summarize the characteristics of defects Table 1.
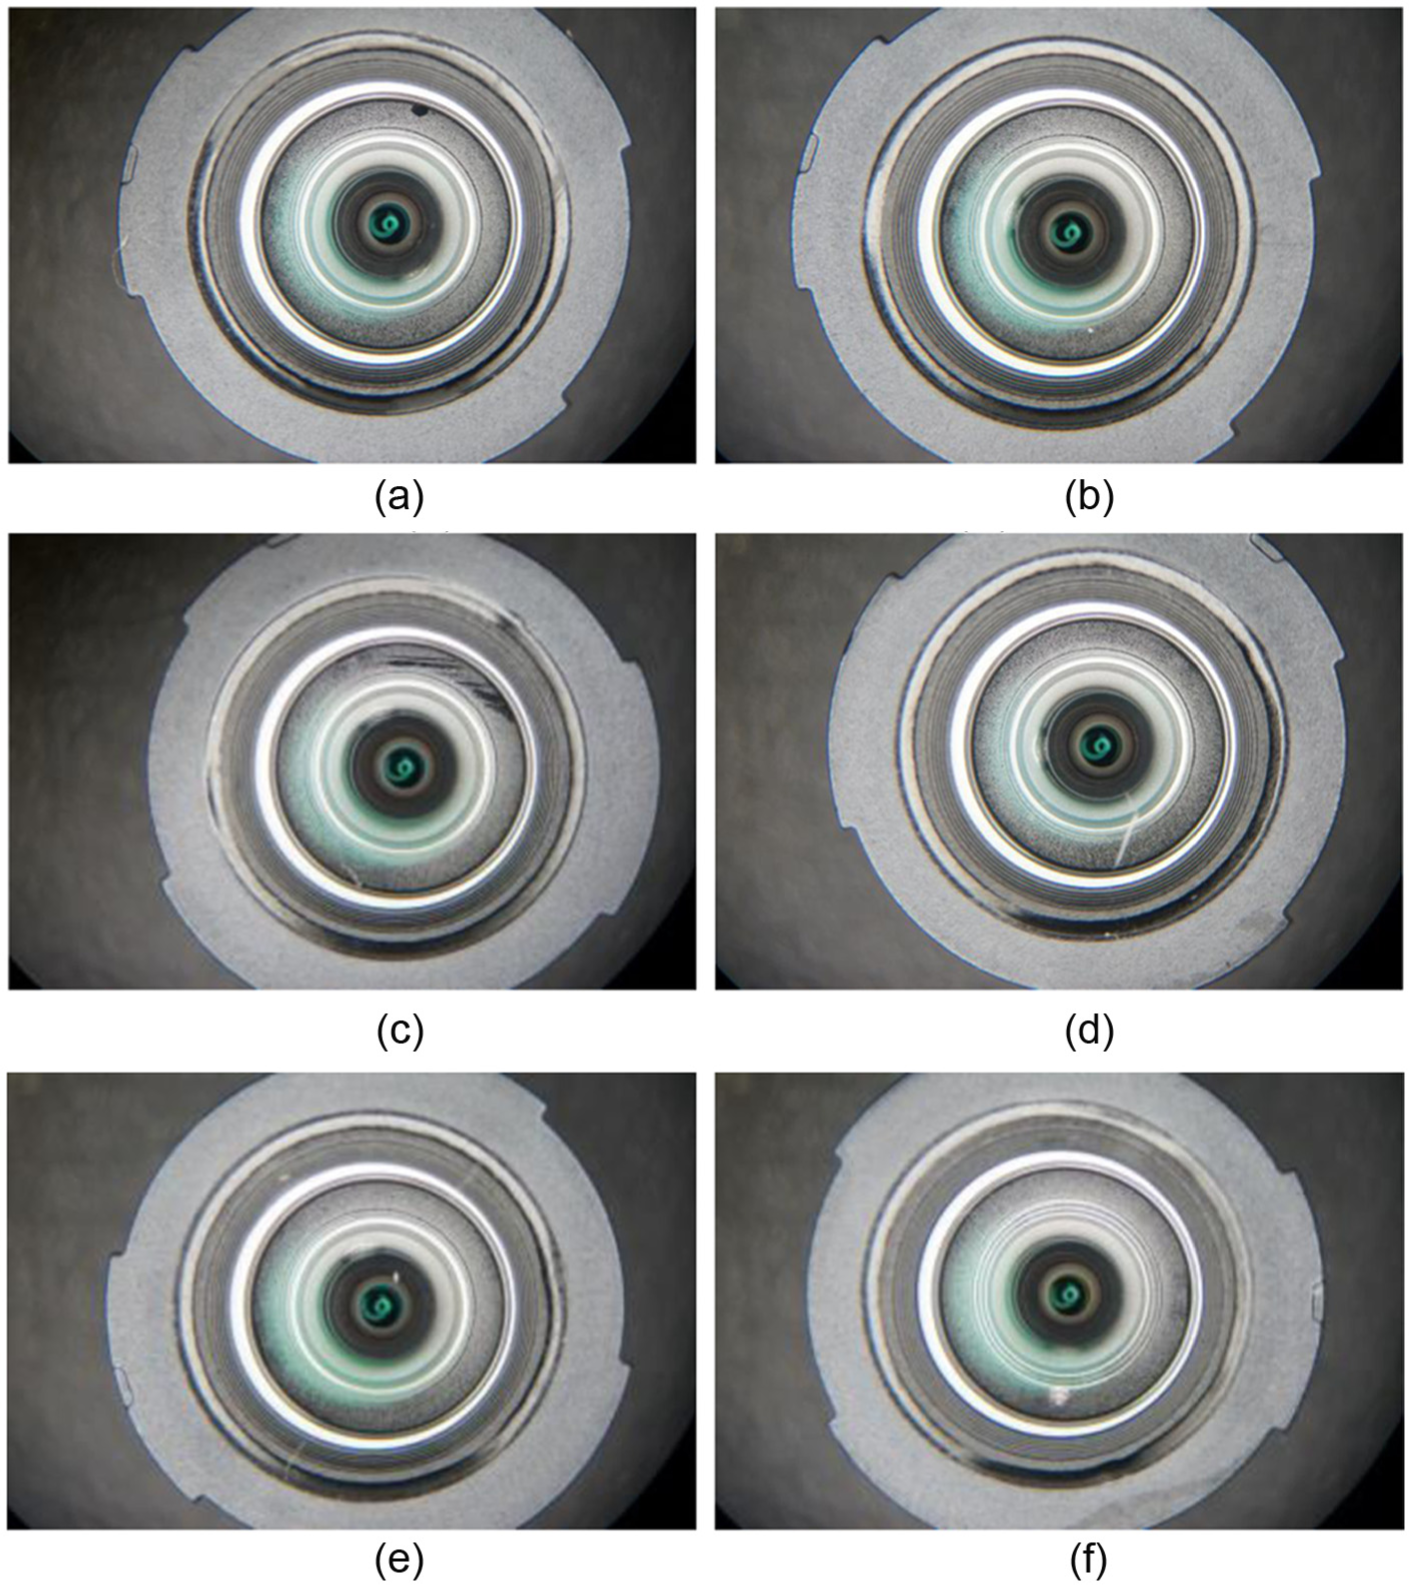
The demonstrations of defects: (a) the stain defect on lens, (b) the bright dot defect on lens, (c) the scratch defect on lens, (d) the pit defect at spacer ring, (e) the scar defect at spacer ring, and (f) the bright dot at spacer ring.
Description of defects.

From Figure 6, we can note that the defects are various in different testing images. Suggestion from the literatures when several types of defects exist in an inspection region, the most efficient approach is to treat each type of defect separately instead of treating all defects simultaneously. In this article, we analysis the characteristics of defects, and then we propose a hybrid-based inspection algorithm for a compact camera lens to solve the problems. The detail of proposed defect detection algorithm is described in next section.
Proposed method
Before introduce proposed algorithm, we give a simple demonstration that how the inspection system works. The overview of inspection system is shown in Figure 7. While the production moving on the production line, the camera captures the testing image and then the captured image is used as input for our defect detection algorithm. Our algorithm returns the inspection result to the control system. The control system handles the remaining task according to the inspection result.
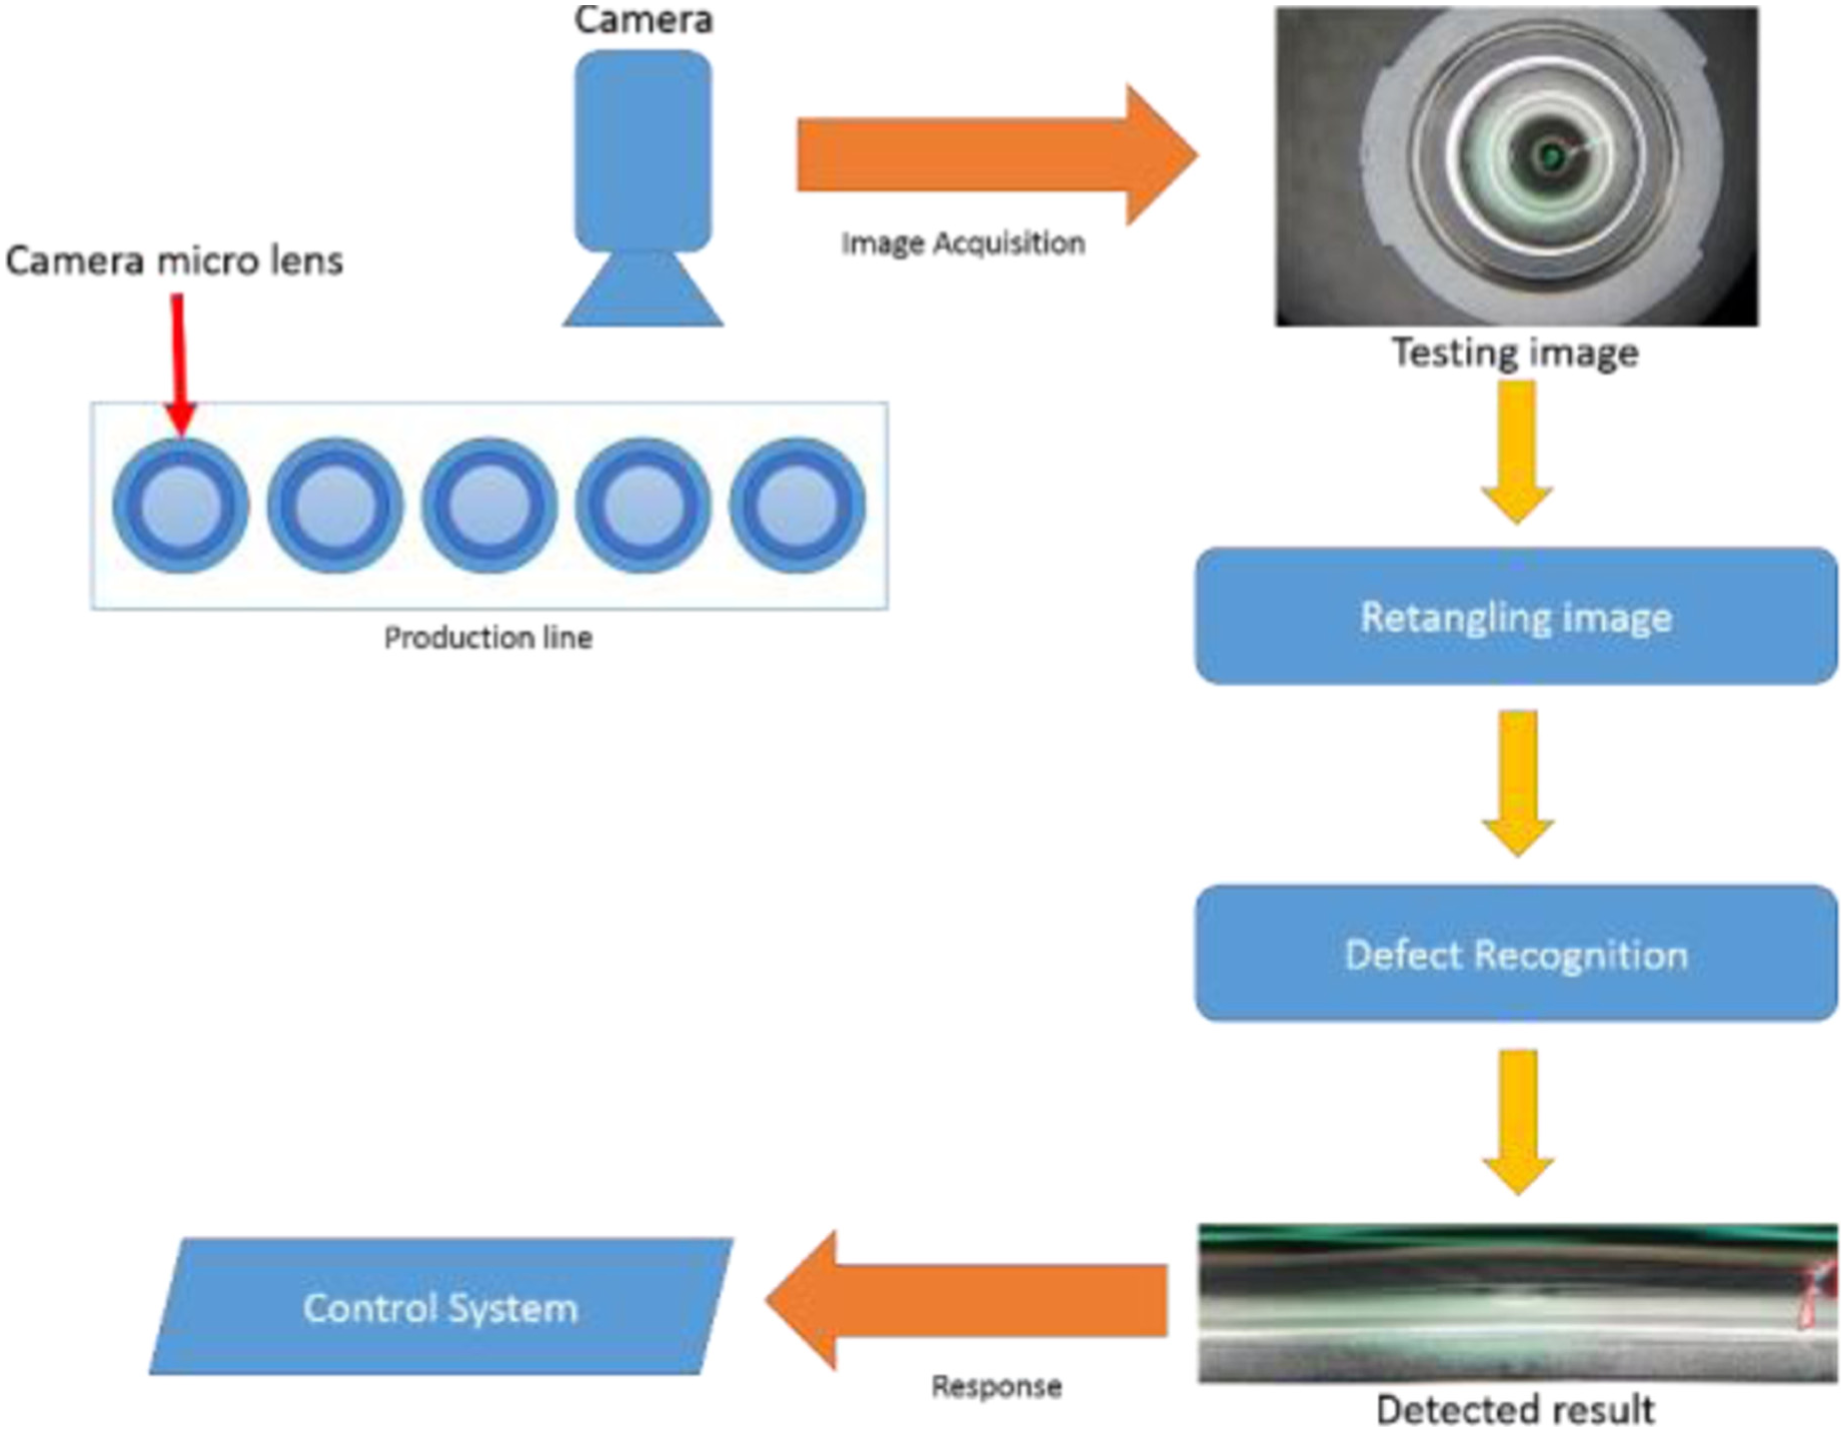
Overview of inspection system.
In the remaining part of this section, we introduce proposed inspection algorithm in detail. Figure 8 shows the magnification views of various defects in testing image. In observing the defects in Figure 8, we have the following considerations: (1) the position of a defect is random, (2) defects such as those shown in Figure 8(a)–(e) are not easy to recognize using computer vision because of the varying areas and perimeters, and (3) the texture on the surface of the camera lens is circular, and circular textures cannot be easily ignored.

Different types of defects: (a) spacer ring excess glue, (b) stain on spacer ring, (c) crack, (d) bright dot defects, and (e) scratch.
According to these findings, we develop an efficient defect detection method for a compact camera lens using polar transformation and a learning-based classification method. The proposed algorithm can be divided into four steps: (1) locating a circular inspection region, (2) polar coordinate transformations, (3) candidate defect detection, and (4) the SVM classification method. This enables real defects to be identified for an accurate detection result. Figure 9 illustrates the flowchart of the proposed method.

Flowchart of proposed defect detection method for compact camera lens.
Locate inspection region
In Figure 1, the red circle is the region to be inspected. Because the compact camera lens in a testing image is not always at a fixed position, the inspection position of the compact camera lens must be corrected for a precise detection result. A circle Hough transform 14 is applied to locate the camera lens. An edge point (x, y) can be viewed as a point on a circle with a center (a, b) and radius r

Since the radius r of the compact camera lens is already known, therefore, we can transform the Euclidean coordinator space (x, y) into the parameter space (a, b, r) using the above equation. Each point in the Euclidean space generates a circle in the parameter space. The expected center point (a, b) of the circle is a common point of intersection for all parameter circles. Before circle Hough transform is performed to locate the inspection region, the canny edge detection method 15 is applied to detect edge points.
Convert to rectangular inspection region
As mentioned, circular textures exist in the circular inspection region. The existence of a circular texture affects the accuracy of the detection result because of the complexity of a gradient with vertical and horizontal gradients simultaneously. If the circular inspection region can be converted into a rectangular one, the defect detection problem can be substantially reduced, and a real defect can be easily detected. The center point (a, b) and radius r of the inspection region are known from the previous step; this information can then be used to convert the circular region into a rectangular region for further defect detection. The equation for converting between Cartesian and polar coordinates 16 is defined as follows

where (x, y) is the position in the circular inspection region and the range of

A demonstration of convert Cartesian coordinate system into polar coordinate system.

A rectangle inspection region which is converted from the circular inspection region in Figure 1.
Candidate defective regions extraction
Noise reduction
In Figure 11, we observe that small noisy regions exist in the testing image. According to the manufacturer’s specifications, the areas of regions that are smaller than 0.01 mm can be ignored when the magnification is 20 diameters. To filter out these noise regions, we simply use a

where L is input image and W is a

Smoothing result after median filter.
Weighted edge detection
Using polar coordinate transformation, a circular texture is converted into a horizontal texture. To suppress the effect of a horizontal texture, we apply a weighting strategy to the Sobel filter. 17 We add two weights, Wx and Wy, to the vertical and horizontal components of the gradient, respectively. The response WG(x, y) of the weighted Sobel filter is

where Gx and Gy are the horizontal and vertical components of the gradient of the input image, respectively. We compare three weighting conditions: (1) Gx and Gy are both 1; (2) Gx and Gy are 0.9 and 0.1, respectively; and (3) Gx and Gy are 0.1 and 0.9, respectively. Figure 13 shows the corresponding filtering results. The results of the traditional Sobel filter show both horizontal and vertical gradients, and most textures are noted as being horizontal, as mentioned. To verify this finding, the weights of the horizontal and vertical components are adjusted, and the results are shown in Figure 13(b) and (c), respectively. In Figure 13(b), defects are difficult to recognize because of the complex gradient map. Compared with Figure 13(a) and (b), defects are more traceable in Figure 13(c).

Weighted Sobel filter: (a) traditional Sobel filter, Gx and Gy are both 1; (b) enhanced horizontal component, Gx is 0.9 and Gy is 0.1; and (c) enhanced vertical component, Gx is 0.1 and Gy is 0.9.
Thresholding
Many small and narrow edges remain in the gradient image, as shown in Figure 13(c), and these edges are too small to be defects. We seek to remove these noise-like edges and fill the holes in no noise-like regions. For this purpose, we apply morphological operations, opening and closing, to the proposed method. The opening and closing operations are combination of erosion and dilation operation. So before we demonstrate the closing and opening operation, we introduce the erosion and dilation operation. Let A be the image with size
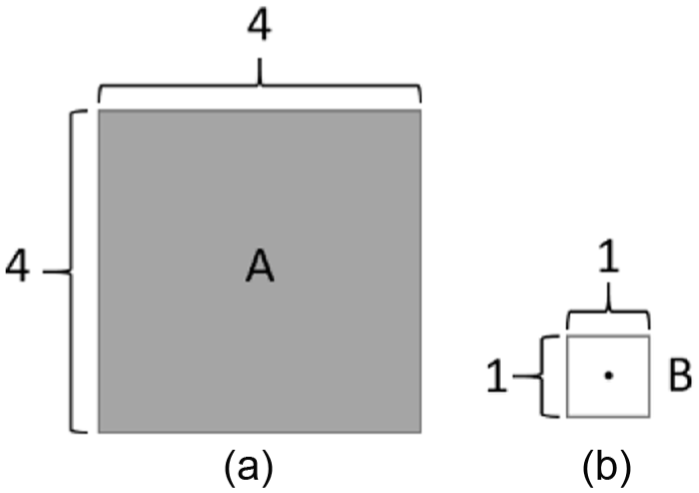
Image and element: (a) the image A and (b) the structure element B.
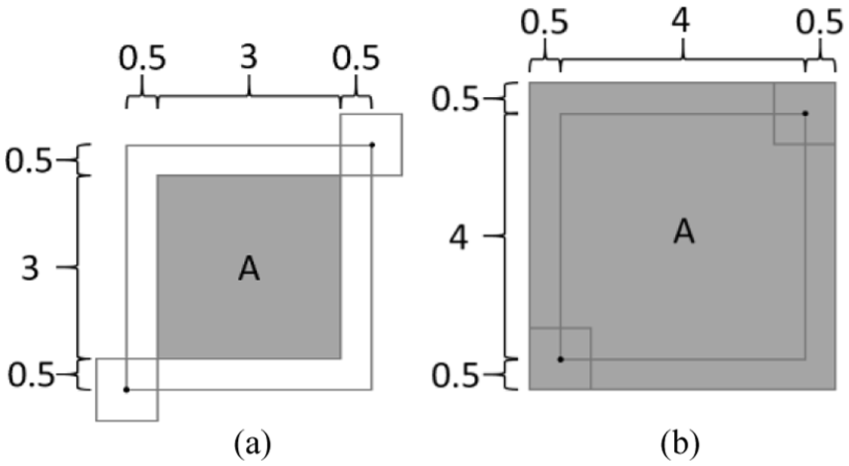
Morphological operation: (a) erosion operation and (b) dilation operation.
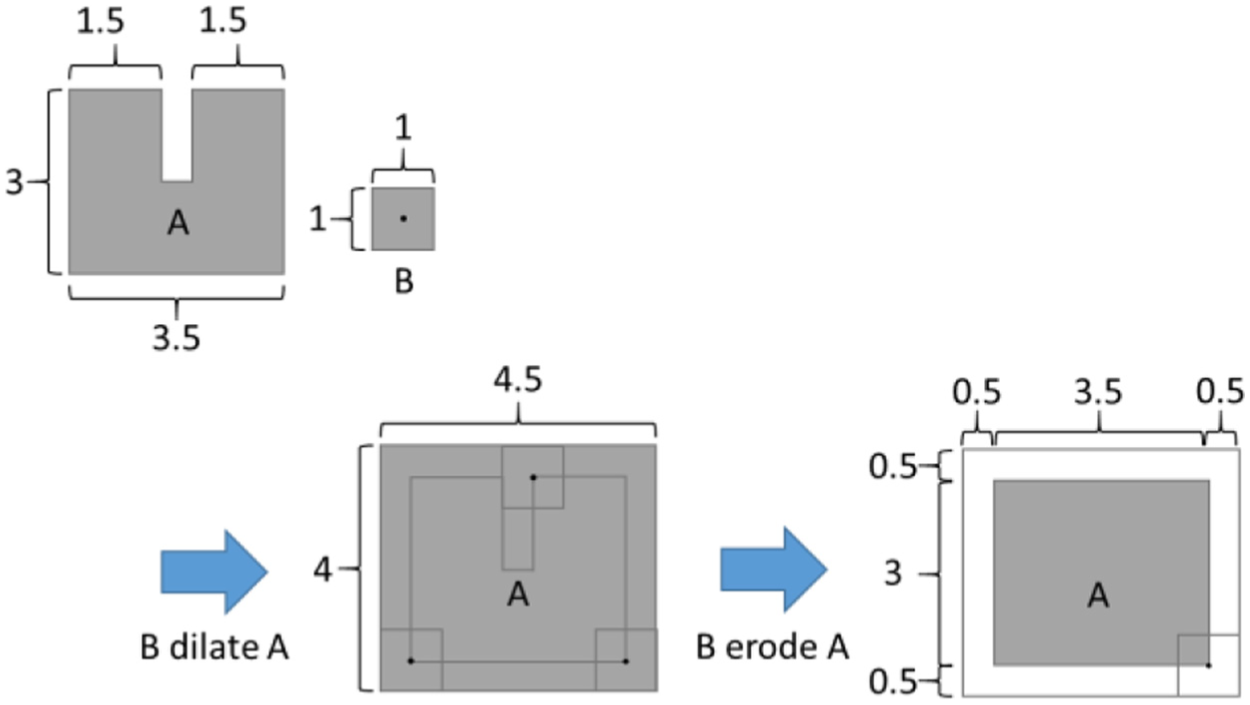
The demonstration of closing operation.

The demonstration of opening operation.
Owe to the help of opening and closing operations, the noise-like edges were removed successfully, as shown in Figure 18.

The intermediate result after morphological operation opening and closing.
After the noise-like edges are removed, to enhance the remaining edge regions and remove small gradient edges, we apply a thresholding method. Although we cannot see the small magnification of gradient in Figure 18. But in Figure 19, we can observe the distribution of the gradient value, and small gradient values remain in the gradient image. However, computing the threshold using these small gradient values may result in an unexpected threshold because of the large number of small gradient values. Therefore, in this step, only larger gradient values are considered candidate defects, because defects always accompany a high contrast in the local region. Accordingly, we can ensure that small gradient values do not affect the calculation of the threshold. The threshold T is defined as

where

where I is input image and

Corresponding histogram of Figure 18.

Result of thresholding method.
Segmentation
To identify the location of the candidate defective region, we apply the watershed segmentation method to extract the candidate position. Before segmentation, we connect the nearby regions using the morphological operation of dilation. The idea is that if the distance to nearby candidate regions is too small, these candidates belong to the same candidate defective region. Figure 21 shows the result of the morphological operation. We locate the centroid points of each candidate defective region by averaging all coordinates of the pixel in a defective region. Each centroid point is used as a seed for the watershed segmentation method. Figure 22 shows the segmentation result. Comparing the defective regions between Figures 21 and 22 reveals that the sunken part of the defective region is filled by the proposed segmentation method, as shown in Figure 22. This can aid us in extracting more precise information about candidate defects for the classification step.

Detected candidate defects.

Result of watershed segmentation method.
Features extraction and classification
While the candidate defective regions were detected, we extracted the features from the candidate defective regions for recognition of real defect regions using the SVM classification method. 18 The original SVM is designed for binary classification problems. The main idea of SVM is trying to find the optimal separating hyperplane by maximizing the margin between the hyperplane and the data and thus minimizing the upper bound of the generalization error, as shown in Figure 23. The solid line represents the separating hyperplane, the dotted lines represent the support hyperplanes, triangles and circles represent the training samples that the same class label drawn with the same shape, and the bolder shapes represent the support vectors (SVs).

The schematic diagram of an SVM.
Given the training-data
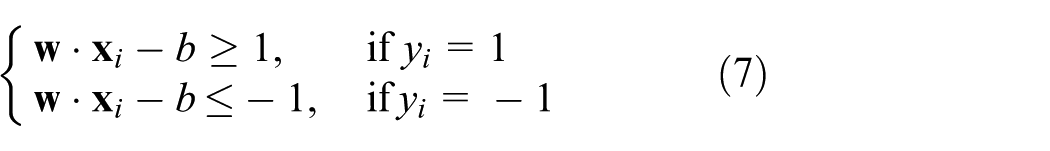
And then we can combine the constraints from equation (7) into one constraint

As we are going to obtain the maximum margin, we can minimize ||

The optimization problem (9) can be solved with Lagrange multiplier method, the solution of this problem as follows

where

In practice, since the real data are often not linearly separable in the original space, the data can be mapped into a higher dimensional feature space by the mapping function
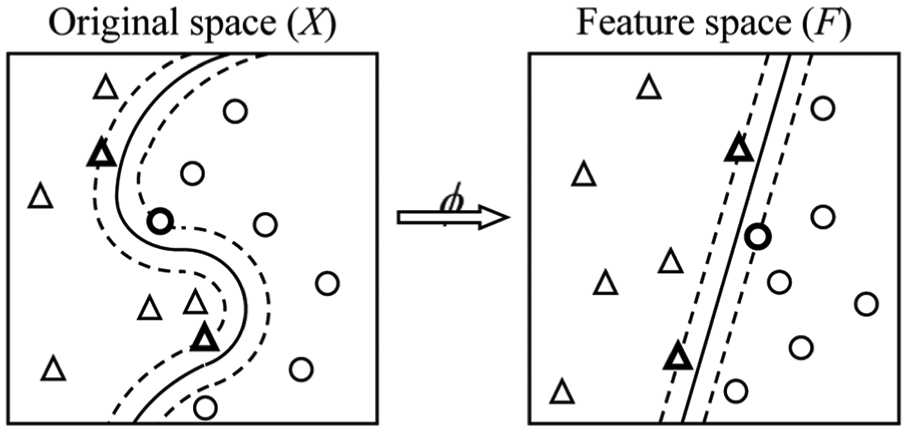
Mapping data from original space into a higher dimensional feature space that can make the data more separable.
After the data have been mapped, we can find a more general separating hyperplane in the feature space. Thus, the decision function (11) can be rewritten as

Because our data are not linearly separable, we apply the RBF kernel function to SVM classifier in our implement. The radial basis function (RBF) is defined as

Before recognizing the defect, we need to extract the features from ground truth image for training because SVM is a supervised learning method. In our implement, the defects in the ground truth images were recognized by human being. We combine the extracted features to form a feature vector. In the training phase of classification step, we collect the feature vectors of defects in ground truth images as inputs for training the SVM classifier. In the testing phase, we extract the candidate defect regions from testing image according to the magnification and direction of gradient. And we estimate the feature vectors from these candidate regions. We use the feature vectors of candidate defect regions as inputs for the SVM predictor, and the predictor will give the predicted defect type include the defect types in Table 1 and non-defective type.
The considerations of extracted features are (1) regarding the position feature


where (x, y) is the position in defective region;

Components of camera lens.

Result of proposed defect detection method.
Experiments and results
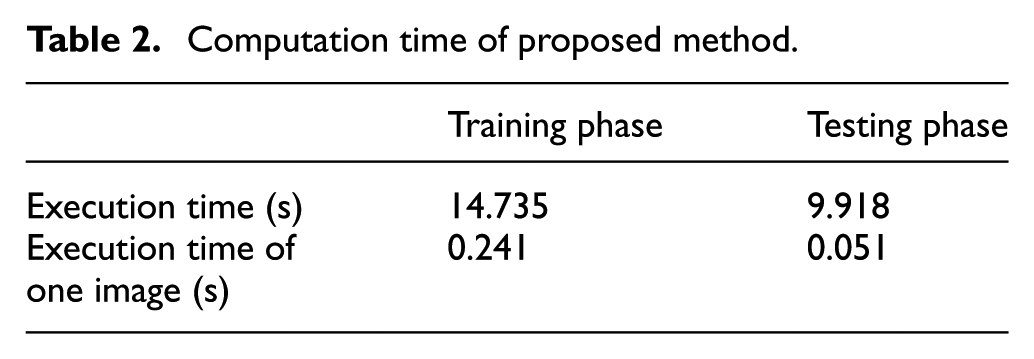
The proposed inspection algorithm was implemented using Visual Studio C++ on a computer with an Intel Core i7 2.67 GHz processor with 4 GB RAM and running the Window 7 operating system. All of our testing images were provided by the manufacturer in Taiwan. The number of testing images was 196, namely 14 bright dot defect images, 70 spacer ring defect images, 54 scratch defect image, 18 lens stain defect images, and 40 normal (non-defective) images. The size of each testing image is

Several defects on a compact camera lens: (a) original image and (b) converted result using polar coordinate transformation and inspection result.
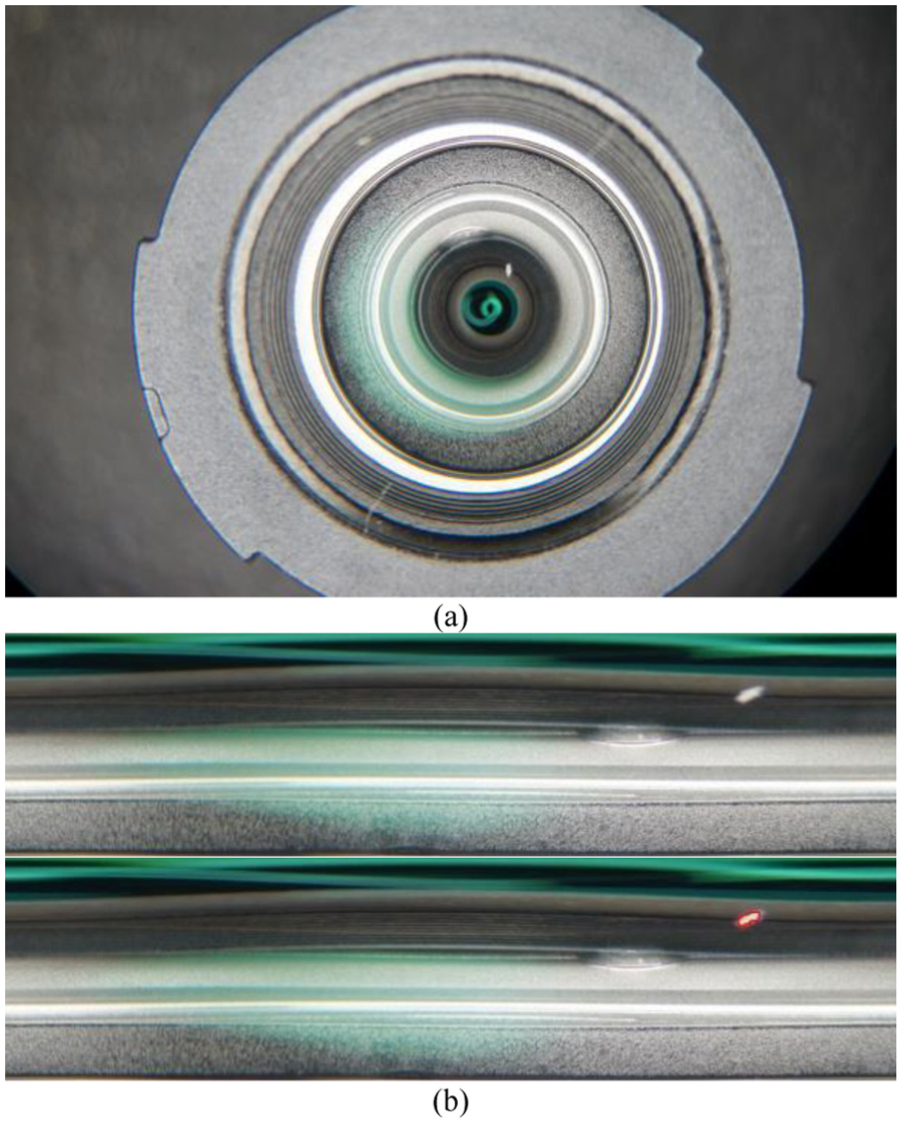
Bright dot defect on a compact camera lens: (a) original image and (b) converted result using polar coordinate transformation and inspection result.

Scratch defect on a compact camera lens: (a) original image and (b) converted result using polar coordinate transformation and inspection result.

Indentation on spacer ring of a compact camera lens: (a) original image and (b) converted result using polar coordinate transformation and inspection result.
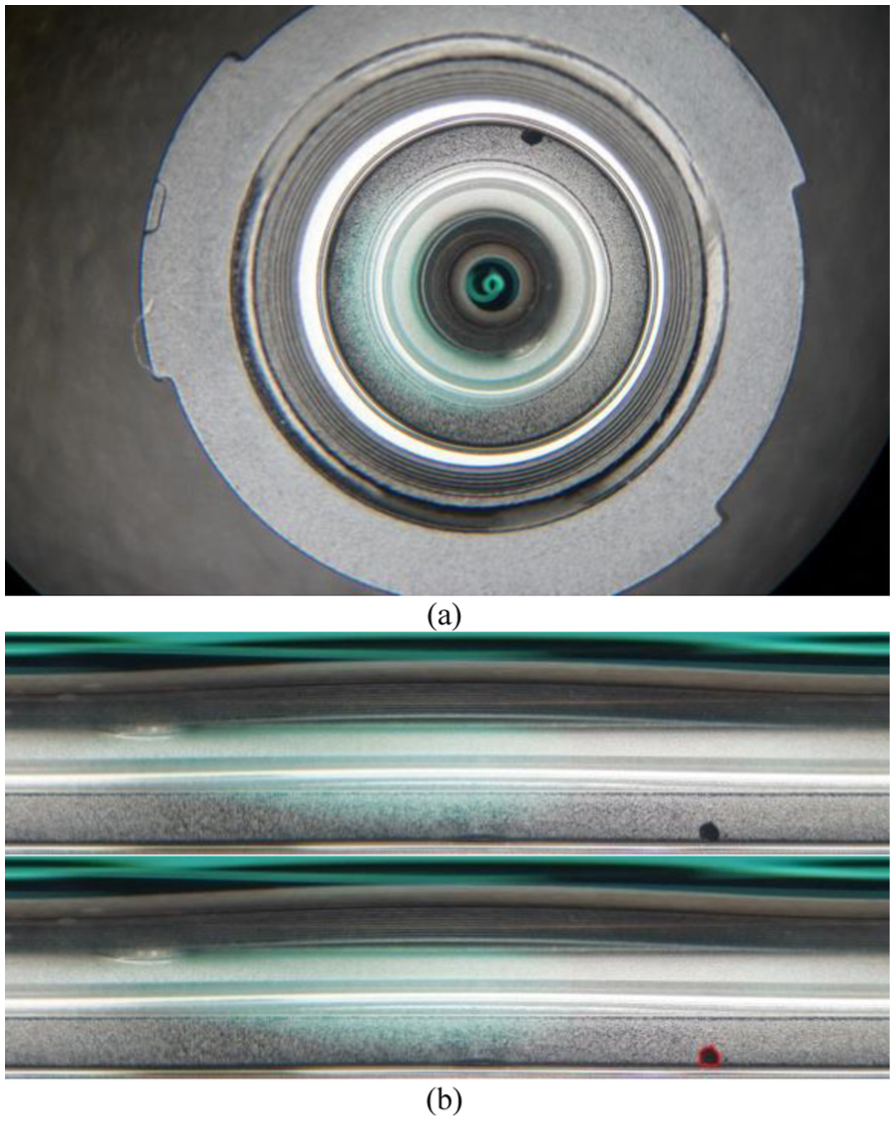
A pit defect on spacer ring: (a) original image and (b) converted result using polar coordinate transformation and inspection result.

Scratch defect on camera lens: (a) original image and (b) converted result using polar coordinate transformation and inspection result.

Dot defect on spacer ring: (a) original image and (b) converted result using polar coordinate transformation and inspection result.

Scar defect on spacer ring: (a) original image and (b) converted result using polar coordinate transformation and inspection result.
Computation time of proposed method.
Tables 3 and 4 are the results of the proposed method using the training and testing data for testing respectively. Each table presents four outcomes that include the true positive (TP), false positive (FP), false negative (FN), and true negative (TN) for different types of defects. If any pixel of defect is detected in testing image, then we consider the testing image is detective one. And if the defect is recognized as wrong type defect, the defect is also view as false negative case.
Statistical measures of the performance of proposed inspection system using training-data for testing, TN rate = 92.31% (12/13).

TP: true positive; FP: false positive; FN: false negative.
Statistical measures of the performance of proposed inspection system using testing-data for testing, TN rate = 92.50% (37/40).

TP: true positive; FP: false positive; FN: false negative.
The accuracy, recall, false alarm, specificity, and missing alarm of the inspection system were evaluated using the following equation 19
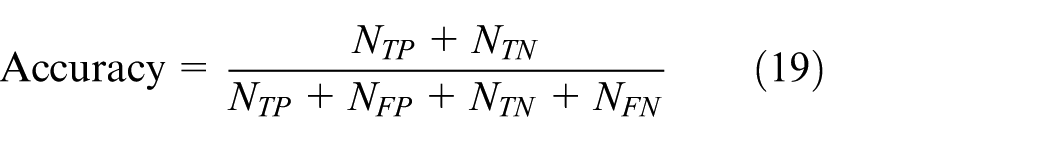
where


Specificity and false alarm are represented as follows


Specificity denotes the rate of non-defective images which are recognized as non-defective images and the false alarm denotes the number of normal images which are recognized as defective images relative to the total normal images. To verify the proposed method, we apply several classifiers to compare the performance, as presented in Table 4 and Table 5. The classifiers include k nearest neighbor (kNN) classifier and artificial neural network (ANN) classifier. The kNN classifier chooses top k similar objects and then uses top k objects to decide the class of test data. The main idea of the ANN is to solve problems like the human brain would. The parameter k is determined by experience.
The comparisons of classifier include SVM, kNN, and ANN (using training image for testing).

SVM: support vector machine; kNN: k nearest neighbor; ANN: artificial neural network.
Tables 4 and 5 show the performance of the proposed inspection method. We applied two strategies for experiment. Firstly, we trained the model of classifiers for training images and tested it with training image. The next is we trained the model of classifiers for training images and tested it with testing image. The accuracy, recall, false alarm, specificity, and missing alarm of the proposed inspection method as tested with the training images were 93.44%, 93.75%, 7.69%, 92.31%, and 6.25%, respectively, whereas those tested with the testing images were 91.84%, 91.67%, 7.5%, 92.5%, and 8.33%, respectively. Compared to other classifiers, the proposed inspection method using SVM classifier exhibited high accuracy and recall exceeding 90%, and the false alarm rate was only 7.50% (Table 6).
The comparisons of classifier include SVM, kNN, and ANN (using testing image for testing).
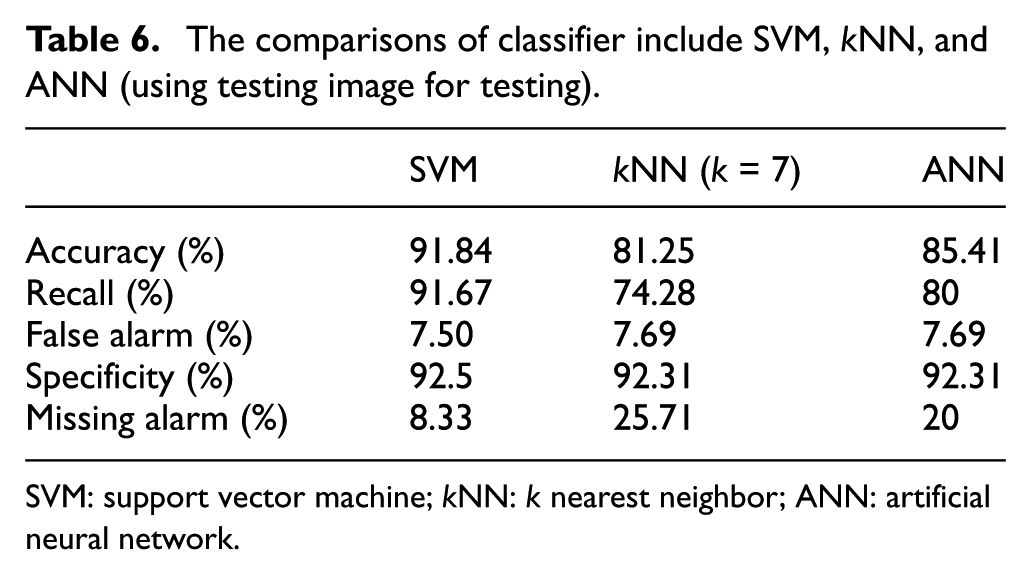
SVM: support vector machine; kNN: k nearest neighbor; ANN: artificial neural network.
Limitation
Figure 35 shows a defective image but our inspection method recognized the image as a non-defective image. To observe Figure 35(c), parts of defective region were detected, but these regions were too sparse to be recognized as defect; therefore, we have a wrong detected result. The failed reason is the defect is blur, as shown in Figure 35(a). A blur region has several characteristics, such as smooth surface and low contract. Usually, a region with low contrast also has small magnification of gradient. Proposed inspection method extracts the candidate regions according to the magnification of gradient. So if the magnification is small, we cannot completely extract the whole defect. This is the limitation of proposed method. According to the suggestion of the engineer of company, the reason of generation of blur defect is the camera focuses inside the glass of lens not focuses on the surface of glass of lens. We consider using the image deblurring technique to preprocess the image for better image quality. Or we consider ask the engineer to help to adjust the focal length of camera for better image capture.

Failed inspection case: (a) original image, (b) rectangular inspection region, and (c) the result of candidate region extraction.
Conclusion
The conventional method directly inspects defects in a circular target region. However, a circular texture affects the accuracy of inspection results because such textures are difficult to ignore. In this article, we propose an inspection method for a circular compact camera lens using a circle Hough transform, polar coordinate transform weighted Sobel filter, and SVM classifier. In our case, the position of the compact camera lens in the testing images is not constant, and it may vary among different testing images. Most textures in the testing images present a circular shape, and removing the texture from the testing image is difficult. In this article, we propose using a circle Hough transformation to locate the inspection region in a compact camera lens. The circular inspection region is converted into a rectangular one to reduce the effect of the circular texture when detecting defects. The SVM classifier can efficiently recognize real defects among the candidate defects; therefore, the proposed method exhibited high performance. The experimental results showed that the proposed inspection method efficiently detected various types of defects. Specifically, the proposed method exhibited high accuracy and recall of 91.3% and 90.17%, respectively, and a low false alarm rate of only 7.5%. However, some defects could not be detected because of their narrow area and low-intensity contrast. To improve the robustness of the proposed method, future research may consider an applied-frequency–based inspection method to detect thinning defects and a proper machine learning method.
Footnotes
Acknowledgements
The authors thank the Kinko Optical Co., Ltd. for providing the defect images of compact camera lens used in the experiments and teaching us the guideline of defect classification.
Academic Editor: Peter Nielsen
Declaration of conflicting interests
The author(s) declared no potential conflicts of interest with respect to the research, authorship, and/or publication of this article.
Funding
The author(s) received no financial support for the research, authorship, and/or publication of this article.