
Abstract
In this article, the numerical simulation of a mechanical mixing process typical of that in water treatment has been performed and optimization of process parameters is achieved. First, the prediction capability of the numerical calculation method is verified through laboratory experiments. Then, the index of turbulence intensity and mixing effect is presented. Finally, optimization of design and operational parameters is carried out based on the maximization of two indices while minimizing power consumption in an actual water treatment plant. The results have shown that the nature of the flow field has a strong influence on the mixing effect. Moreover, the index of turbulence intensity and mixing effect was shown to provide a feasible approach to the optimization of design and operational parameters. For the mechanical accelerated clarifier in the actual water treatment plant, the optimal paddle diameter, submerged depth, and rotational speed were 0.8 m, 1.25 m, and 40 r/min, respectively.
Keywords
Introduction
The clarifier process has a wide range of applicability across water treatment plants of various sizes. The mechanical accelerated clarifier is widely used because of its ability to scale well. As such, the rotation speed of a mechanical accelerated clarifier can be changed based on the quality and quantity of raw water to ensure a satisfactory mixing effect. In addition, the clarifier’s design and operation influences not only the extent of mixing but also the energy consumed by the process.1,2 Thus, the choice of rotation speed, in addition to design parameters, can be optimized to maximize the clarifier’s effect and efficiency. As of now, the engineers greatly depend on the empirical and semi-empirical approach to the design of mechanical accelerated clarifier and other stirred mixing equipment. This is because the average values of the macroscopic flow field are easily calculated. However, it would be best to establish these parameters based on a detailed understanding of the flow field, but this is made difficult due to computational requirements.3,4
In recent years, with the rapid development of numerical calculation theory and improvements in computation speed, the method of turbulence numerical simulation has been increasingly utilized on theoretical research, engineering design, and the operational management of industrial processes. Numerical simulation of mechanical clarifier process not only is important in theoretical research but also has engineering application.5–7 For instance, numerical simulation can aid the optimization of design and operation parameters of mechanical accelerated clarifier.
The objective of this article is to present a new methodology to optimize the design and operational parameters of mechanical mixer using turbulence numerical simulation. The prediction capability of the numerical calculation method was verified through laboratory experiments. Then, many combinations of parameter values were modeled using turbulence numerical simulation. Finally, the methodology was used to optimize an actual mechanical accelerated clarifier in water treatment plant in China.
Validity of numerical simulation method
The Reynolds-Averaged Navier–Stokes (RANS) equations and the renormalization group (RNG) turbulence model were adopted to calculate the flow field in the mixing process by use of the sliding mesh method and the second-order upwind difference scheme.8,9 Fluent integrated in software ANSYS 14.5 is employed to conduct the simulation. Laboratory tests were performed to verify the numerical method as used in this study.10,11
Laboratory stirred tank
The laboratory stirred tank was designed according to the actual mechanical accelerated clarifier with dimensions as displayed in Figure 1. The picture of the laboratory mix tank is shown in Figure 2. And the shaft is rotated counterclockwise at 60 r/min.

Sketch of the laboratory stirred tank (note: the paddle has 45° angle).

Picture of the laboratory stirred tank and the PIV system.
The two-dimensional particle image velocimetry (2D-PIV) system, as shown in Figure 2, was applied for the measurement of flow field of stirred tank. The PIV system consists of a dual Nd:YAG 532 nm pulsed laser (New Wave Research Solo, 200 mJ, 15 Hz), a frame-straddling charge coupled device (CCD) camera (PIVCAM13-8) with a resolution of 2048 × 2048 pixels, a synchronizer, and Dynamic Studio Software (DaVis 7.2). The water in the stirred tank is seeded with tracer particles (Glass Hollow Spheres) of 9–13 μm diameter and density of 1050–1150 kg/m3 which is approximately equal to the density of water. The flow field in the featured plane which is perpendicular with the tank wall is representative, so the laser plane is perpendicular with the tank wall which is shown in Figure 3. The vertical laser plane is deviated from the baffle plane about 0.015 m to avoid the influence of light reflection by baffles, which is shown in Figure 4.

Experimental setup of the 2D-PIV system.

The observation plane of mix tank in PIV experiment.
Comparison between experimental and simulated results
Comparisons of the experimental and simulated results are displayed in Figures 5 and 6. Figure 5 shows the results of flow field in mix tank and Figure 6 shows the velocity comparison between experimental and simulated results along z = 0.25 m. The values of velocity of monitoring points at line 1 and line 2 are shown in Table 1, also root-mean-square (RMS) errors of simulated and experimental results are shown in Table 1.
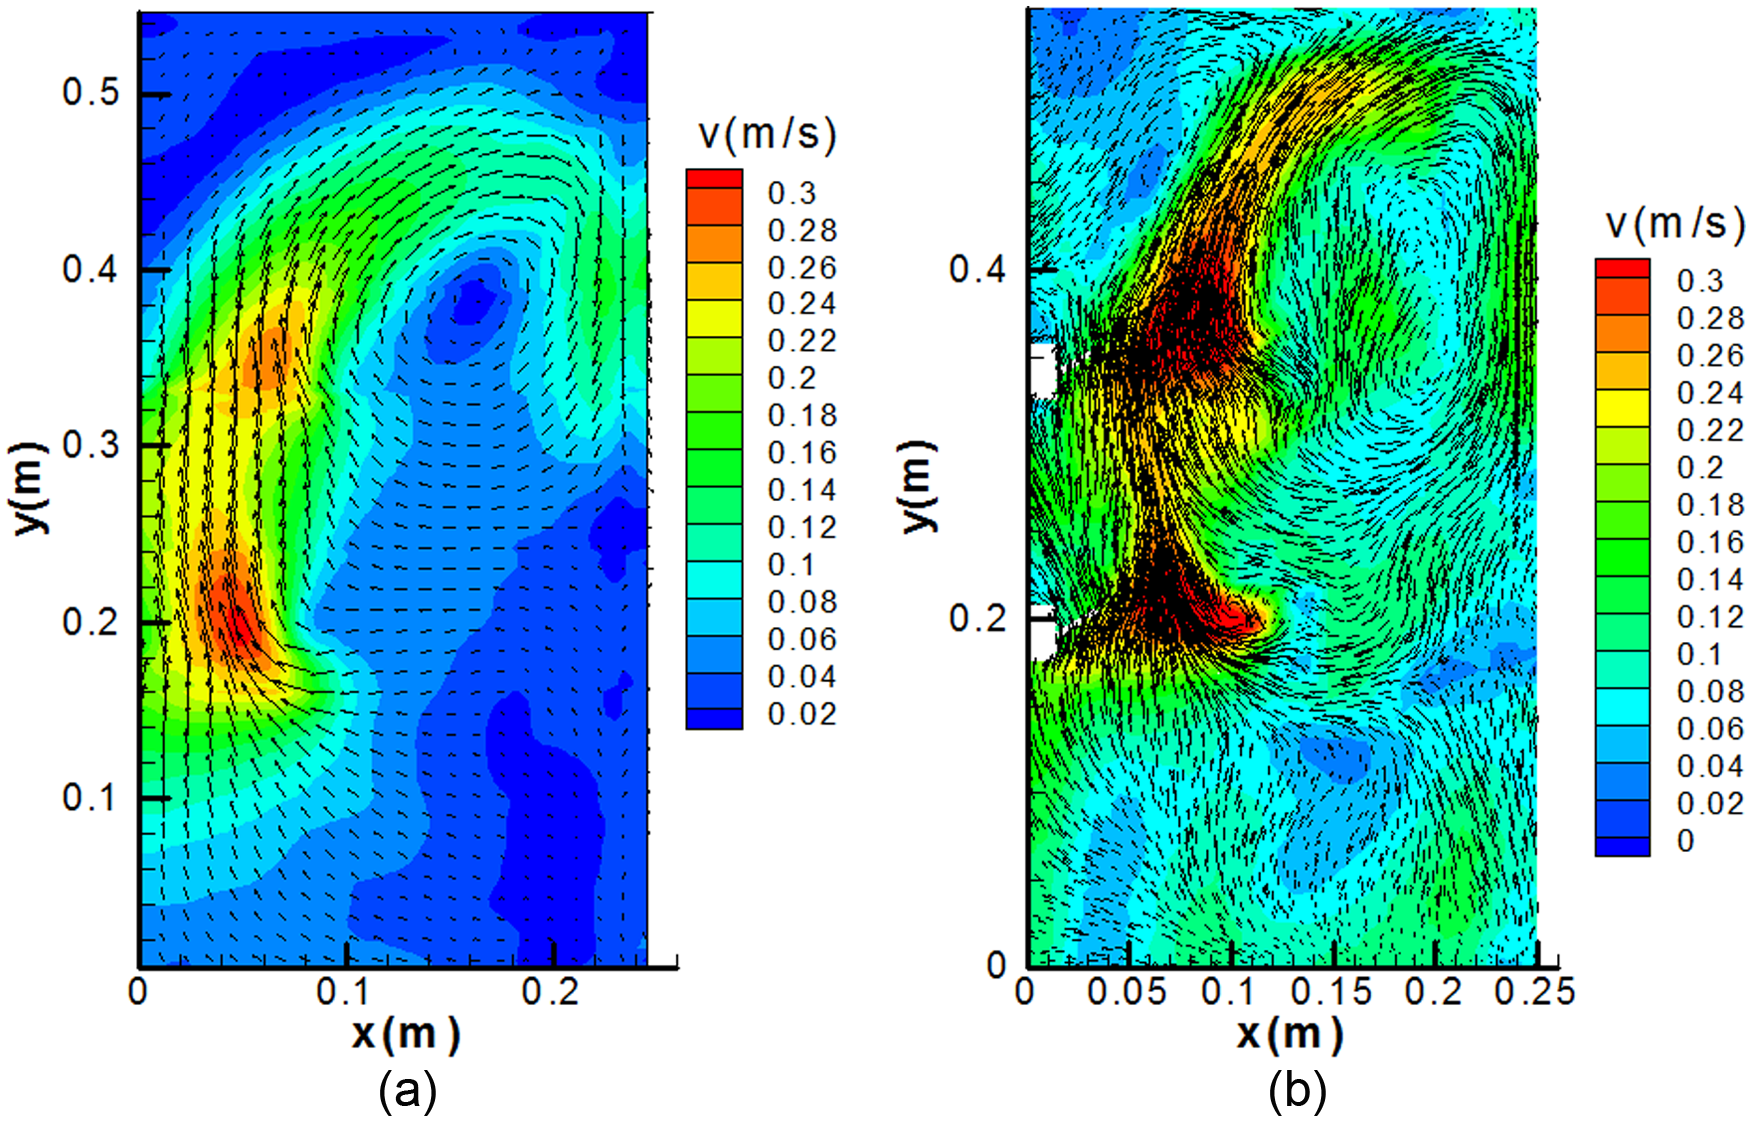
Results of flow field in the mix tank: (a) result of PIV system and (b) result of simulation using RNG turbulent model.

Velocity comparison between experimental and simulated results along z = 0.25 m.
Velocity and relative error.

Both Figures 5 and 6 show that the velocities at the measuring sites have some differences between the simulated and experimental results. The relative error between the simulated and measured velocities along Line 1 and Line 2 was 4.75% and 7.59%, respectively. This error is acceptable;12–14 therefore, the RNG
Indices of turbulence intensity and mixing effect
Two indices are used to describe the performance of the accelerated clarifier. The index of turbulence intensity is related to the hydraulics of the clarifier and was used to indicate the spatial variability of the turbulence within the clarifier. The purpose of the mixing effect index was to measure the performance of the accelerated clarifier. Best performance occurs where the flocculant is distributed uniformly within the clarifier. The more uniform the flocculant concentration, the better the mixing effect. It is realized that the mixing effect will improve as the turbulence intensity improves.15,16 Therefore, a strong correlation between the two indices is expected. The turbulence intensity is calculated according to the following equation 17
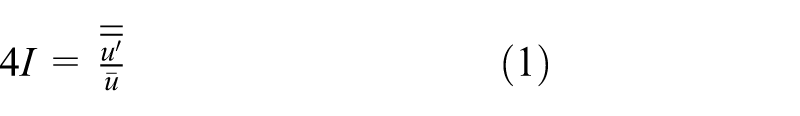
in which, I is the turbulence intensity (%);
Index of turbulence intensity
In order to quantitatively evaluate the uniformity of the turbulence intensity in the flow field, the index is presented based on the RMS deviation as given below 18

In which,
Index of mixing effect
In order to evaluate the mixing uniformity, the index of mixing effect is proposed here. Developed according to the concept of Euclidean distance, 19 the index of mixing effect is defined as follows

In which,
Optimization of parameters
Geometric model and monitoring sites
In this study, the mixing process within an actual mechanical accelerated clarifier was simulated. This clarifier was 2.2 m long, 2.2 m wide, and 4.5 m deep as shown in Figure 7. The water bulk was agitated by vertical-shaft paddles with four 45° blades on two layers. The shaft span between the two-layer blades was 1.4 m. The width and the thickness of the blade were 0.1 and 0.01 m, respectively. There were four baffles on the walls and each baffle was located at 0.8 m above the floor in the center of each wall. The dimensions of the baffle were 2.85 m×0.20 m×0.01 m. The diameter of the shaft was 0.089 m. The shaft was rotated counterclockwise under operation. Three parameters were optimized: the submerged depth of paddle h, the paddle diameter d, and the rotational speed N.

Sketch of the mechanical mix tank (note: the paddle has 45° angle).
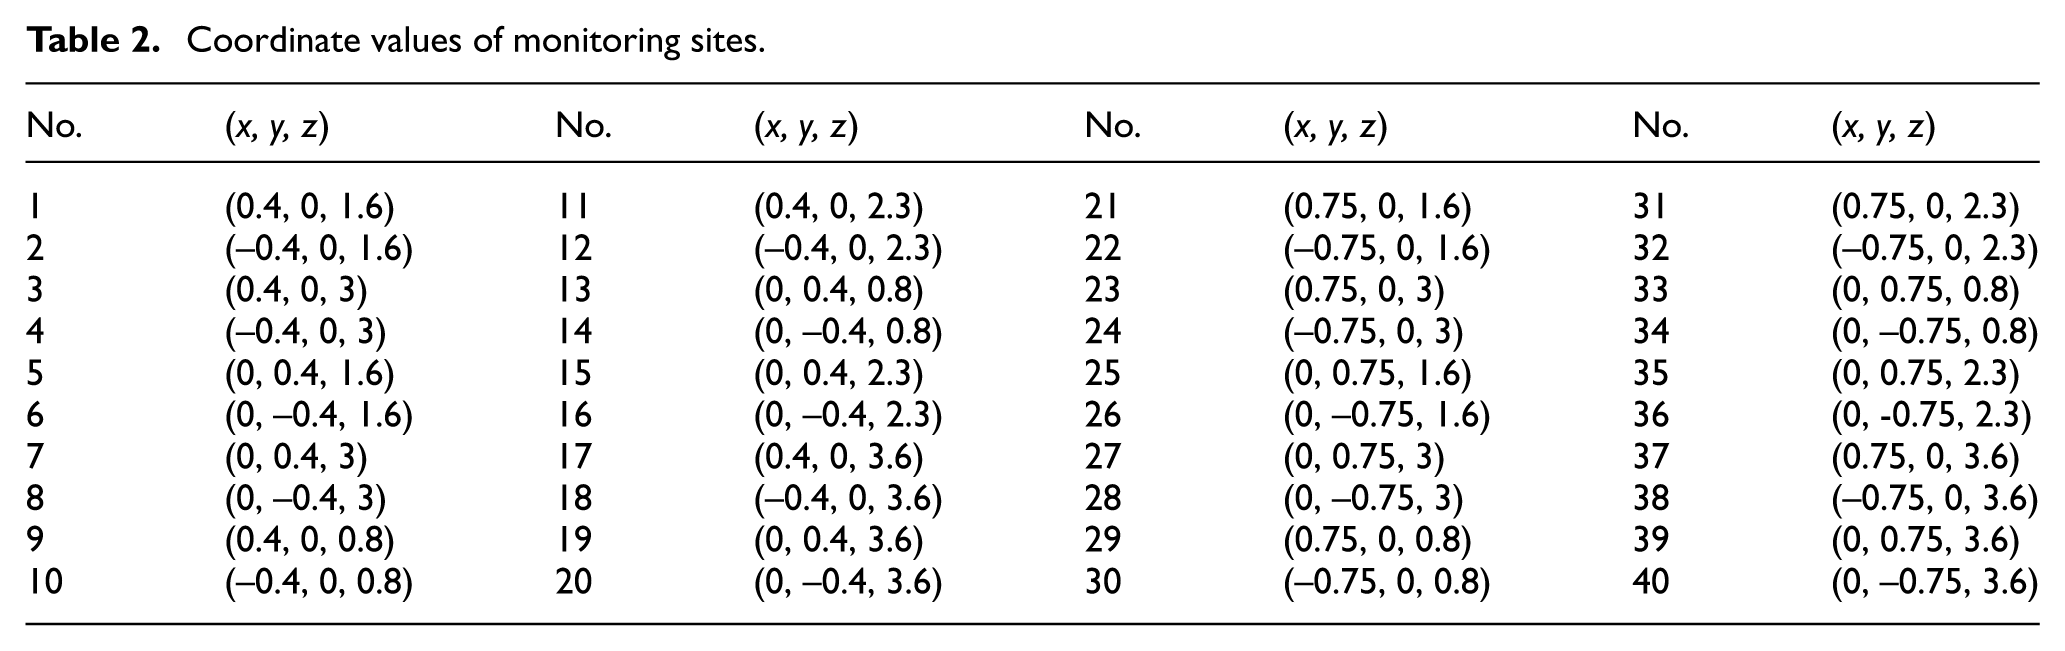
In total, 40 sites were monitored within the numerically simulated accelerated clarifier and displayed in Table 2.
Coordinate values of monitoring sites.
Design and operational parameters of the accelerated clarifier were optimized in order to maximize the indices of the turbulence intensity and the mixing effect while minimizing power consumption.
The power consumption can be calculated by the following equation 20

In which, P is the power consumption of the motor (W); T is the moment of the stirring paddle relative to the stirring axis (N m); N is the rotational speed of the stirring axis (r/min); and
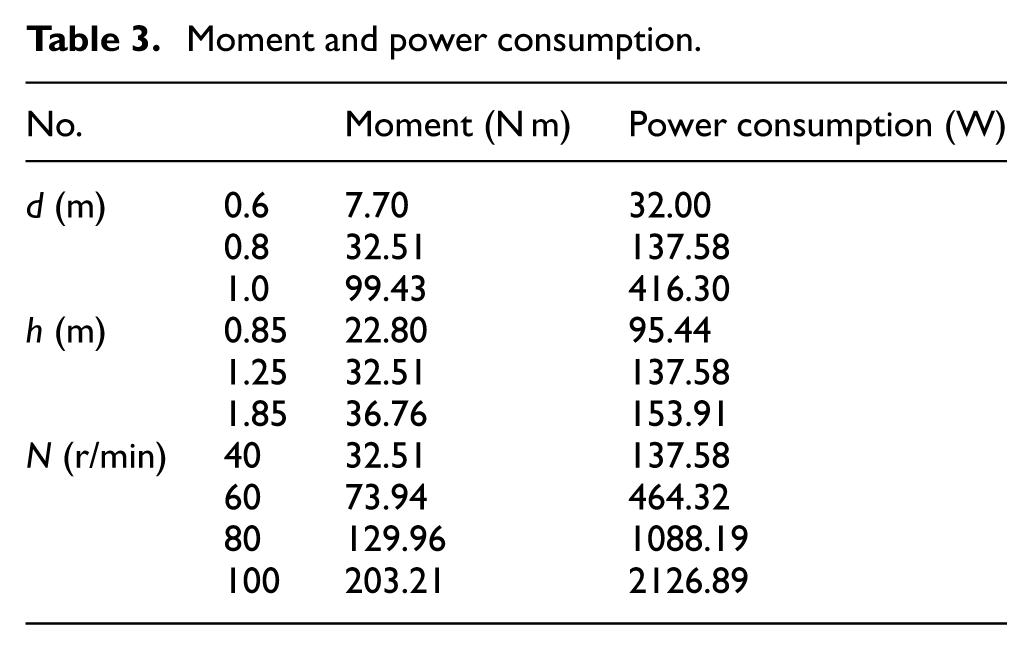
The moment of the stirring paddle was obtained from the numerical simulation, and then, the power consumption was calculated as shown in Table 3.
Moment and power consumption.
Paddle diameter
Under the conditions of N = 40 r/min and h = 1.25 m, the mechanical accelerated clarifier, as shown in Figure 7, was simulated with different paddle diameters of 0.6, 0.8, and 1.0 m, with results compared after the same operating time.
The concentration profiles at t = 15 s are shown in Figure 8. These profiles show that as the paddle diameter becomes bigger, the diffusion rate becomes faster.
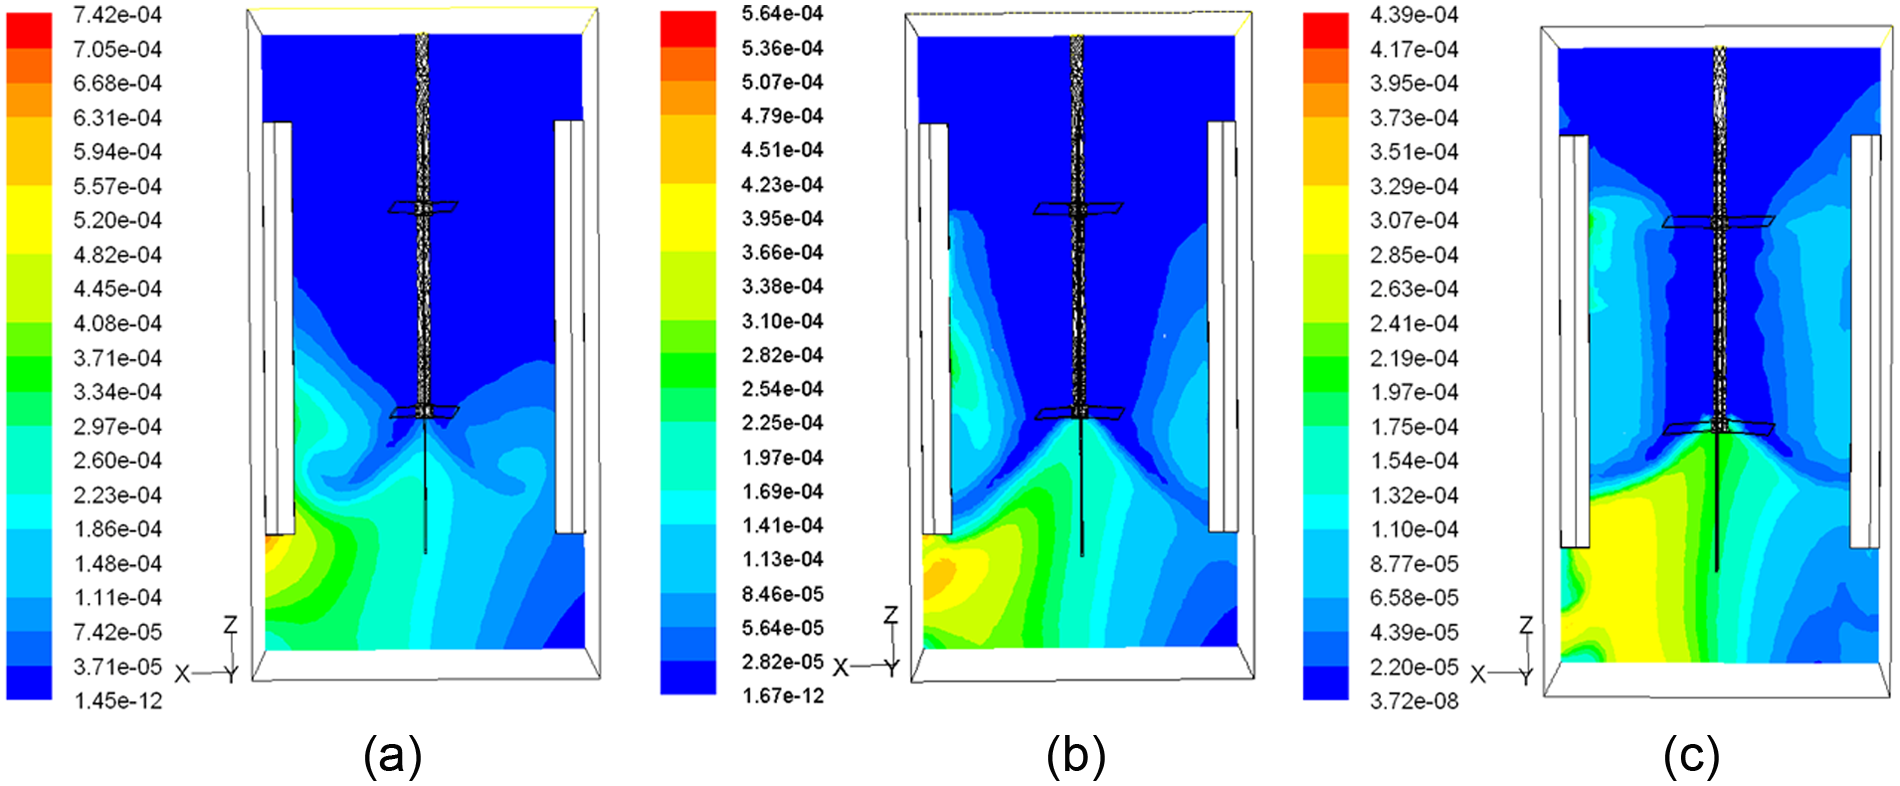
Concentration profiles at t = 15 s with different diameters: (a) d = 0.6 m, (b) d = 0.8 m, and (c) d = 1.0 m.
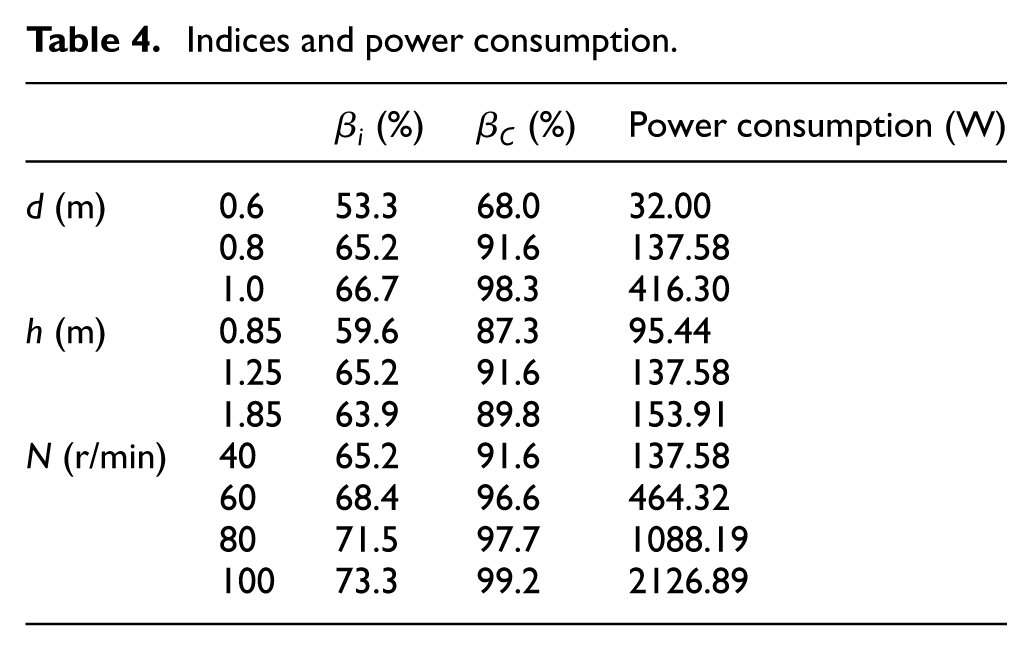
The simulated values of turbulence intensity and concentration at 40 monitoring sites provide the source data for two indices according to equations (2) and (3). Accordingly, the moment is simulated and the power consumption is calculated in each scenario. The results shown in Table 4 indicate that while the turbulence intensity in the scenarios of 0.8 and 1.0 m are similar, they are both larger than the index in the scenario of 0.6 m. However, they all have similar mixing effect values. In addition, the results show that the power consumption when the paddle diameter was 1.0 m greatly increased, as it is proportional to the quintic of the diameter. Therefore, the optimal paddle diameter should be 0.8 m on the consideration of turbulence flow characteristics, mixing effects, and power consumptions.
Indices and power consumption.
Submerged depth of paddle under the surface
Under the conditions of N = 40 r/min and d = 0.8 m, the mechanical accelerated clarifier, as shown in Figure 7, was simulated with the different submerged depths of 0.85, 1.25, and 1.85 m, with results compared after the same operating time. Figure 9 displays the concentration profiles at t = 15 s on central vertical sections in different submerged depths. The results show that the closer the dosing site is to the paddle, the faster the local rate of diffusion is.
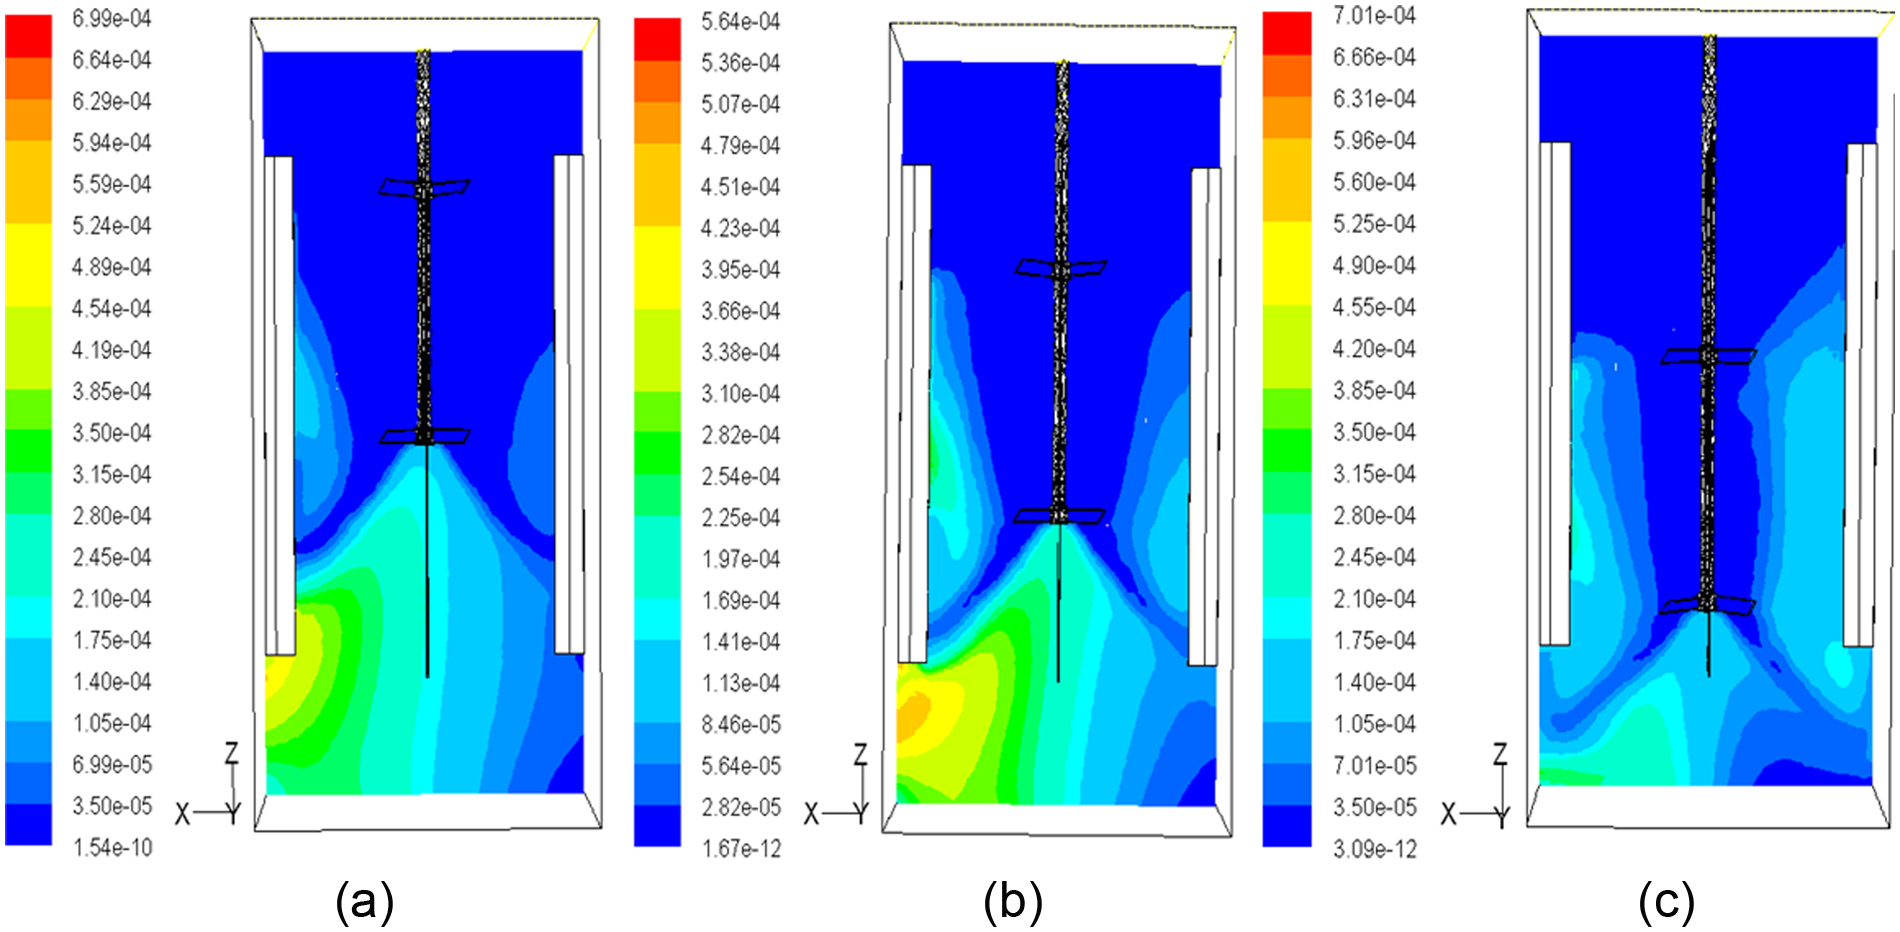
Concentration profiles at t = 15 s with different depths: (a) h = 0.85 m, (b) h = 1.25 m, and (c) h = 1.85 m.
The values of the two indices based on the simulated results at the 40 monitoring sites and the power consumption in each scenario are shown in Table 4. The study has discovered that the submerged depth influences the distribution of turbulence intensity and mixing effect, but has little influence on the magnitude of turbulence intensity and the power consumption. The results in Table 4 show that the optimal submerged depth was 1.25 m in this case.
Rotational speed
Under the conditions of h = 1.25 m and d = 0.8 m, the mechanical accelerated clarifier, as shown in Figure 7, was simulated with the different rotational speeds of 40, 60, 80, and 100 r/min, with results compared after the same operating time.
The simulated concentration at t = 15 s is shown in Figure 10. The simulation results have shown that as the rotational speed becomes faster, the diffusion rate also becomes faster and the concentration field becomes more uniform.

Concentration profile at t = 15 s with different rotational speeds: (a) N = 40 r/min, (b) N = 60 r/min, (c) N = 80 r/min, and (d) N = 100 r/min.
The results of
Conclusion
In this article, the optimization of design and operational parameters for an actual mechanical accelerated clarifier in water treatment factory has been studied and conclusions are drawn as follows. First, the nature of the flow field has a strong influence on the mixing effect. In particular, when the index of turbulence intensity was high, the mixing effect index was also high. Moreover, the index of turbulence intensity and the index of mixing effect were shown to provide a feasible approach to the optimization of design and operational parameters based on the numerical simulation of turbulence flow. In this manner, the mixing effect was optimized while also considering the power consumption. As a result, the optimal paddle diameter, submerged depth, and rotational speed were found to be 0.8 m, 1.25 m, and 40 r/min, respectively.
Footnotes
Academic Editor: Jose Ramon Serrano
Declaration of conflicting interests
The author(s) declared no potential conflicts of interest with respect to the research, authorship, and/or publication of this article.
Funding
The author(s) disclosed receipt of the following financial support for the research, authorship, and/or publication of this article: The paper is financially supported by the Foundation for Distinguished Young Talents in Higher Education of Heilongjiang, China (UNPYSCT-2015072) and National Natural Science Fund of China (No. 51208160).