
Abstract
The acceleration of the melting process of phase change materials caused by buoyancy-driven natural convection has been widely acknowledged, especially for rectangular geometries. This acceleration phenomenon exists in the cases where phase change materials are heated at the bottom boundary or at both upper and bottom boundaries. This article reveals how the melting rate could be affected by changing the orientation of a rectangular phase change material container with a constant temperature boundary. The transient melting processes of lauric acid in a two-dimensional rectangular container with five orientations (θ = 0°, 22.5°, 45°, 67.5°, and 90°) were simulated using the computational fluid dynamics software. The computational fluid dynamics model was validated against available experimental data obtained from published literature. Results show that when the rectangular geometry is rotated from vertical direction (θ = 0°) to horizontal direction (θ = 90°), the total melting time is increased by about five times. For all investigated orientations, the heat transfer rate at the heated boundary is found to first increase at the initial stage (within about 100 min) and then decrease during the following melting process. Moreover, the total amount of thermal storage for the horizontally placed case is slightly lower than the other cases.
Keywords
Introduction
Phase change material (PCM) is capable of absorbing and releasing a considerable amount of energy at a nearly constant temperature. Because of that, thermal energy storage (TES) systems based on the use of PCM are implemented in different engineering fields: solar-assisted systems, 1 free cooling systems, 2 building structures,3,4 active ceiling panels, and cooling technology for electric devices. 5 Some of the applications are seeking for heat transfer enhancement, which can be achieved with proper design and operation parameters: shape and geometry of the container, cavity volume fraction in the PCM container, 6 constrained or unconstrained melting, 7 position of heat source, 8 volumes of nanoparticle copper, 9 the number and geometry of fins, 10 and so on. A number of theoretical and experimental studies have been carried out in these regards.
Because of the difference in physical properties between phases, analytical solution of phase change problem is complex, and very few analytical solutions are available in a closed form. As a result, analytical solutions are only applicable in simple models with simplified assumptions. In early mathematical studies, conduction is considered as the dominant transfer method during the melting and solidification processes of PCMs while the contribution of convection is considered ignorable. The importance of natural convection in phase change process was widely acknowledged since 1970s. 11 With the development of computational hardware, numerical methods using finite element and finite volume method became popular in analyzing complex scenarios. Numerical studies are advantageous in parametric studies as they are able to strictly control the uninterested parameters and are more efficient compared to experimental studies. There are two main methods in numerical studies: the effective heat capacity method and the enthalpy-based method. 12 The former method tracks the solid–liquid interface explicitly while the latter method tracks the interface implicitly. This is because the forms of governing equations are consistent for different phases in the enthalpy-based method, while they are different for solid and liquid phases in the effective heat capacity method. Recently, many researchers use ANSYS Fluent, which applies the enthalpy method that considers the PCM as a mushy zone, to investigate the role of convective heat transfer in phase change problems. The numerical results have been validated against experiments using the same PCM with the same controlled boundary conditions. The simulation results from different numerical schemes, discretizing methods, and mushy zone constants have been compared in a recent review. 13 It is found that with proper parameter setups, the numerical simulation results are adequate to present the heat transfer process of PCM as well as experimental investigation.
Recent studies found that in some cases, especially with large height difference, natural convention induced by temperature difference would become a possible heat transfer enhancement technique 14 or a significant factor affecting the charging and recovering time. This was demonstrated in both numerical and experimental studies considering various kinds of PCM containers.7,15–17 For example, Prieto and González 18 performed a numerical simulation study that investigates the melting processes of PCM in a tall rectangular container under two orientation conditions: vertically and horizontally placed. They found that natural convection developed rapidly and greatly influences heat transfer as well as the motion of the solid–liquid interface. Ye et al. 19 found that temperature differences play a key role in the performance of energy storage when temperature differences are less than 20°C, and a vortex is found near the heat plate wall. Pal and Joshi 20 studied the melting of n-triacontane (Pr = 31.8) in a tall rectangular enclosure with one vertical side wall heated at a constant heat flux. It was found that natural convection plays a dominant role during the initial stage of melting and its impact diminishes as it approaches full melting. Baby and Balaji 9 experimentally evaluated the effect of the inclination angle on the heat transfer enhancement of a porous matrix filled PCM-based heat sink. A remarkable enhancement in heat transfer was obtained by placing the PCM in the porous matrix.
The only existing parametric study in literature on unconstrained melting of PCM with more than two inclination angles was performed by Kamkari et al. 15 They studied a bottom-heated rectangular PCM container’s melting behavior in three inclination angles. The melting time is found to be significantly shortened as the inclination angle increases from 0° (vertical standing) to 90° (horizontally placed), indicating strong heat transfer enhancement caused by natural convection. However, the study of Baby and Balaji, 9 comparing a range of different geometry orientations, showed no significant effect of geometry orientation on melting time. This is possibly due to the restraint on circulation development caused by matrix geometry’s constraint. These efforts are instructive in practical application of PCM.
Even though an acceleration in melting rate induced by convective heat transfer has been revealed, this conclusion might be inappropriate for a few engineering applications. For example, in a PCM-based solar chimney, the amount of heat collected is strongly dependent upon its azimuth. 21 Nevertheless, the orientation of the absorber surface is usually constrained by optimized solar incident angle. Another practical case in point is the PCM-based heat sink used in a photovoltaic (PV)–PCM roof, 22 which contains a layer of PCM, a layer of thermal insulation, and an air cavity with a reflective surface. In this case, PCM is placed on a pitched roof and acts as solar heat sink. So, the overall performance of a PCM-assisted system should weigh between the influence of panel inclination on both heat flux capture and natural convection in melting–solidification process.
Based on the above analysis, the general knowledge on the effect of natural convection on the melting process of PCM should be further extended to scenarios that represent different engineering applications. This work investigates the transient heat transfer behavior and melting rate inside a rectangular PCM container placed at five orientations (θ = 0°, 22.5°, 45°, 67.5°, and 90°) with a constant temperature boundary. The PCM used is lauric acid with a phase change temperature of 43.5°C, which is used in previous experiments performed by Kamkari and colleagues.15,23 The development of liquid fraction as well as the location of solid–liquid interface has been compared. The heat transfer rate at the heated boundary as well as the thermal storage of each inclination case is investigated. Furthermore, the natural convection intensity inside the computation domain is analyzed using the maximum velocity captured at different stages of the melting processes.
Methodology
Physical model and orientation scenarios
As shown in Figure 1, the two-dimensional (2D) calculation domain is a rectangular geometry representing an intersection of the three-dimensional (3D) container used in experiments in literature, with a dimension of 50 mm in width and 120 mm in height. This geometry is chosen because of convenience in model validation. The figure also shows the variables and boundary conditions: the left boundary of the geometry is set at a constant temperature of 70°C, while the other three sides are considered adiabatic as they are well insulated in the experiments. As an initial condition, the PCM temperature is assumed constant at 26°C, also in consistent with literature. 15 To compare a series of orientations, the basic reference orientation is when the rectangular container is standing vertically, where the inclination angle θ = 0°. The inclination angle θ represents how much the rectangular geometry is rotated from a vertically standing position. Five simulations were performed for inclination angles θ of 0°, 67.5°, 45°, 22.5°, and 90° (referred to as the 0°, 22.5°, 45°, 67.5°, and 90° cases hereafter).

Computational domain, boundary conditions, and direction of rotation.
Governing equations
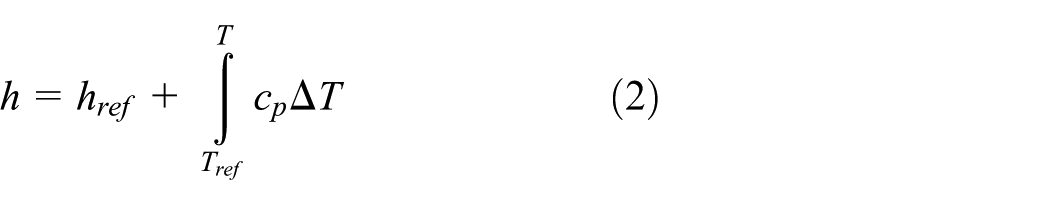
The melting process is solved in ANSYS Fluent using the enthalpy-porosity technique. 24 In this method, the liquid fraction is computed based on enthalpy balance in a “mushy zone,” which is a region where the liquid fraction lies between 0 and 1. The mushy zone is modeled as a “pseudo” porous medium in which the porosity increases from 0 for solid state to 1 for liquid state. The energy equation is expressed as 13

where ρ is the density of PCM, in kg/m3;

where
The liquid fraction γ that occurs during the phase change between the solid state and liquid state is calculated as 13


where L is the latent heat, in J/kg;
The source term S (in N/m3) in momentum equation is Darcy’s law damping term added to the momentum equation due to phase change effect on convection, which is defined as 25

where ε = 0.001 is a small computational constant used to avoid division by zero, and C is the mushy zone constant which describes the kinetic process in the mushy zone. A previous parametric study 26 has discussed the influence of C on the melting process of PCM by comparing the simulation results using three values of C, namely, 105, 106, and 107, to the experimental results in Shokouhmand and Kamkari. 23 Result shows that out of three compared options, with a mushy zone constant of 106, the melt interface curvature of lauric acid correlates well with experimental results up to an elapse time of 60 min. Although the solid PCM shape begins to square off near the final stages of the simulation, the prediction of the total melting time is reasonable. So, in this study, the mushy zone constant C has been set as 106.
Physical properties
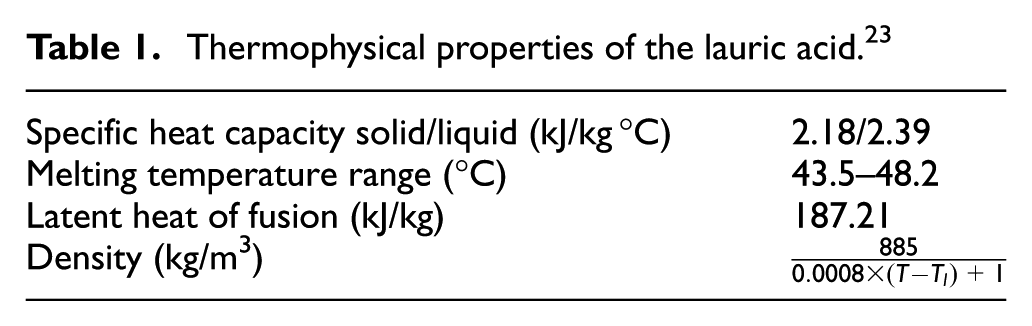
Kamkari et al. 15 carried out an experiment comparing the flow characteristics in PCM melting process for three different inclination scenarios. The temperature and liquid fraction data of the melting process of lauric acid have been used to validate the proposed numerical model. The thermophysical properties of the lauric acid are listed in Table 1. Physical properties of PCM change with temperature and can be set in ANSYS Fluent with polynomial, piecewise-linear, or piecewise-polynomial functions. The conductivity is set up using piecewise-linear function as per Shokouhmand et al., 23 which is listed in Table 2; the density’s dependency on temperature is expressed with Boussinesq model, which simplifies the change in density using a thermal expansion coefficient γ. This method was used in Ye et al.; 19 the thermal expansion coefficient γ is 0.001°C−1, which is calculated based on volume expansion measured in experiments15,27
Thermophysical properties of the lauric acid. 23
Variation of thermal conductivity of the lauric acid with temperature. 23


where
The dynamic viscosity of PCM decreases as temperature increases and can be implemented as a modified viscosity to guarantee a good convergence 26


where
Numerical solution setup
The simulations were performed using the pressure-based model, which is suitable for the melting and solidification model in ANSYS Fluent. Referring to a recent review 13 that compared a series of schemes used in PCM applications, a second-order upwind discretization scheme was used to solve the momentum and energy equations; the PRESTO scheme was selected for the pressure correction equation; and the semi-implicit method for pressure-linked equations (SIMPLE) algorithm was used for the pressure–velocity coupling. The time step is 0.5 s, with a maximum of 250 iterations being performed along the entire domain for each time step. The convergence criterion for the scaled residuals was set to 10−5 for continuity equation, 10−6 momentum equation, and 10−8 for energy equation.
Square geometry is the most often studied geometry in latent heat storage process simulation, and the proper cell allocation for the numerical simulations can be referred from literature. 18 The grid size and time step have been tested, and finally, a final mesh with the number of cells, 70 for vertical sides and 100 for horizontal sides, was used.
Numerical model validation
The numerical model validation is carried out by comparing numerical prediction of liquid fraction with the experimental results proposed by Kamkari et al. 15 This experiment investigated the whole melting process of lauric acid in a 3D rectangular container with the right-side (downside when rotated to horizontally placed) wall maintained at 70°C and the other three walls well insulated. In their experimental testing, temperatures were measured at an array of points on a vertical slice at the center of the container, as depicted in Figure 1. The dimension of the vertical slice is consistent with the physical model used in our numerical study. Figure 2 shows the time-dependent variation of liquid fraction for three orientation cases (θ = 0°(vertically placed), 45°, and 90°(horizontally placed); it should be noted that in the experimental test by Kamkari et al., 15 inclination angle θ = 0° when container is horizontally placed). The current model sufficiently predicts the melt fraction at different melting stages for each orientation case. The 90° (horizontally placed) and 45° cases are very well simulated while there is a little divergence from the experimental result for the 0°(vertically placed) case. Overall, the melting time of each case is well estimated.
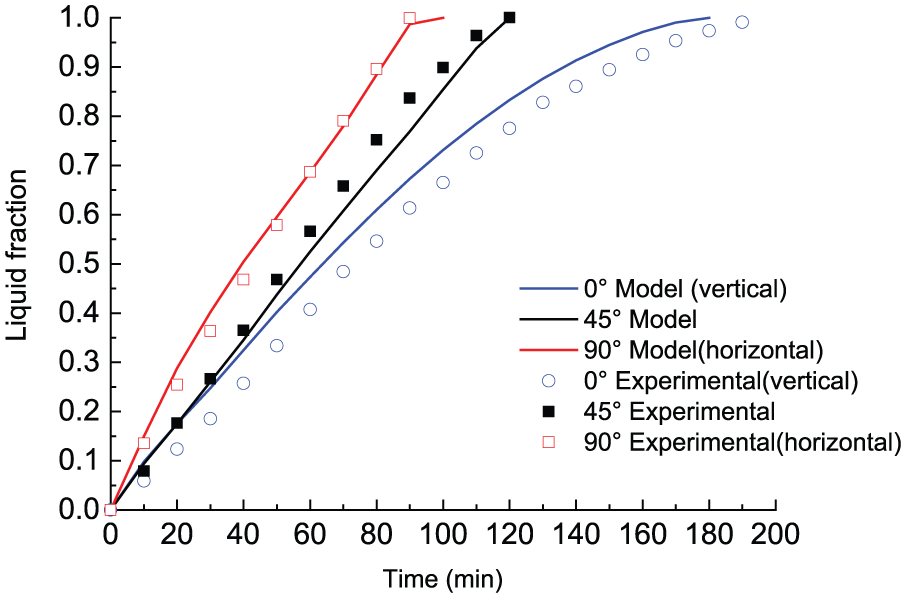
Comparison of numerical and experimental results of liquid fraction at different melting stages (θ = 0°(vertically placed), 45°, and 90°(horizontally placed)).
Results and discussion
This section presents detailed analysis on the development of liquid–solid interface, melt fraction, temperature distribution, and thermal storage of the PCM for the total melting processes.
Progress of the solid–liquid interface
The progress of the position of solid–liquid interface was analyzed as time progresses. The contours of liquid fraction at different melting stages for different orientation cases (θ = 0°, 22.5°, 45°, 67.5°, and 90°) are depicted in Figure 3(a)–(e). At the initial melting stage (within 10 min), a thin layer of liquid PCM is found almost parallel to the heated boundary, which corresponds to the experimental results of Kamkari et al. 15 At 20 min, for all the cases except the 90°, the liquid fraction at the upper part of the container overweighs that at the lower part. As time progresses, a concave curvature emerges at the upper part of the solid–liquid interface, while the lower part interface remains almost linear. However, the tilt of the lower melting front increases along with the melting process. Moreover, as the orientation changes from the 0° case to the 90° case, the degree of the concave curvature decreases. A few previous numerical and experimental studies3,18,23 have also discussed the cause of the concave curvatures that occurs in the 0° case. It is mainly due to a trend of recirculation occurring at the top part because of temperature difference induced density difference. As the PCM adjacent to the hot wall boundary melts, a clockwise circulation occurs because the liquid PCM releases energy at the solid–liquid interface, and this results in temperature difference between the left side and right side of the liquid PCM. At the same time, higher temperature liquid ascends and accumulates at the upper part of the geometry, and the overall temperature at the upper part is higher compared to the lower part, thus the solid PCM at the upper part melts faster and a concave curvature emerges.

Contours of liquid fraction and solid–liquid interface distribution at different melting stages for the five orientation cases: θ = 0°, θ = 22.5°, θ = 45°, θ = 67.5°, and θ = 90° (from left to right).
As for the 90° case, as depicted in Figure 3(e), unlike those experimental and numerical studies where PCM was heated at the bottom side of the geometry,3,18,23 the liquid fraction contours at all the melting stages show no signs of Bénard cells or cellular flow. 15 The solid–liquid interface remains as a straight line throughout the whole melting process. This is probably because there is no temperature difference between the left side and right side of the PCM liquid and high-temperature liquid PCM accumulates at the top of the geometry, which further restrains the movement of liquid PCM.
Melting rate of PCM
The overall melting rate of the PCM for different orientation cases is investigated in this section. As the liquid fraction of each computational cell in the grid is supposed to range from 0.0 to 1.0, the overall liquid fraction of the PCM domain is represented by the area-weighted averages of liquid fraction for all cells. Figure 4 illustrates the history of liquid fraction for each orientation case, and the slope of each line reveals the melting rate of PCM. It can be seen that the fastest melting rate occurs in the 0° case, that is, when the rectangular geometry is placed vertically. For 0°, 22.5°, 45°, and 67.5° cases, the melting rate is nearly consistent, though slightly slower than that of the 0° case during initial melting stage, within about 100 min of time. Then, the melting rate significantly slows down after the initial stage and keeps at a slow rate until the PCM is totally melted. Unlike the other cases, the 90° case shows an almost consistent melting rate throughout the melting process except for the initial 50 min, and the overall melting rate is much slower than the initial melting rate in the other cases and resembles the later stage melting rate of the 22.5°, 45°, and 67.5° cases.

History of liquid fraction throughout the melting process for each orientation case (θ = 0°, 22.5°, 45°, 67.5°, 90°).
Table 3 further concludes the melting time needed for a series of melt fractions, namely, 20%, 50%, 90%, and 100%. The total time needed for complete melting is 2.9, 4.8, 9.0, 12.8, and 18.0 h for the 0°, 22.5°, 45°, 67.5°, and 90° cases, respectively. The total melting time increases monotonically as the geometry is rotated from 0° to 90°, which is in line with the conclusions of Baby and Balaji, 9 where the effect of geometry orientation on melting time was studied with a porous matrix filled PCM-based heat sink. However, our results reveal a much bigger difference in the total melting time compared to the findings in Baby and Balaji, 9 where PCM showed no significant effect of geometry orientation on melting time. This is probably because, in their study, PCM was constrained in porous matrix and the natural convective heat transfer had been restrained.
Melting time (h) needed before reaching a specific melt fraction for different orientation cases.
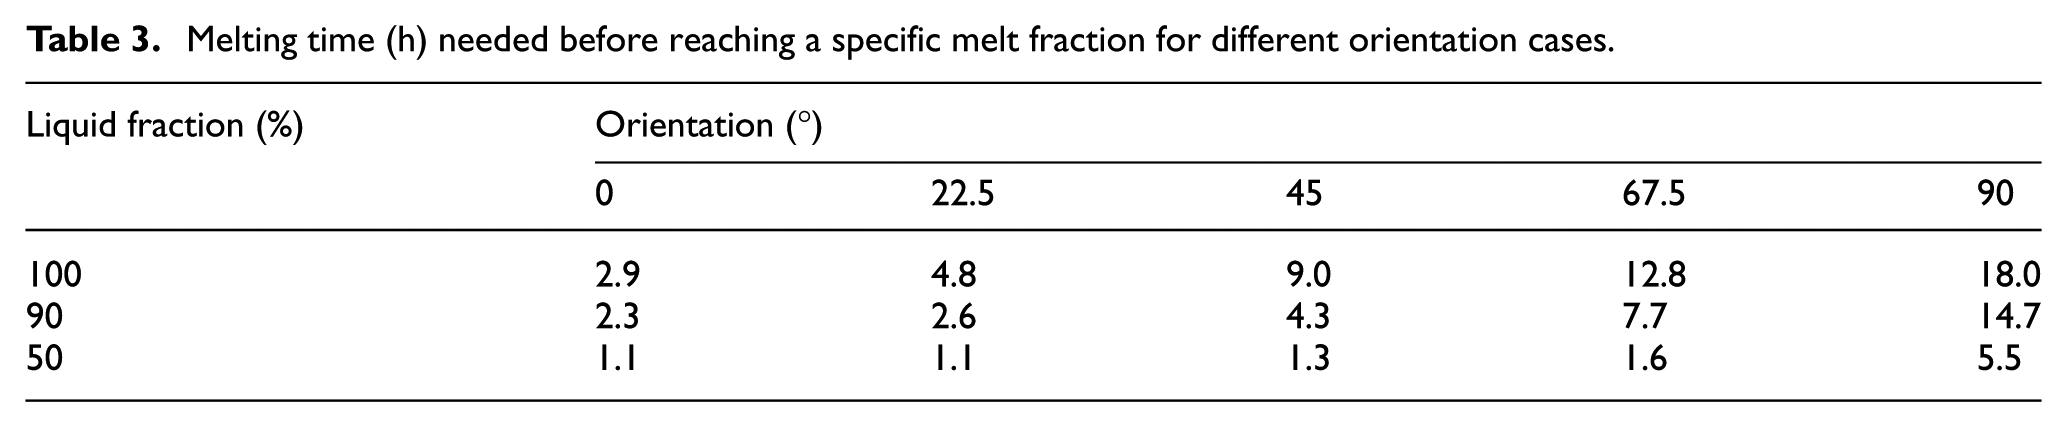
For the melt fraction of 90%, the 0° case and 22.5° case need almost the same time. For a melt fraction of 50%, the 0° and 22.5° cases need the same amount of time, and compared to 0° and 22.5° cases, the 45° and 67.5° cases need 18% and 45% more time while the 90° case needs five times more time.
Development of PCM temperature
Figure 5 depicts the contours of temperature distribution in the enclosure at different melting stages for different orientations. Overall, temperature at the upper side is higher than at the lower side. The phenomenon of stratification is more significant in smaller degree cases. It should be noted that for the 90° case, at t = 80 min, the fraction of high temperature (above 50°C) is much smaller compared to the experimental study by Kamkari et al., 15 when the heating boundary is at the lower side of the enclosure.

Contours of temperature (°C) distribution at different melting stages for the five orientation cases.
Figure 6 compares the model-predicted temperature evolution at nine fixed points for five orientation cases. As depicted in Figure 6(f), the nine points are placed in three columns: P1–P3 are arranged close to the heated boundary, P4–P6 are along the centerline of the geometry, and P7–P9 are close to the long insulated wall opposite to the heated boundary. For all orientation cases, within a short initial period of time (about 20–30 min), the points in the column nearest to the heated boundary have the highest temperature, followed by the central column, and the points in the column farthest from the heated boundary has the lowest temperature.

Temperature history of selected points during the melting process with hot wall temperature of 70°C: (a) θ = 0°, (b) θ = 22.5°, (c) θ = 45°, (d) θ = 67.5°, (e) θ = 90°, and (f) positions of the selected points.
In the following time, for the 0°, 22.5°, and 45° cases, the temperature at P1–P3 remains at an almost steady level, while the temperature at P6 and P9, which are in the upper PCM domain, experiences a significant rise and exceeds the temperature at P1–P2. After that, the temperature at P5 and P8, which are at the middle of the container’s height, rises significantly but comparably slowly than P6 and P9 and exceeds the temperature of P1. This pattern resembles what happened in the previous melting stage. In the previous discussed stages, the temperature at P4 and P7, which are at the bottom side of the PCM domain, keeps a steady and slow rate compared to all other points. In the last stage, for the 0°, 22.5°, and 45° cases, the PCM in the container is obviously stratified and temperature at the upper two rows (P3, P6, P9 and P2, P5, P8) has reached the peak, and temperature at P1, P4, P7 rises gradually till the peak. For the 90° case, the evolution of temperature at points within each column is identical, and the rate of temperature increase is significantly lower than that in any other case. This might be because there is neither density difference at the same level nor heat source breaking the stratification, so conduction would be the dominant heat transfer mechanism, like the air distribution in a space with a ceiling heating panel.
Heat transfer and thermal storage characteristics
In order to account for the overall heat transfer ability from the heating boundary in the PCM charging progress, the average heat flux at the heated boundary was calculated for each orientation case. Overall, from 10 min afterward, all cases show a downward trend except for the 0°, which first experiences a slight upward trend before reaching a peak heat transfer of nearly 195 W and then decreases to a minimum of about 25 W, as shown in Figure 7. The heat transfer rates at the heated boundary in both 67.5° and 90° cases decrease at a similar rate and level out after reaching a minimum heat transfer of about 25 W. The decreasing patterns of the 22.5° and 45° cases are similar, with a downward trend in the beginning followed by a 30-min leveling out. Then, the heat transfer goes downward with a steep rate until reaching a minimum level slightly lower than all other cases.
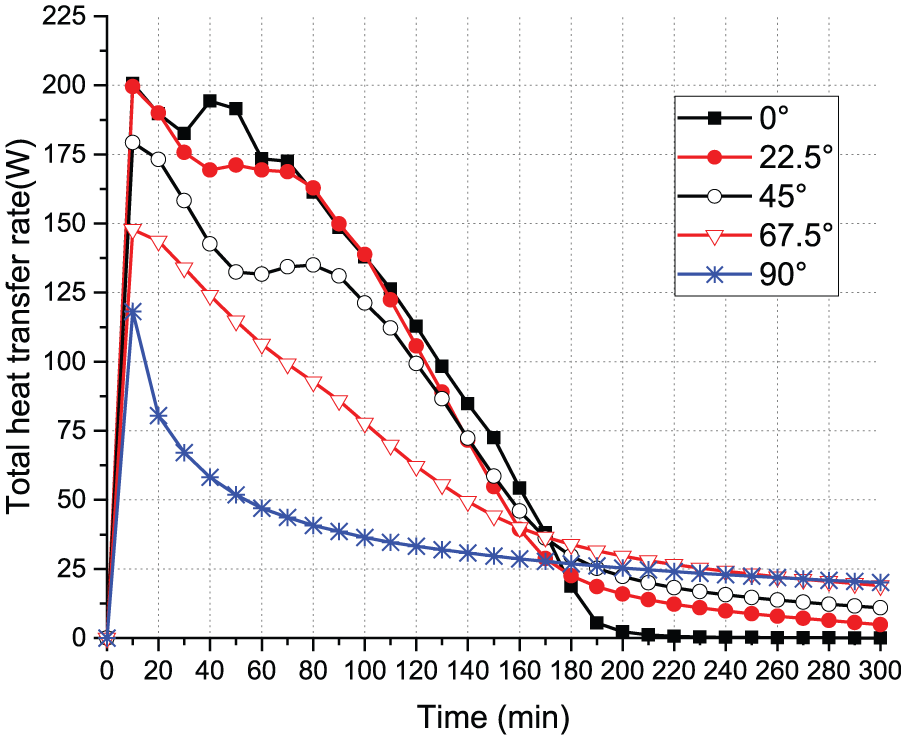
Heat flux at the heated boundary in each orientation case.
To further explain the heat transfer characteristics, the maximum velocity, which represents the intensity of convective heat transfer within the PCM domain of each case, is depicted in Figure 8. Overall, the convective heat transfer intensity is obviously different from what is currently known from existing literature, where heated boundary is situated at the bottom side of the geometry or both upper and bottom boundaries. All the orientation cases clearly show a steep rise in the maximum velocity within a short period of about 100 min, although with a small magnitude of value. Then, the maximum velocity decreases to the lowest level within an almost equal amount of time. With respect to heat transfer enhancement induced by convection, Figure 8 shows that the convective heat transfer is larger when the orientation angle is small, when the geometry is more approximate to vertically placed.

Maximum velocity within the PCM domain for the five orientation cases.
It should also be noticed that the 90° case (horizontally placed) shows almost no convection throughout the melting process, so it resembles a nearly pure conductive process. Moreover, Figure 8 again explains the emergence of a straight solid–liquid interface in the 90° case. In contrast to obvious Bénard cells induced by convective circulation spotted in several studies in literature,15,18 convective heat transfer in the 90° case is totally restrained by thermal stratification. This thermal stratification highly resembles that appear in radiant floor indoor cooling systems and atmospheric temperature inversion. These two scenarios imply the pros and cons of the stratification-induced stability, depending on whether a stable condition or a higher rate of mixing is preferred.
Figure 8 might also further explain why there is a decreasing process for several points (Figure 6(a)–(c)) near the heated boundary. For example, in Figure 6(a), the temperatures of P1 and P2 first ascend to a higher level and then reduce a little. First, according to Figure 7, heat flux at the heated boundary increases to a maximum very quickly at the initial stage and then decreases after about the 10th min. Second, because at the initial stage, the natural convection effect has not fully developed, which can be explained by Figure 8: the maximum velocity in the enclosure keeps increasing before the 50th min. So, after the 10th min, the heat received from the heated boundary is less, while the heat is more quickly transferred to the PCM far from the heated boundary because natural convection dominates the process and accelerates the heat transfer process. Also the mixing of liquid PCM at the upper side and lower side is more intense because of liquid circulation with higher speed.
The thermal storage in PCM at a particular time is calculated by deducting the initial enthalpy at t = 0 min from the total enthalpy at that particular time. The variation of thermal storage with time for different orientations is shown in Figure 9. Overall, from the point of thermal storage rate, the θ = 0° case is the most superior, showing an almost steady increase in the thermal storage until reaching the maximum. For the other cases, the time-dependent thermal storage resembles the pattern of liquid fraction. It should be noticed that there is a slight difference between the total thermal storage amounts, with the 67.5° and 90° cases lower than the others. This is because a thermal stratification exists at the end of the melting process, which means the total sensible heat storage would be different.

Variation of total heat storage within the melting process.
Conclusion
For an unconstrained PCM-based heat sink, the melting time of PCM could be significantly affected by changing the orientation of the heat exchange surface. Previous studies show that when PCM is heated at the bottom boundary or at both upper and bottom boundaries, the melting process will be accelerated by changing the geometry from vertically placed to horizontally placed. This conclusion may not apply to a few practical engineering applications where heat source is mainly at the upper side of the geometry, such as PV–PCM roof and PCM window systems. Inspired by these engineering applications, this work extends the understanding on heat transfer mechanism in PCM’s melting process by investigating the instantaneous melting process of lauric acid within a 2D rectangular geometry with five orientations (θ = 0°, 22.5°, 45°, 67.5°, and 90°) using the computational fluid dynamics (CFD) software.
With an upside heat source boundary, the overall melting rate is lower when the rectangular geometry is more inclined from vertically placed, which is to the contrary of previous studies where PCM was heated at the bottom boundary. When the rectangular geometry is rotated from vertically placed (θ = 0°) to horizontally placed (θ = 90°), the total melting time is about five times longer. For all the investigated inclination cases, the heat transfer rate at the isothermal heated boundary is found to first increase at the initial stage (within about 100 min) and then decrease through the following melting process. Moreover, the total amount of thermal storage for the horizontally placed case is slightly lower comparing to all other cases because of a clear thermal stratification at the end of the melting period.
The horizontally placed case shows no sign of cellular flow and the solid–liquid interface remains as a straight line throughout the whole melting process, and the monitor of velocity in the calculation domain shows no sign of liquid movement. The convective heat transfer is restrained while conductive heat transfer dominates the whole melting process.
The big difference in the overall performance of PCM under different orientation conditions poses challenges for passive energy saving technology, especially when PCM acts as the thermal storage medium for solar energy application. The enhancement and restraint on melting process accompanied with the orientation of heat exchange surface should be fully considered, either for reducing charging time of thermal storage devices or for optimizing PCM-assisted building structure. In practical engineering applications, besides the influence of buoyancy-induced natural convection, the influence of thermal stratification should also be fully accounted.
Footnotes
Handling Editor: Jose Ramon Serrano
Declaration of conflicting interests
The author(s) declared no potential conflicts of interest with respect to the research, authorship, and/or publication of this article.
Funding
The author(s) disclosed receipt of the following financial support for the research, authorship, and/or publication of this article: This work was supported by the National Science Foundation of China (No. 51478058), the 111 Project (No. B13041), and the Chongqing City Fundamental and Advanced Research Projects (No. CSTC2014jcyjA90018).