
Abstract
Fiber orientation induced by injection molding of short-fiber-reinforced composites causes anisotropy in material properties and produces warping. Fiber-orientation distribution is very important to research for mold design and quality to produce sound molded parts. In this study, three kinds of methods are used to solve the optimization problem. Fiber-orientation distribution is described by fiber-orientation tensor variation. The objective function is a minimum problem of the fiber-orientation tensor variation. Parameters such as fiber content, fiber aspect ratio, melting temperature, injection pressure, holding pressure, and filling time are considered as design variables. Based on orthogonal experiment design, Moldflow software is used in the fiber-reinforced acrylonitrile butadiene styrene composite injection molding. The effects of process parameters for the plastic part are studied using the signal-to-noise ratio. The most important design parameter influencing fiber-orientation tensor variation is determined by finite element analysis results based on the analysis of variance. The optimization model is established on the basis of the back propagation neural network. The Taguchi, the particle swarm optimization, and genetic algorithm–particle swarm optimization hybrid algorithm are used to find the minimum fiber-orientation tensor variation value. Results show that the quality index of the fiber-orientation tensor variation in the part is improved.
Keywords
Introduction
In the injection molding product production, in order to enhance the performance of the products, the most common method is the addition of short fibers such as glass and carbon fibers in the polymer-based. The existence of the fiber will ultimately affect the products’ elastic modulus, tensile strength, thermal conductivity, electrical conductivity, optical properties, and so on. In the injection molding filling, the fiber is suspended in the melt because of the deformation and effect of flow field, and the orientation will orient along a certain direction and change with different positions and different time. Ultimately, the fiber orientation of the products will present in a complex condition, which leads to the anisotropy of mechanical properties. 1 Therefore, the research of fiber orientation has important significance.
In recent years, extensive research on the fiber orientation has been conducted using the numerical simulation. Hung and Shen 2 predicted the fiber orientation based on Jeffery’s model during injection molding using the finite element method. Aurich and Mennig 3 presented a thorough experimental study of flax fiber orientation. Comparison of the measured and calculated modulus in tension shows good agreement. Chang et al. 4 presented an effective methodology for the optimization injection molding process parameters of short-glass-fiber-reinforced polycarbonate composites. A computer-aided engineering (CAE) flow simulation software was used to simulate the injection molding process and to predict the fiber orientation. On the basis of the CAE analysis, the optimum process parameters are obtained for the thickest shear layer.
As previously mentioned, an extensive research on the fiber orientation has been conducted using the numerical simulation method. Advanced methods are highly demanded to model and optimize the injection molding process with the purpose of manufacturing high-quality plastic parts. Many researchers have been devoted to the optimization research by their experience to apply a trial-and-error method or the Taguchi approach. Although the methods are time-consuming and costly, it is important to evaluate design parameters. Kuram et al. 5 researched that the glass-fiber-reinforced nylon 6 was reprocessed in the five processing cycles using Taguchi method. The result showed that the method can improve effectively on mechanical properties. Huang et al. 6 presented a hybrid swarm intelligence with Taguchi-genetic algorithm (GA) to optimize the inverse kinematics. Wang et al. 7 investigated the injection molding process parameters for manufacturing a brake booster valve body. The optimal parameters are determined by the Taguchi method integrating with the CAE to improve the compressive property of the valve body. KC et al. 8 researched the optimization of process parameters of sisal-glass fiber hybrid biocomposite in injection molding by Taguchi method. The results show the optimization parameters meet the dimensional requirements of automotive parts. Chen et al. 9 proposed an effective methodology integrating the finite element and Taguchi methods to determine the optimal design conditions in injection molding for short-fiber-reinforced polycarbonate composites. The effects of four main parameters—the filling time, melt temperature, mold temperature, and injection speed—on the fiber orientation were investigated and discussed. It is found that the dominant parameter is the filling time.
In addition, many researchers are committed to building the relationship model between the objective function and the influence factors by artificial neural network, Kriging model, and response surface methodology. Kurtaran et al. 10 established a predictive model in injection molding using the artificial neural network. It is validated that neural network model is valid for predictive capability. Zhang et al. 11 employed the response surface methodology to obtain the relationship model between the objective function and independent variables. Compared with the reference model, the performance of the optimized model was significantly improved. Ozcelik and Erzurumlu 12 optimized process conditions to minimize the warpage of the part in injection molding using analysis of variance (ANOVA), artificial neural network, and GA. Chow et al. 13 researched the global optimization of absorption chiller system. The neural network was used to model the system characteristics. The results confirmed that this methodology could be effective.
In recent research, the global optimization approach has become a new trend in optimizing the process parameters. GAs and particle swarm optimization (PSO) have been widely used to solve optimization problems. To minimize the warpage on the thin shell plastic part, 14 an effective GA was used to obtain the optimum process parameters. Chen et al. 15 proposed the hybrid GA-PSO to solve the optimization problem in plastic injection. The final optimal combination of process parameters was obtained by the hybrid GA-PSO. The confirmation results show that the proposed method not only enhances the stability but also reduces the costs of and time spent in the injection molding.
As Taguchi method is a robust parameter design technology, the neural network has become a powerful and practical method for modeling highly complex nonlinear systems. GA and PSO have the broaden application in various optimization research fields. Therefore, these methods have been successfully applied in system modeling and process optimization. This study uses the statistical method for the first time. In order to determine the best levels for design parameters, the Taguchi design of experiment (DOE) technique is used to obtain the optimal injection molding conditions. The ANOVA is used to find out the main control factors of the injection molding process. The neural network method is used to establish the relationship model. Finally, PSO and GA-PSO are, respectively, used in the parameter optimization of fiber-reinforced composite injection molding.
Relative theory
The back propagation neural network
Back propagation neural network (BPNN) has the powerful ability of nonlinear interpolation to obtain the mathematical mapping reflecting the internal law of the experimental data. Thus, neural network has been widely used in engineering applications for prediction and optimization. In this study, BPNN is used to establish the relationship model between the design parameters and the fiber-orientation tensor variation. The algorithm process of the BPNN is divided into BPNN training and BPNN for prediction.
Before making prediction with the BPNN, it should be trained first. By training, the network will own the ability of associative memory and prediction. The BPNN is a multilayered architecture made up of one or more hidden layers placed between the input and output layers.
Based on the input variable x, connection weights wsj between input layer and hidden layer, hidden layer threshold a, and the outputs H of hidden layer are calculated as follows

where l is the node number of hidden layer of neural network and f is the activation function. The activation function is expressed as follows
According to the hidden layer outputs H, connection weight wjt, and threshold value b, the predictive outputs O of the BPNN are calculated as follows

The PSO algorithm
PSO algorithm inspires from population behavior characteristics and is used to solve optimization problems. Each particle in the algorithm represents a potential solution of the problem and corresponds with a fitness which is determined by the fitness function. The particle’s velocity determines the direction and distance, and the speed is dynamically adjusted by themselves and movement experience of other particles, so as to realize the optimization of individual in the solution space.
We assume that a searching space of D dimension has the species composed of n particles X = (X1, X2, …, Xn), where the ith particle is expressed as a D dimension vector Xi = [xi1, xi2, …, xiD]T, representative of position of the ith particle in D dimension of search space, which also represents a potential solution of a problem. According to the objective function, the position of each particle Xi corresponding fitness values can be calculated. The speed of the ith particle can be expressed as Vi = [Vi1, Vi2, …, ViD]T, and its individual extremum is Pi = [Pi1, Pi2, …, PiD]T and populations of the global extremum is Pg = [Pg1, Pg2, …, P gD ]T.
In the process of each iteration, the particle updates the velocity and position by individual extremum and global extremum updates. Updating formula is as follows
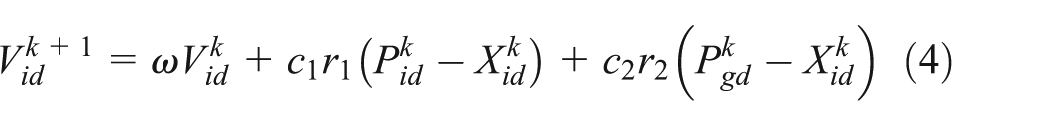

where Vid and Xid represent the current velocity and the position of the ith particle, w is the inertia weight, and k and k + 1 refer to the recent and the next iterations. d = 1, 2, …, D; i = 1, 2, …, n. c1 and c2 represent “trust” parameters indicating how much confidence the current particle has in itself and how much confidence it has in the swarm; r1 and r2 are two random numbers between 0 and 1.
The GA-PSO algorithm
The PSO algorithm has fast convergence and strong versatility; however, there are some deficiencies, such as easy to premature, low precision, and low efficiency of the later iterations. However, the GA uses selection, crossover, and mutation operators in the process of function optimization to enhance the global optimization ability, accelerate the speed of evolution algorithm, and improve the precision of convergence. But this mechanism leads to increase in the convergence time of the algorithm. In order to make the two kinds of algorithms effectively combine, the search mechanism of the GA is introduced to form the initial particle swarm. Thus, the GA-PSO optimization algorithm is proposed.
When the particle swarm algorithm stagnates or embeds local optimal solution, the algorithm is tested and genetic operation is carried on to the particles, namely, genetic PSO algorithm. Genetic operation commonly uses selection, crossover, and mutation operations, and in this article, the crossover and mutation operations are chosen to high particle searchability. In the process of crossover operation, the position and speed of the particle that possesses the highest fitness value keep unchanged. Crossover operation of the velocity and position is expressed in the following equation
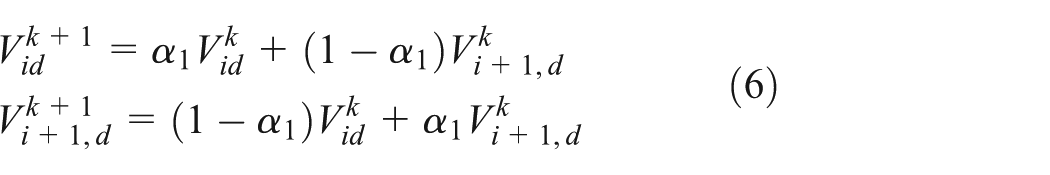

where
After crossover operation is completed, the mutation is carried on. The articles that have no searchability are randomly initialized at a certain probability so as to break the equilibrium state which the particle hovers near the local optimal solution and improve the population diversity.
The GA-PSO algorithm steps can be outlined as follows:
Step 1. Initialize each particle in the population randomly and set the initial position and speed.
Step 2. Calculate the fitness value of each particle and initialize the individual optimal value and the global optimum value of the particle swarm.
Step 3. Update the local and global optimal values of the individual according to the particle’s fitness value.
Step 4. Update the particle velocity and position.
Step 5. Determine whether the particles fall into local optimum. If yes, return to step 3. Otherwise, enter step 6 to continue the operation.
Step 6. Check whether the end condition is satisfied. If the current iteration number reaches the maximum number of times, then stop the iteration and output the optimal value.
Experimental design
Problem description
Figure 1 shows the simulation model of a plastic part with mesh geometry. Its length, width, and height are 146, 190, and 10 mm, respectively. The geometry of the plastic part is discretized using the “fusion” grid. The global grid side length is 6.45 mm, and the string is 0.1 mm. The number of triangle units is 3520. The material is acrylonitrile butadiene styrene (ABS) (manufacturers for the UMG ABS Ltd, brand UMG ABS GF20). The thermoplastic material for conducting the finite element analysis is selected from the Moldflow software. Its properties are given in Table 1.

Base and mesh geometry together.
Properties of the part material.

ABS: acrylonitrile butadiene styrene.
Fiber-orientation tensor variation measurement
Fiber-orientation tensor results show the probability of fiber orientation along the first main direction (i.e. flow direction). Specifying the high probability of fiber orientation along the first main direction is signified by the range value that is close to 1, whereas the low probability is close to zero value. The results of the fiber-orientation tensor along the first principal direction are useful for research.
In the fiber-reinforced composite injection molding process, fiber orientation significantly influences the mechanical property of molding products and produces the products’ current anisotropic properties. It is very important to research the fiber-orientation distribution. In this study, the fiber-orientation distribution is denoted by the fiber-orientation tensor variation (the difference between the maximum and the minimum fiber-orientation tensor). When the fiber-orientation tensor variation is smaller, fiber-orientation distribution is more homogeneous.
Therefore, the fiber-orientation tensor variation in the plastic part is selected as the objective function, and the objective is the minimum problem.
Orthogonal design
In this study, Taguchi’s experiment design is used to identify the optimal settings of process conditions and the effect of the process parameters on the fiber-orientation tensor variation. It is composed of the parameters of the fiber-reinforced composite injection molding process. Each experimental factor is researched at three levels between the lowest and highest values. Fiber content ranges from 10% to 30%, fiber aspect ratio ranges from 10 to 50, melting temperature ranges from 220°C to 260°C, injection pressure ranges from 60 to 80 MPa, holding pressure ranges from 40 to 60 MPa, and filling time ranges from 1 to 3 s. Six variable factors with three levels are studied, as shown in Table 2.
Factor and level set.

According to the orthogonal experiment design, the number of experimental trials is 27. The signal-to-noise ratio (S/N) for each experiment is computed by

where n is the number of fiber-orientation tensor variation data sets, which is equal to 27, and yi is the fiber-orientation tensor variation value for the ith data set.
Results and discussion
Taguchi method
The Taguchi method is used during the design of parameters for product control and procedure optimization to find the best results. Thus, the Taguchi method is used to determine the effect of the process parameters on the fiber-orientation tensor variation. For each of the 27 experimental trials, the finite element results for the fiber-orientation tensor variation and the S/N results are shown in Table 3. The S/N is an important quality indicator that designers use to evaluate the effect of process parameters on the products’ quality index. As the objective of the research is to minimize the fiber-orientation tensor variation, the S/N ratio related to the smaller-the-better quality characteristic is selected when calculating the S/N ratio. The response table of the S/N ratio and diagram are given in Table 4 and Figure 2, respectively. The table is used to determine the optimal control factor settings in minimizing the fiber-orientation tensor variation. Table 4 presents the S/N response values at three levels and the effect of each factor on the S/N ratio. Figure 2 illustrates the effects of control factors by showing S/N values at three level settings for each factor.
Results of the

S/N: signal-to-noise ratio.
Response table of the S/N ratio.

S/N: signal-to-noise ratio.
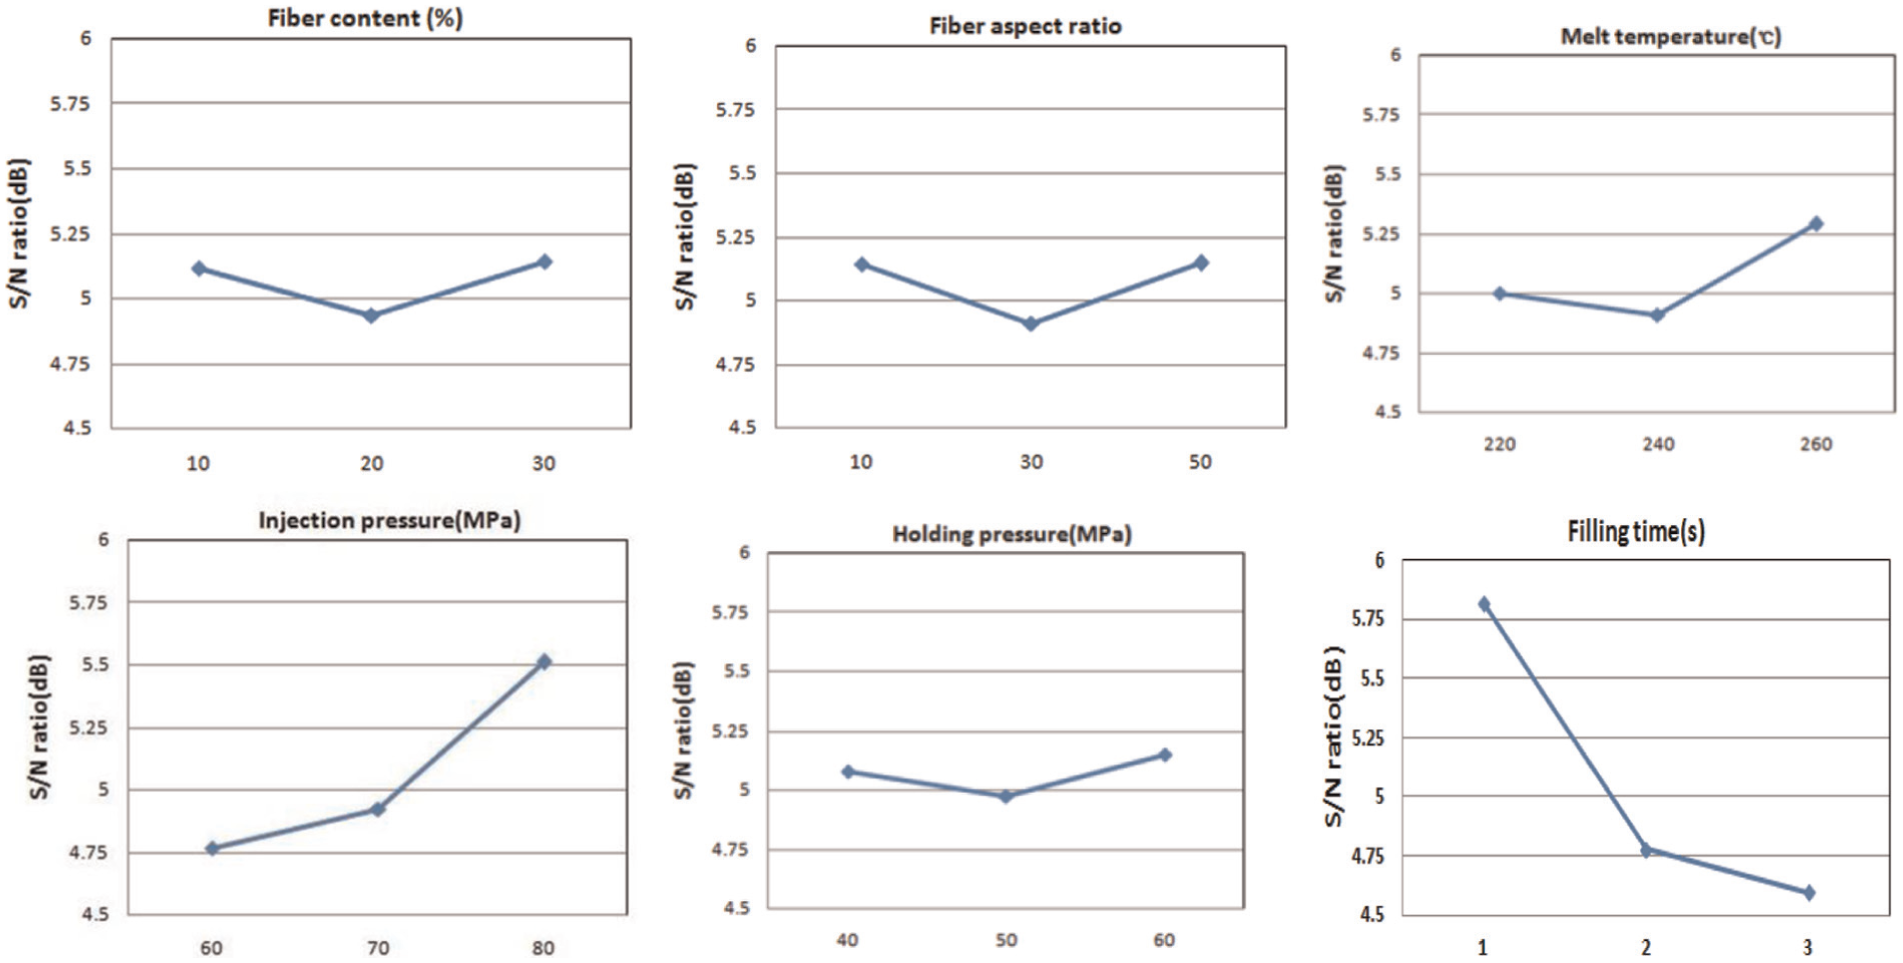
Response diagram of the S/N ratio.
In Table 4, the best set of combination parameters can be determined by selecting the level with the highest value for each factor. The analysis of the results shows that the optimal process parameter combinations for the fiber-orientation tensor variation are A3, B3, C3, D3, E3, and F1. These variations correspond to a fiber content of 30%, a fiber aspect ratio of 50, a melting temperature of 260°C, an injection pressure of 80 MPa, a holding pressure of 60 MPa, and a filling time of 1 s for the fiber-orientation tensor variation.
ANOVA
The purpose of ANOVA is to determine the statistically significant parameters influencing the fiber-orientation tensor variation in the designed experimental study. The ANOVA results for fiber-orientation tensor variation are given in Table 5. As shown in Table 5, the F-values of factors D and F are all greater than F0.05, 2, 23 = 3.42. Therefore, the injection pressure and filling time are important parameters. In particular, the filling time is the most influential factor for fiber-orientation tensor variation in injection molding, followed by the injection pressure and melting temperature. Chen et al. 15 studied optimization of the injection molding process for short-fiber-reinforced composites and found that the filling time is the most influential factor. This result is consistent with the results of this study. Moreover, the fiber content and holding pressure are not effective factors of minimum fiber-orientation tensor variation.
ANOVA for fiber-orientation tensor variation.
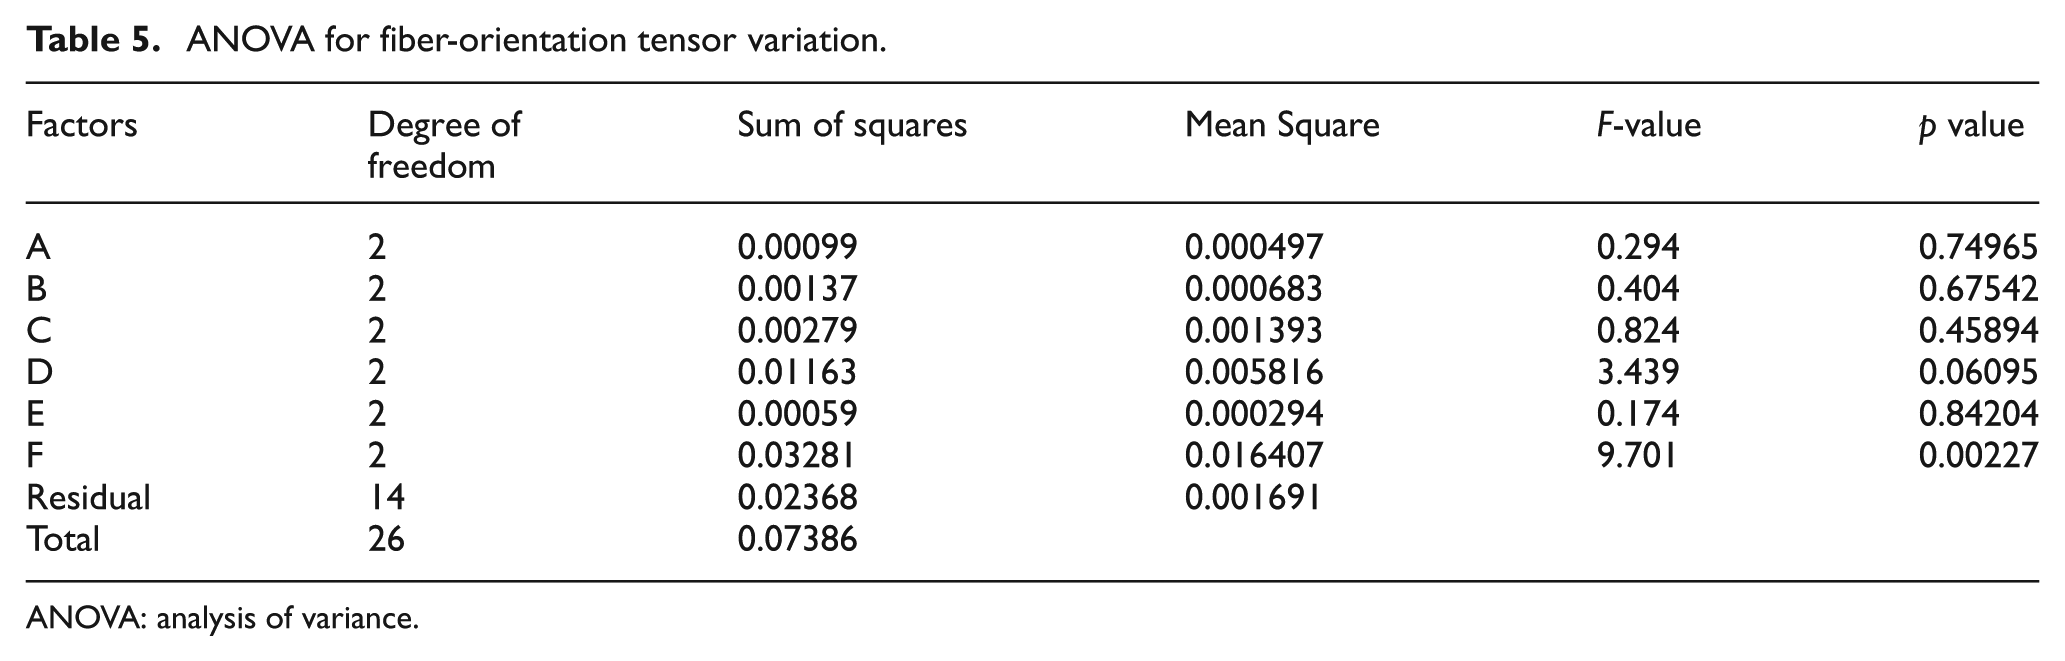
ANOVA: analysis of variance.
BPNN model for fiber-orientation distribution variation
Based on the above-mentioned results, the fiber content and the holding pressure do not significantly affect the fiber-orientation tensor variation. Therefore, factors, such as fiber aspect ratio, melting temperature, injection pressure, and filling time, are selected as the design parameters in establishment of BPNN model for fiber orientation tensor variation because they potentially affect the fiber-orientation tensor variation. The objective is to optimize the process parameters such that the fiber-orientation tensor variation is minimized. The neuron number of the input layer of BPNN is determined by the number of design variables selected, and the neuron number of the output layer is determined by the number of the objective indexes. Thus, the number of input parameters is 4 and the output parameters is 1, that is, the node number of the input layer is 4, and the node number of the output layer is 1. The node number of the hidden layer is determined with train trials, and the final value obtained is 10. Therefore, the artificial neural network configuration is 4-10-1. In this study, a four-layer BPNN model with two hidden layers is used. The configuration of BPNN is shown in Figure 3.
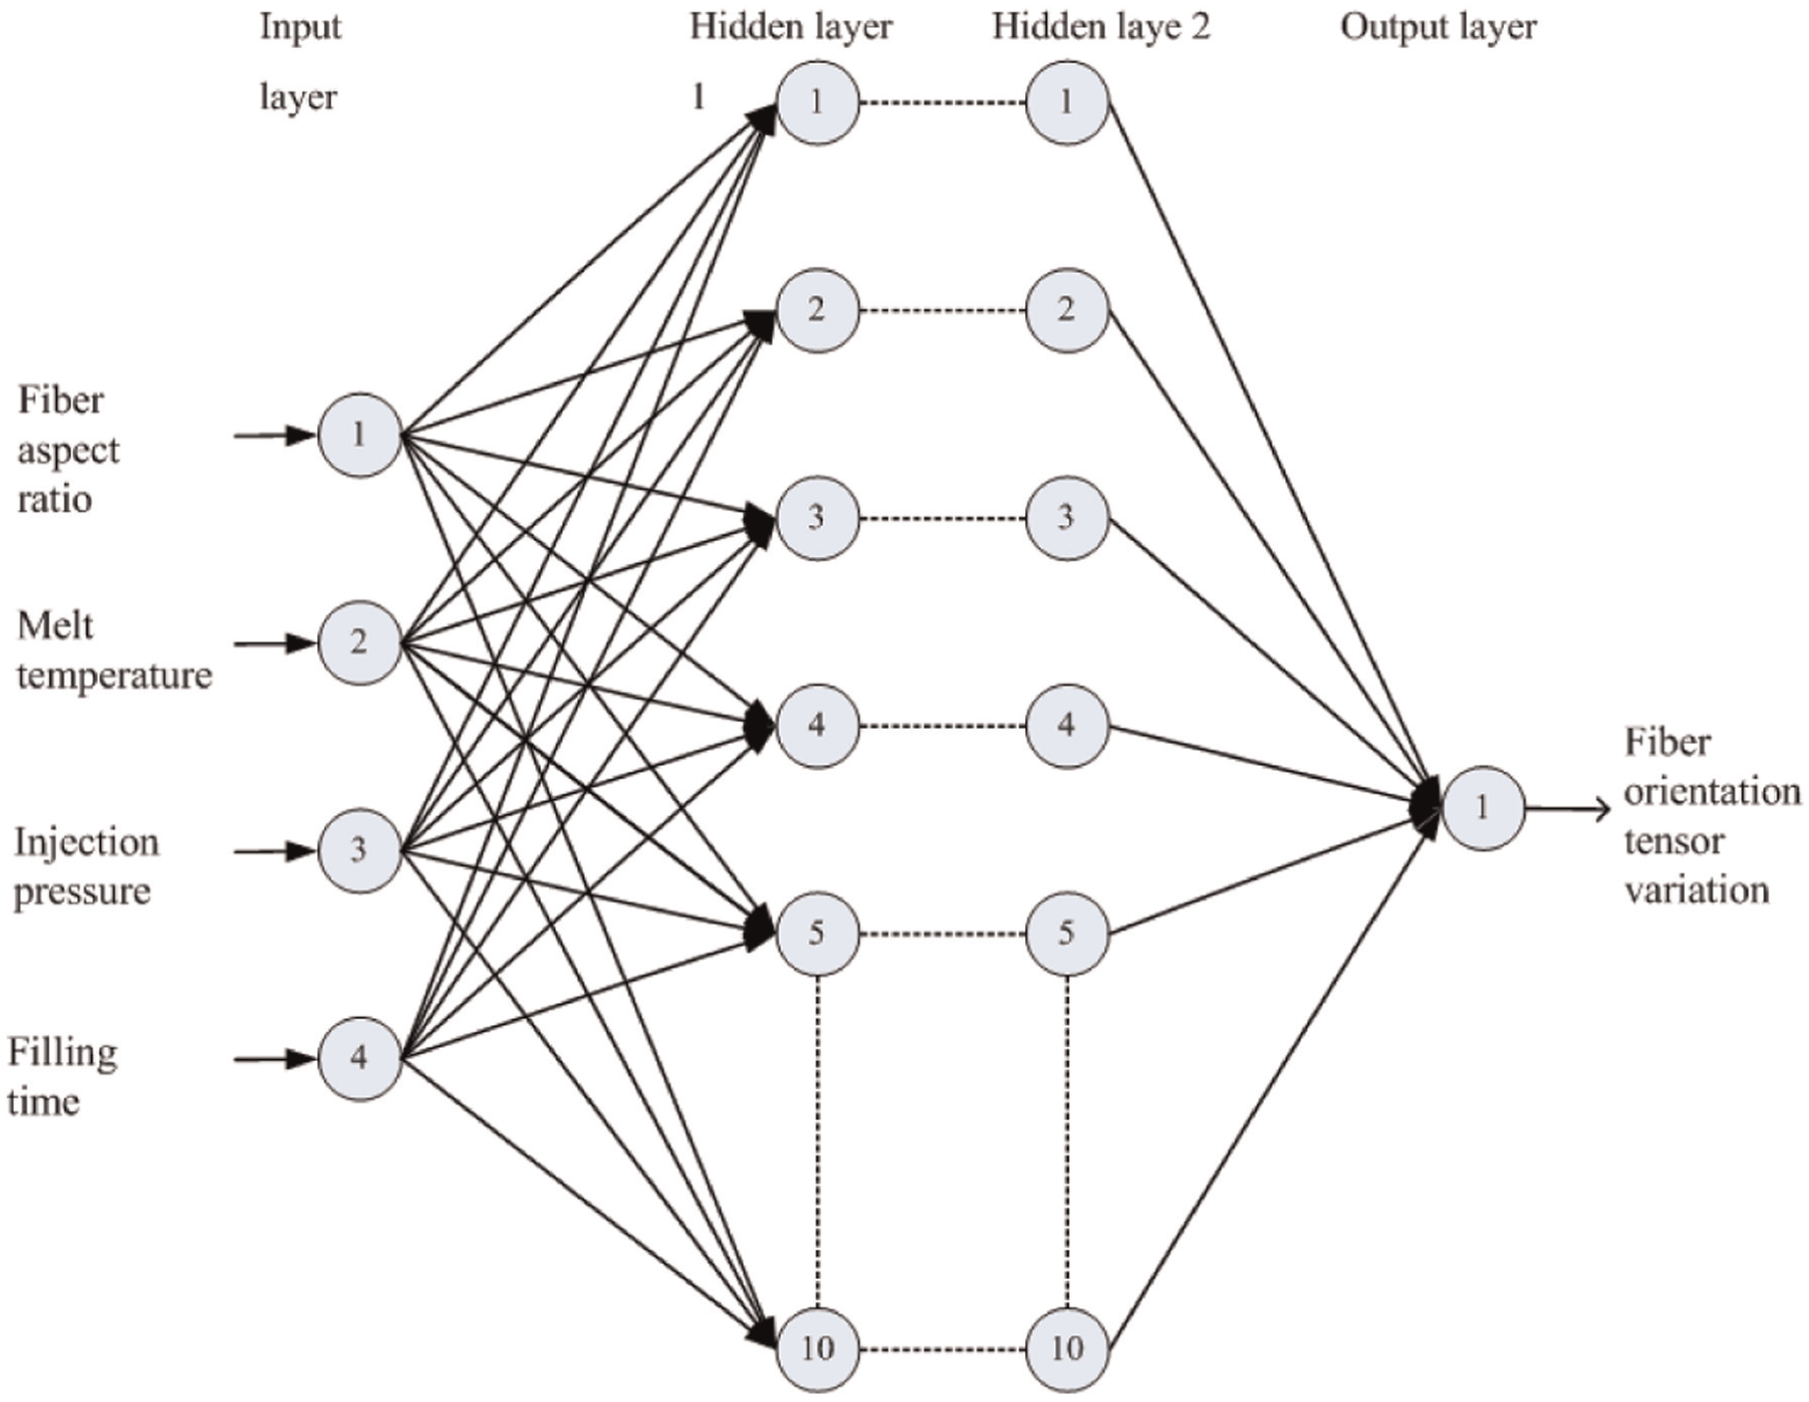
Configuration of the BPNN model.
To obtain the training sample library containing enough samples, the way of circulation exchange is used to extend the 27 data sets of orthogonal design in Table 3 to 81 training sample data sets.
Among the 81 samples in the previous section, 61 samples are used to train the BPNN. Then, the remaining 20 samples are used to test the BPNN performance. In Figure 4, the difference of the BPNN forecast and the Moldflow simulation value is shown. The predictive value of the established BPNN is in good agreement with the simulation results. The developed BPNN model gives a satisfactory approximation and can be used as an efficient predictive tool for fiber-orientation tensor variation.

Comparison of fiber-orientation tensor variation with (a) FE analyses and (b) neural network for training data set.
Optimization through PSO and GA-PSO
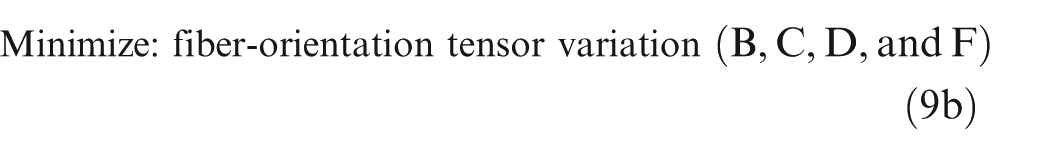
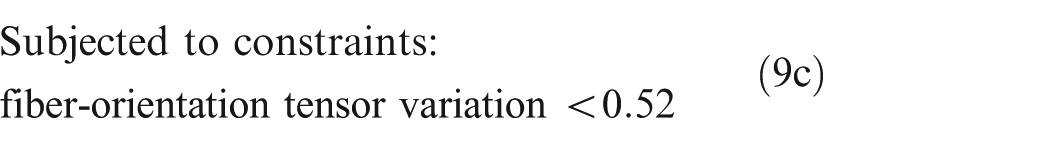
Based on the established relationship model using BPNN, the PSO and GA-PSO are, respectively, used to figure out the minimum fiber-orientation tensor variation. The optimum value of fiber aspect ratio (B), melting temperature (C), injection pressure (D), and filling time (F) toward minimum fiber-orientation tensor variation can be efficiently obtained by formulating it as an optimization problem, which can be stated as follows

In order to figure out the optimal solution, PSO and GA-PSO are used to solve the minimum problem. In this study, a population size of 20, the dimension of the particle is 2, and generation number of 100 are employed. The evolution of the generations is shown in Figure 5.

Fitness curve with (a) PSO algorithm and (b) GA-PSO algorithm.
Based on PSO algorithm, the figure shows that after 50 iterations, the optimal fitness value is 0.4725. However, based on GA-PSO algorithm, the figure shows that after 10 iterations, the optimal fitness value is 0.4307. The corresponding optimized parameter combinations are, respectively, given in Table 6.
Result verification.

GA: genetic algorithm; PSO: particle swarm optimization.
Verification of the optimization result
The confirmation experiment is very important in parameter design. The numerical experiments have been performed based on the optimized process parameters by GA and GA-PSO method. The calculated fiber-orientation tensor distribution is shown in Figure 6(c) and (d). The difference between the maximum value and the minimum value is 0.5289 and 0.5051. The minimum value of the fiber-orientation tensor variation is 0.5289 and 0.5051. Therefore, the GA-PSO enhanced the global optimization ability of PSO algorithm to speed up the evolution of the algorithm, and the convergence precision is improved.

Fiber-orientation tensor distribution: (a) recommended parameter, (b) Taguchi method, (c) PSO optimization, and (d) GA-PSO optimization.
When the minimum fiber-orientation tensor variation of the part is considered, the fiber-orientation tensor variation (0.5462 before the optimization) is reduced to 0.5051. This value is larger than the BPNN-predicted result under the optimization parameters but smaller than all the samples. The fiber-orientation tensor distribution before optimization is shown in Figure 6(a). The corresponding parameters and result are shown in Table 6. At the same time, the confirmation experiment is conducted based on the Taguchi method. The result demonstrates that the fiber-orientation tensor variation is 0.5368 based on the optimum process parameters obtained by Taguchi method, which is smaller than the value before optimization; however, the variation is larger than the value obtained by GA and GA-PSO method. The fiber-orientation tensor distribution is shown in Figure 6(b). The result shows that the fiber-orientation tensor distribution of the fiber-reinforced composite injection molded part has been improved under the optimized process conditions using GA-PSO.
Conclusion
In this study, an efficient optimization methodology using BPNN and GA-PSO is developed to optimize the fiber-orientation distribution in short-fiber-reinforced ABS composite injection molding. A plastic part under the design parameters is used as the example. On the basis of the Taguchi experiment design and Moldflow numerical simulation, the S/N ratio is used to determine the optimal set of process parameters. ANOVA is used to determine the significance of each factor in the experimental study. This method determines the significance of each factor to minimize the fiber-orientation tensor variation. The dominant process parameter of injection molding is the filling time, followed by the injection pressure and melting temperature. An efficient predictive model for fiber-orientation tensor variation is established based on the most important process parameters (fiber aspect ratio, melting temperature, injection pressure, and filling time) using BPNN to reduce the computational cost of the optimization process. GA-PSO reduces the fiber-orientation tensor variation, and satisfactory results are achieved. The results showed that fiber aspect ratio of 18, melting temperature of 224°C, injection pressure of 65 MPa, and filling time of 1 s provide the minimum fiber-orientation tensor variation. Furthermore, this study indicates that the optimization methodology can also improve the other parts manufactured in fiber-reinforced composite injection molding.
Footnotes
Academic Editor: David R Salgado
Declaration of conflicting interests
The author(s) declared no potential conflicts of interest with respect to the research, authorship, and/or publication of this article.
Funding
The author(s) disclosed receipt of the following financial support for the research, authorship, and/or publication of this article: This work was supported by the Fundamental Research Funds for the Central Universities (WUT: 2017III020) and Science and Technology Research Project of Jiangxi Provincial Department of Education (No. GJJ160711).