
Abstract
The aim of this study is to model the influence of the bleed orifice area of a high-performance damper on the dynamic behaviour of a vehicle. For this purpose, a mathematical model of a monotube high-performance damper is developed, considering the presence of two regulation ways on the effect of bleed valve orifice of the damper. An application of changes in damper setup in the field of practical enables to analyse the influence of the positions of both rod and bottle selectors on the damping force. The proposed damper model is validated experimentally. The analysis of the dynamic behaviour is performed through a quarter vehicle simulation under different conditions of road roughness and speed regimes. In addition, an analysis of the frequency response of the sprung mass acceleration by means of power spectral density was applied to obtain the dynamic response of the quarter vehicle model. Results show that the influence of the bleed orifice is magnified for low speeds and for profile roads with few variations on surface. This effect is reduced for both the increasing vehicle speed and the profiles with greater difference in irregularities.
Introduction
When a vehicle moves over road irregularities, the appearing oscillations on sprung and unsprung masses affect negatively the driving and safety dynamics. The suspension system plays an essential role on the vehicle behaviour; it improves the car performance while driving, minimizing the risk of collisions, and also increasing the control and the comfort of the vehicle.1,2 In this context, automobile manufacturers have been working during years in the set of elements that conforms the suspension; one of these components is the presence of shock absorber and its influence on suspension system. Several researches have modelled the damper behaviour under different conditions; however, changes in the configuration of the damper and its effect on the vehicle is an issue that remains unknown. Nowadays, some shock absorbers have the possibility to change their internal setup via external devices located on the damper; this situation lead us to the necessity to know the characteristic damping force of the shock absorber for each configuration and the effects of setup changes on vehicle’s behaviour. This research proposes an analytical model considering the influence of bleed valve changes in the damping force of a monotube damper. Also, the influence of bleed valve changes on a quarter-car simulation is modelled. This research proposes an analytical model considering the influence of the bleed valve changes in the damping force of a monotube damper. Also, the influence of the bleed valve changes on a quarter-car simulation is studied.
Background
One of the major advances in the automotive area has been the ability to evaluate the performance of the vehicle dynamics while driving; however, despite technological advances, the inclusion of a suspension system within the vehicle evaluation systems is one aspect that is still in development nowadays, obtaining good results in some cases.1–3 Nevertheless, given the complexity of its operation and the wide variety of configurations, it has not yet been possible to continually evaluate the behaviour of the suspension while driving. This is mainly due to the operation of the damper, so it is necessary for the evaluation system to be capable of predicting the behaviour of the damper when its specifications and performance are similar to the work conditions.
Lang 4 and Duym and Reybrouck 5 carry out studies of parametric models for dampers. Their researches got successful results; however, these models are very complex using many parameters, some of which are difficult to determine. There are many researches3,6–16 based on the works of Lang and Duym, among them, the one presented by Talbott, 6 who designed a mathematical model of a monotube high-performance shock absorber that included a detailed model of the influence of piston valves and specially the presence of a bleed orifice, can be highlighted.
However, Talbott 6 only describes the behaviour of the damper when one external adjusting is considered (rod selector). Thus, results of this model present an insufficient adjustment when two different external systems of adjusting are used (Rod/Gas bottle selector). The presence of an extra adjusting area changes the behaviour of the damper and its interaction with the valve. Research with a double regulation is still undefined and remains an open question mainly because of the complexity of the models developed: the variety of settings that the damper can be set up in and the many operating conditions which can be subjected to shock absorbers. The novelty of this research is to take this situation into consideration, modelling the influence of the double regulation of the bleed orifice and how this affects the performance of the damper.
Proposed model
The proposed model in this research has been inspired by the work of Talbott, 6 but in contrast, it has been contemplated in detail in the study of valve body, specifically the bleed orifice area. The information of changes in this area is necessary to determine the influence of the setting of the piston on the behaviour of the damper, specifically on the damping force generated by this element. The model proposed is based on the operation of a high-performance monotube shock absorber with a reserve gas chamber.
The basic physical elements necessary for the mathematical model of the damper is shown in Figure 1. In the scheme, only the compression stroke is reflected, where the valve is open showing compression flows passing through the piston orifice, the bleed orifice and the slack present between the piston and the cylinder wall. The gas piston movement (z) is proportional to the stroke of the rod during the movement (x). It is notable that the rebound stroke is inverse to the compression stroke, so Figure 1 describes a compression movement.

Flow diagram during the compression stroke.
Most of the damping force acting on the shock absorber is generated in the piston; for this reason, it is necessary to analyse the acting forces on the piston via a free-body diagram of the rod–piston as shown in Figure 2.
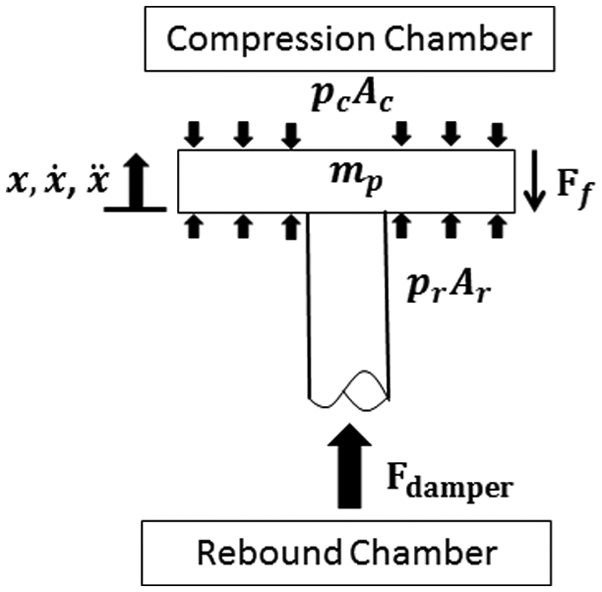
Piston–rod free-body diagram.
The free-body diagram shows the forces acting on the rod–piston assembly, the damping force

Total oil flow
The phenomenon which generates the most damping force is the resistance of the hydraulic fluid through a series of paths. In literature,4,5,7,9 it has been shown that chamber pressure depends on numerous parameters, including total flow between chambers, shock absorber stroke and velocity. Figure 3(a) and (b) shows the total flow of oil through piston valve divided into three possible paths. The first flow passage is through piston valves. Labels (1) and (2) represent the flow of fluid through the rebound valve and compression valve, respectively. The second flow is the one that flows through the bleed orifice located at the end of the rod (see label 3), while the third and final flow paths are between the seal around the piston and the wall of the damper tube.

Cutting view of a damper tube, the flow path by rebound valve (1)–(2) and through the bleed orifice (3) during the (a) compression and (b) rebound stroke.
As mentioned, the total flow of oil flowing into the damper is the sum of three flows (equation (2)), through the bleed orifice

Due to the presence of the rod in the rebound chamber, the area of the piston that faces the rebound chamber

Diagram of compression stroke.
To characterize flows through the bleed orifice and valve piston, Bernoulli’s equation for flow passing through an area

where

The differential pressure
Flow through the piston wall
To determine the volume of flow pass between the piston and the cylinder wall (see Figure 5), Lang 4 uses a model assuming a laminar flow between two parallel plates because the distance between the two surfaces is very small.

Leakage flow through the piston and the cylinder wall.
The equation for flow between two parallel walls is derived from the Navier–Stokes equation
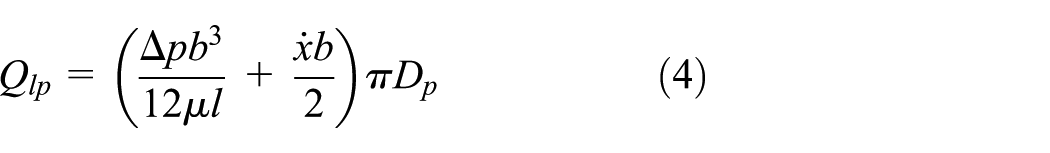
where b and l are, respectively, the width and length of the gap between the piston and the cylinder wall;
Calculation of pressure
Taking into consideration the work of Duym and Reybrouck,5,8 the pressures are defined in the compression chamber and the gas chamber of the damper (remember that rebound pressure is obtained by performing the same analysis of the compression section, taking into consideration the changes on the coordinate system and the acting friction). Also, the oil inside the damper is considered as incompressible, so gas pressure is a function of piston displacement. In Figure 6, the relationship between the pressure in the compression chamber and the pressure in the gas chamber is shown.

Diagram of forces on the floating piston of the gas chamber.
Using the ideal gas law, it is possible to deduct the expression of the pressure inside the gas chamber, which assumes a constant temperature,

Finally, knowing both the mass of gas piston

Bleed valve modelization
As mentioned in section ‘Total oil flow’, the magnitude of

Bleed valve: (a) ensemble of valve body and (b) cutting view of ensemble valve body.
The needle valve regulates the bleed area; this element is moved by a dial regulator at the rod that controls the position of the needle in the bleed orifice path, and changes in selector also permits increase or decrease in the area through the oil pass from one chamber to the other. The configuration can be set through a number of clicks. Zero clicks correspond to a completely closed bleed orifice, while the number of clicks is increased till moment when the bleed orifice is completely open. The effect of variation of opening the bleed orifice means that the larger the area is for passage of the fluid, the softer the damper will be and therefore less rigid, while the opposite case is when the area is decreased, both rigidity and hardness will increase.
When an external regulation on damper is used, the bleed orifice area has a different magnitude in the compression and rebound area, mainly due to changes in the geometric dimensions of these areas inside the rod. Also, the behaviour of the rebound stroke is influenced by the reservoir gas bottle affecting the behaviour of the bleed valve. Then, the need arises to consider the bleed valve area

where the area changes is a function of the number of clicks defined on the damper

However, due to the geometry and the type of valve that regulate the flow of the fluid and the possibility of changing the area via clicks, it is not easy to determine the effective area allowing oil to flow between the compression and the rebound chambers. For this reason, it is evident the necessity to use optimizations tools for determining the magnitude of

The parameters used for setting the toolbox of GAs are defined in Table 1.
Configuration parameters for toolbox (GA’s).
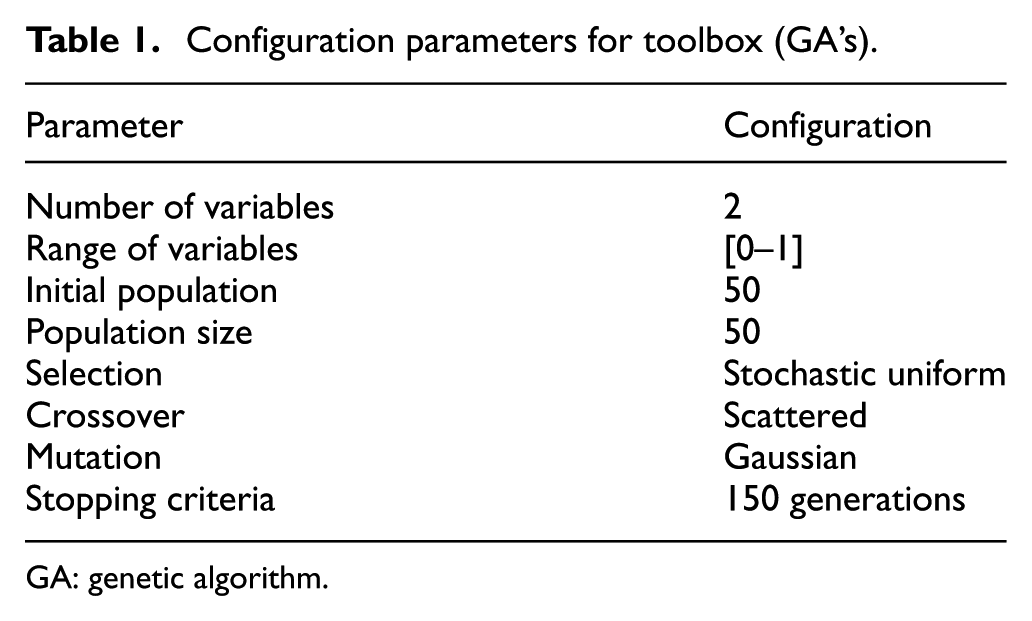
GA: genetic algorithm.
Figure 8 shows a process diagram of the operations of GAs within the bleed valve modelization; for this purpose, the damping force (F) generated by the shock absorber, velocity (V) and displacement (D) of piston are used as input parameters. Then, a comparison between the experimental data and the results obtained by simulation from the proposed model is described. The process is repeated according to the population size and the number of generation; the results of parameters with best fitness are introduced into the proposed damper model to obtain the damping force. The full process is repeated for each configuration in the rod selector of the damper, while gas bottle selector in defined in a unique position.

Schematic operation of the genetic algorithm in the damper model.
Experimental results
For the experimental results, a hydraulic telescopic monotube shock absorber is used, specifically Öhlins S46WR1C1 damper, as shown in Figure 9(a). The main advantage of this type of damper is that it can be assembled and disassembled as many times as necessary depending on the setup defined. This allows any variation of the setup to be measured into the internal structure of the damper.

(a) Öhlins monotube damper and (b) section view of Öhlins monotube damper, piston valve, gas bottle selector and shaft selector.
Possible changes contemplate on the damper structure are set mainly via changes in four elements (see Figure 9(b)); the first and second elements are shaft and gas bottle selectors, respectively, and the third element is the piston valve. The configuration in this element is shown in Figure 10. Finally, the last element to set is the gas pressure inside the reservoir gas bottle; this parameter was defined in 16 bars. 18

Piston installed on the damper rod: (a) compression area, (b) rebound area and (c) shims.
In order to determine the performance of Öhlins S46WR1C1 damper, a sinusoidal controlled damper piston displacement for different number of clicks on the rod selector is introduced. Figure 11 shows the Öhlins shock absorber installed on the damper test machine. In the machine, a hydraulic actuator is employed to drive the shock absorber from sinusoidal displacement cycles with amplitude of 0.03 mm and frequencies of 0.5, 1 and 1.5 Hz. These values allow the damper to work in similar conditions of a vehicle suspension due to the road irregularities. 19 The damper stroke was positioned at its centre before the test was carried out to avoid the extreme positions of the damper stroke. The damper test machine is equipped with a displacement sensor to measure the displacement of the damper piston and a load cell to measure the output force. The signals of displacement and force are sampled at the rate of 1 kHz, while the velocity of the test is obtained from the derivative of displacement with respect to time.

S46WR1C1 Öhlins damper installed on a damper test machine.
The nominal parameters of the tested shock absorber and its configuration are provided in Tables 2 and 3. The configuration of the bleed valve orifice is set for different positions in the rod selector (from 0 to 21 clicks). Number of clicks corresponds to the range of options when the orifice with the needle is fully opened (to fully open the orifice, 21 clicks are needed) and when the orifice with the needle is fully closed (0 clicks). Then, it is necessary to test each configuration on rod selector in order to determine the influence of these changes in the bleed orifice area on the damping force. In relation to the shim stack configuration, as detailed in Table 2, the damper setting is included in the list of options of the manufacturer.18,20
Nominal parameters of damper setup.

Nominal parameter of damper test.

During tests, the damper operating conditions are taken into consideration, and the initial and final temperatures are controlled; changes in damper temperature during each test did not exceed 2° between the start and end of each test. This information allows us to consider that for a specific number of cycles, the influence of temperature can be neglected as indicated by Baez 15 and Ramos. 16
Bleed valve results
Using the process described in Figure 8, the values
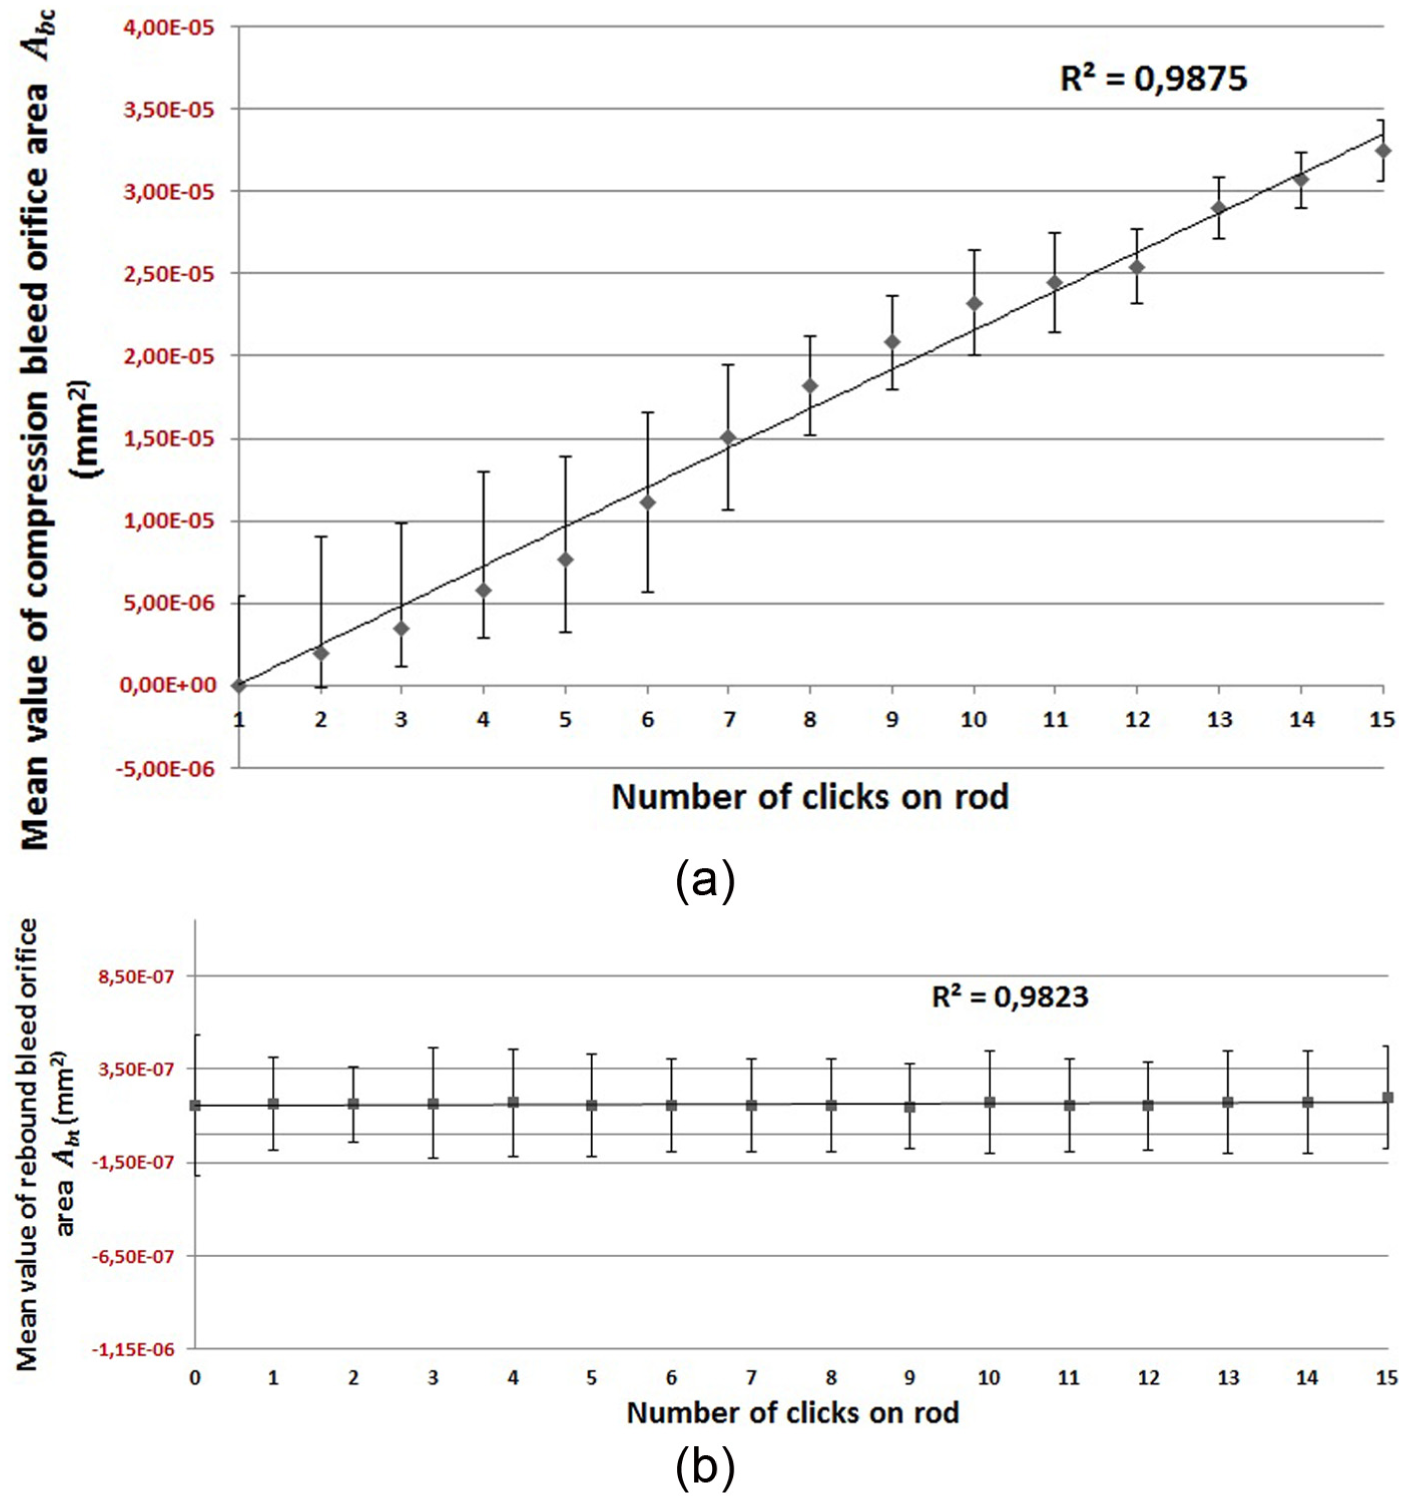
(a) Determination by AG’s of compression bleed area: (a)
The behaviour of the parameter

where n represents the number of clicks on the rod selector. With respect to the behaviour of the parameter

Model validation
Once the parameters
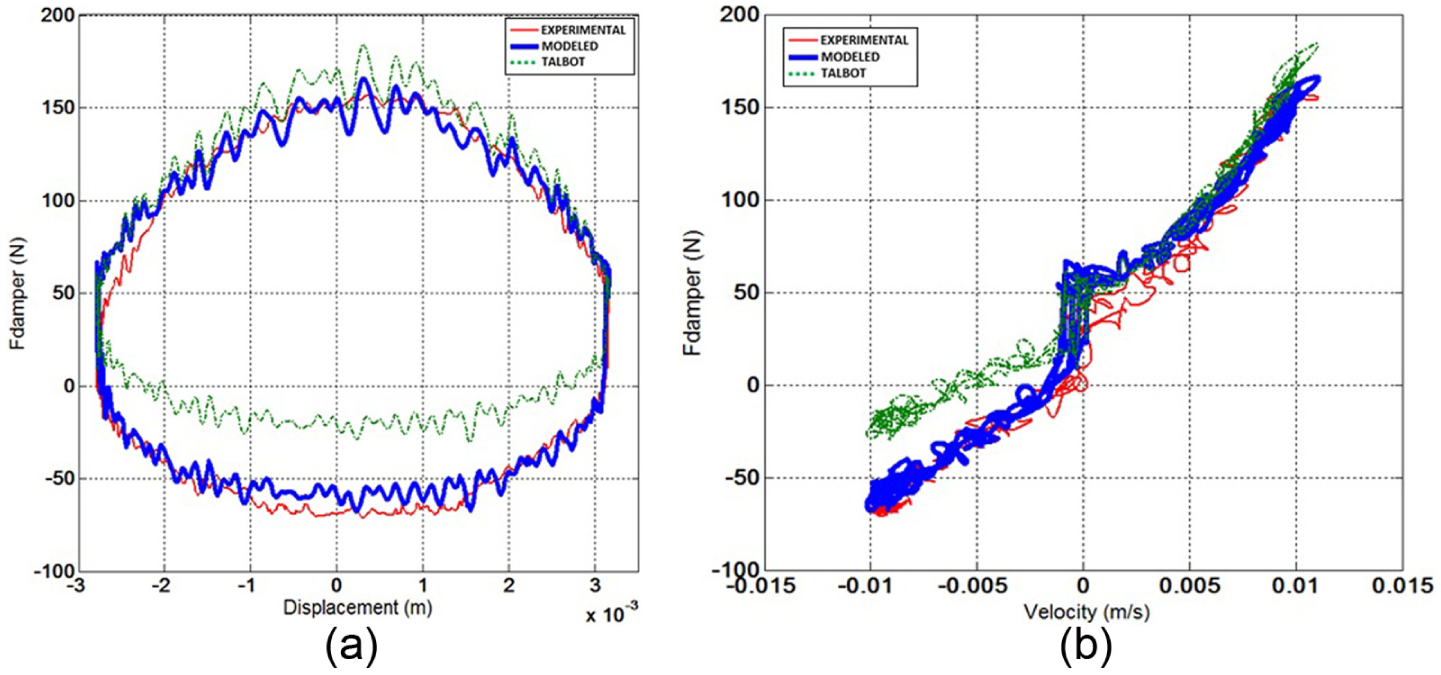
Comparison of experimental results vs model proposed for a damper with 7C-7R configuration, range = 0.03 m, frequency = 0.5 Hz, 5 clicks. Experimental results (red), results obtained from model proposed in this work (blue) and results using Taboltt’s model (green).

Comparison of experimental results vs model proposed for a damper with 7C-7R configuration, range = 0.03 m, frequency = 1 Hz, 10 clicks. Experimental results (red), results obtained from model proposed in this work (blue) and results using Taboltt’s model (green).

Comparison of experimental results vs model proposed for a damper with 7C-7R configuration, range = 0.03 m, frequency = 1.5 Hz, 15 clicks. Experimental results (red), results obtained from model proposed in this work (blue) and results using Taboltt’s model (green).
From Figures 13–15, it is possible to see how the damping force obtained from the proposed model has a similar behaviour to the experimental results for all damper configurations tested; in particular for Figure 13, the presence of a hysterical behaviour is also simulated. The noise obtained for the proposed model is produced for the real input signal used for simulations. Comparing the results from Talbott model, two adjustment regions are clearly presented. The first region is observed during the compression strokes where the results obtained by the model are similar to the experimental results for most of the stroke. The second region represents the rebound stroke. A discrepancy is reflected during the whole stroke between the experimental results and the results of the Talbott model.
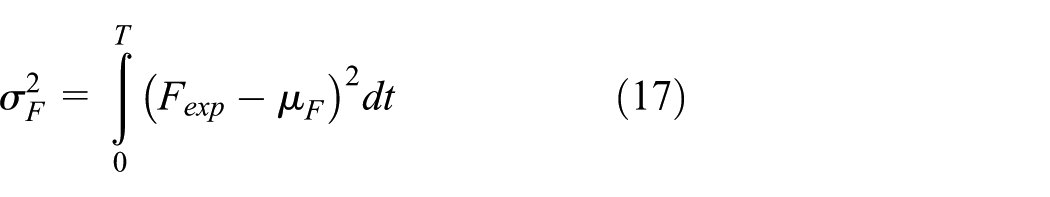
In addition to the superiority of the graphical results obtained from the proposed model, an analysis of errors for different excitation conditions has been accomplished. The following equations were used to represent the errors as a function of time, displacement and velocity, respectively21,22


where


where
The error results are shown in Table 4. The error results are also compared with the errors in the Talbott model. It can be seen that a good performance of the model proposed by this work exists comparing with the model proposed by Talbott.
Error results for both models, Talbott and proposed.

Quarter-car model simulation
Once the model proposed in this work is validated, the integration of the shock absorber model developed into a simpler quarter-car model, which will let us to evaluate two aspects of the suspension system. The shock absorber model influences the sprung mass vertical acceleration and the influence of bleed orifice of the damper.
In the quarter-car model, the sprung mass and the unsprung mass are rigid bodies with a defined mass ms and mu, respectively. The suspension between these masses is modelled using both a spring element and a mathematical algorithm which simulated the damper behaviour. For this purpose, the shock absorber model presented in this work is used; by this way, the setup of the high-performance damper, the clicks of the bleed orifice and the position of the rod during the stroke are parameter taken into account (Figure 16).

Coupling of quarter-car model with shock absorber model.
The representative parameter values for the quarter-car model simulation are shown in Table 5.
Parameter values for the quarter-car model simulation.

The assumptions of a quarter-car modelling are as follows: the tire is modelled as a linear spring without damping, there is no rotational motion in wheel and body, the behaviour of spring is considered linear while the influence of the damper depends of its configuration, the tire is always in contact with the road surface and the effect of friction is neglected so that the residual structural damping is not considered into vehicle modelling. 19 The equations of motion for the sprung and the unsprung masses of the quarter-car model are given as follows


where
Road surface signal
The input signal to the quarter-car model simulation will be the roughness of the road’s surface, which is the main disturbance into a vehicle system. A typical road is characterized by the existence of large isolated irregularities, such as potholes or bumps, which are superposed to smaller but continuously distributed profile irregularities. The ISO 8608 standard has proposed a road roughness classification using the power spectral density (PSD) values as shown in the Table 5. Typical roads are grouped into classes A–H. However, paved roads are generally considered to be among road classes A–D. The signal from the road and its roughness are modelled using the work presented by M Agostinacchio.
23
This study simulates profile roads for vehicles that travel with a constant horizontal speed
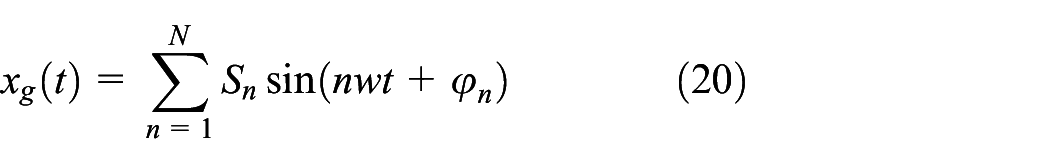
where

are the amplitudes of the excitation harmonics which are evaluated from the road spectra selected,

Assuming that the road irregularities possess a known single-side PSD, the parameter Sg can be found. The geometrical profile of typical roads fits sufficiently and accurately the following simple analytical form

where
Parameter values for the quarter-car model simulation.

The ISO classes of considered profiles are A, B, C and D which correspond to normal roads where high speed can be reached and maintained by vehicles. Beyond that value (in case of E profile), it is reasonable to assume that this type of road surfaces are characterized by a damage degree high enough that they require being travelled at very low speeds, and are so unsuitable for the safe transit of vehicles. The vehicle behaviour along a road section with a characterized roughness is determined by the study of the forced oscillations. As indicated in equation (22), the behaviour of the road section depends on the velocity of the vehicle during the simulation. Therefore, a range of speeds is defined 20–120 km/h for each road class simulation.
The analysis of sprung mass acceleration and the effect of the bleed valve orifice of the shock absorber on the dynamic behaviour of the sprung mass are shown in Figures 17 and 18. These results are obtained for the same speed (20 and 120 km/h) and road profile (road class A), while the configuration of the bleed valve (clicks on the rod) is changed following the setup used during the model validation in section ‘Model validation’.

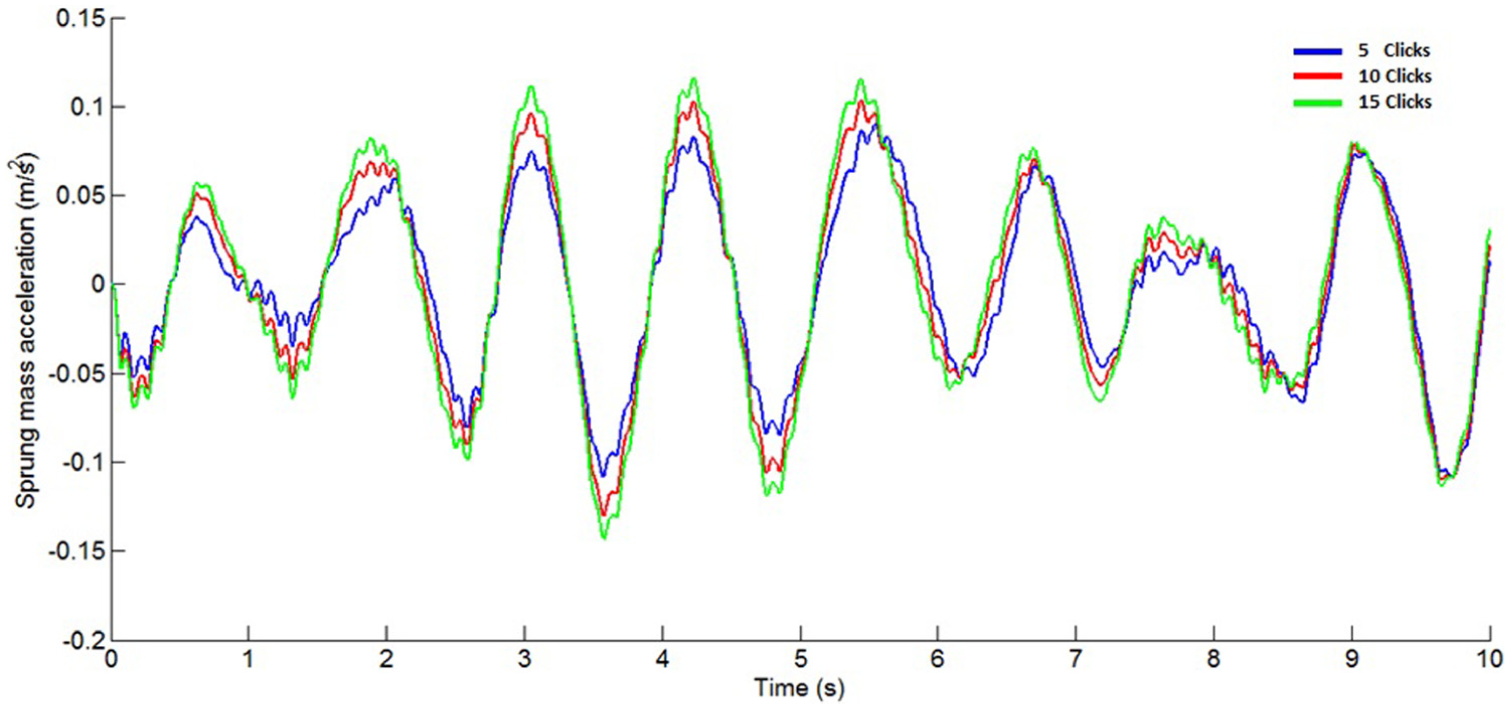
Sprung mass acceleration for 5, 10 and 15 clicks on the rod selector. Road class A and velocity 20 km/h.
Sprung mass acceleration for 5, 10 and 15 clicks on the rod selector. Road class A and velocity 120 km/h.
In Figures 17 and 18, the acceleration of sprung mass in the quarter vehicle simulation changes for each bleed valve configuration on the damper. The results show that the acceleration of the sprung mass diminishes as the number of clicks in the selector rod decreased. As it was previously demonstrated during experimental results, the performance of damper changes according to the clicks established in the rod selector. Consequently, the damping force produced by the damper increased as the clicks on the rod selector decreased.
PSD and root mean square analysis
The vehicle behaviour along a road section with a characterized roughness is determined by the study of the forced oscillations. Then, the frequency analysis of sprung mass acceleration shows the effect of the bleed valve orifice of the shock absorber on the dynamic behaviour of the sprung mass. A comparison between the spectral density functions (PSDs) of the sprung mass is presented in Figure 19. Plots contain simulations for the same velocity and road class, but different damper configuration according to the tested quarter-car model (5–10–15 clicks). PSD function is considered for frequencies between 0 and 20 Hz, while the total range of acceleration changes in each plot according to the velocity of the simulation and road class introduced in the model.
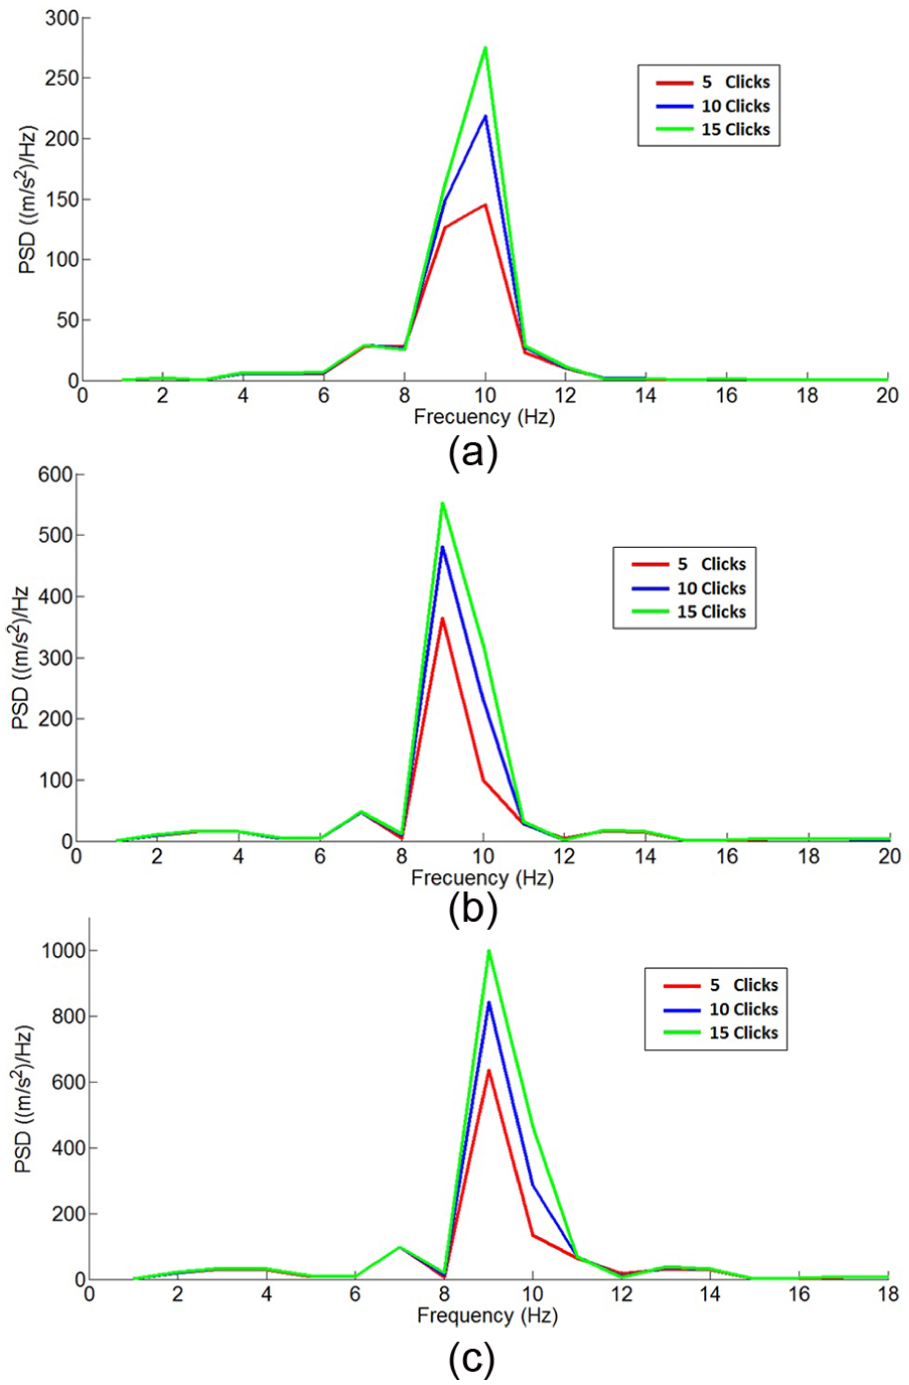
Sprung mass acceleration for 5, 10 and 15 clicks on the rod selector. Road profile type (A); (a) 20 km/h, (b) 60 km/h and (c) 120 km/h.
Results of sprung mass acceleration spectrum led to the same conclusion (Figure 19); changes in bleed orifice area via rod selector affect the behaviour of vehicle suspension. With respect to the road range of excitation considered, for each road class, the lowest values of the PSD of sprung mass acceleration were ensured by the shock absorber with the lowest number of clicks on rod selector.
In Figure 19(a)–(c), the representation of the characteristic frequency is close to 10 Hz, where the signal gain depends on the configuration of the number of clicks on the damper for all cases modeled; the lower peak of gain is obtained for a configuration of 5 clicks. Also, new frequencies between 0 and 8 Hz corresponding to excitation frequencies appear, as the speed of the vehicle on the road increases. The magnitude of these frequencies is lower than the characteristic frequency of the system. According to the ISO 2631-1 norm, 24 passenger comfort principally depends on root mean square (RMS) value of acceleration and the frequency of vibrations acted on his or her body. So, the RMS value of the sprung mass acceleration is determined by means of equation (24)

where
Root mean square (RMS) at different velocities, road profiles and bleed valve configurations.

The RMS results of the quarter vehicle simulation increases with a mean value from 0.031 to 0.323 for 20 km/h and from 0.055 to 0.563 for 120 km/h, as the road class used for input signal is intensified. In the same way, for the same road profile, the RMS increases, as the vehicle speed increases; however, the variation of the RMS for the latter case is lower compared to the variation obtained for different road profiles. These results are contrasted with the work presented by D. Sekulić. 25 As an example from results and a way to analyse both cases is to compare the RMS obtained between simulation of 120 km/h with Road A and 20 km/h with road B; this magnitude is similar (0.061), so despite being in different conditions of velocity and road profile, the comfort of passengers on both cases can be considered the same in terms of RMS.
Figure 20 graphically shows a comparison between RMS obtained from simulations for each speed; the magnitude of RMS increases as the speed of simulation increases. However, for all cases at speeds between 80 and 120 km/h, the system presents variations in RMS behaviour. This situation is generated by the presence of resonance frequencies as shown in Figure 20(a) and (b).

RMS value in function of velocity for 5, 10 and 15 clicks on the rod selector. Road profiles: (a) ISO A, (b) ISO C and (c) ISO E.
The influence of changes in the number of clicks of bleed orifice is evident for both cases: increasing speed and changing of road profile. During simulations, the value of RMS decreases as clicks on the rod selector diminishes. These changes are significant at high-speed regimens and for roads with high irregularities; the maximum variation is close to 8% corresponding to road class type E and a velocity of 80 km/h. However, to evaluate the influence of bleed orifice on damper performance, it is necessary to compare the RMS obtained for each damper configuration during the same signal inputs. Therefore, after analysing the results obtained from Table 4, the lowest magnitude of RMS is obtained for a configuration of 5 clicks corresponding to the configuration with highest damping force; for this reason, a comparison between RMS results of 5 clicks is carried out with respect to 10 and 15 clicks.
RMS results at different road class and for the same velocity show that maximum difference in RMS was 28% corresponding to the simulation at 60 km/h and road profile type C. This difference decreases between the configurations (5, 10 and 15 clicks) as the variation on the profile road grows. For all cases (road profiles and velocities of simulations), the variation at E profile does not exceed 8%. Also, RMS results at different speed regimens and for the same road profile show that maximum difference obtained was 30% corresponding to the simulation at 60 km/h and road profile type C. In this case, RMS difference between the configurations (5, 10 and 15 clicks) decreases as the variation in the profile road grows. For both comparatives, RMS differences decrease for increasing speed, where variations between configurations clearly indicate that variations are inversely proportional to the speed of vehicle.
Conclusion
This work presents a new damper model based on Talbott’s model. The novelty of the proposed model is that it takes into account the influence of the bleed orifice area for both rebound and compression strokes. The bleed orifice area changes for each configuration of rod and gas bottle selectors, where the setting of each selector can be done separately. The estimation of this area is carried out through GAs using experimental data for different damper configurations. Results show that the proposed model has a better accuracy in comparison with Talbotts’s model. The enhancement percent with respect to Talbott’s model is obtained with errors as function of time, displacement and velocity. Errors are reduced with a mean value of 21%, 20% and 24%, respectively.
The combination of both, proposed model and quarter-car simulation, allow us to analyse the influence of bleed valve area in the vehicle dynamics. The results show that the acceleration of the sprung mass diminishes as the number of clicks in the selector rod decreases. The reason of the sprung mass acceleration changes is due to the variation in the damping force generated by damper with each tested configuration. The effect of changes in the bleed orifice area can affect the sprung mass acceleration about 20%. For all cases of quarter-car simulation, lowest values of the PSD of sprung mass acceleration were obtained by the shock absorber with the lowest number of clicks on rod selector corresponding to 5 clicks. By contrary, highest value of PSD were obtained for the configuration of 15 clicks. The maximum difference between those configurations was 60% corresponding to the road class E and velocity of 120 km/h.
Footnotes
Academic Editor: Daxu Zhang
Declaration of conflicting interests
The author(s) declared no potential conflicts of interest with respect to the research, authorship, and/or publication of this article.
Funding
The author(s) received no financial support for the research, authorship, and/or publication of this article.