
Abstract
Riveting parameters have significant effects on the material growth/material expansion and quality of a joint. However, the inhomogeneity of material growth leads to assembly deformation and degrades the dimensional accuracy of the final products. This study aims to propose an integration method to optimize riveting parameters using finite element method and Kriging metamodels with particle swarm optimization in slug rivet joint. Five key process parameters were considered in this article, including squeezing force, buck cavity, upsetting rise time, upsetting dwell time, and clamping force between sheets. First, a quarter three-dimensional finite element model was established to acquire the simulation results of rivet hole expansion and sheet bulging value. Based on the finite element method results, Kriging surrogate models were built to reflect the mapping relationship between process parameters and the focused target. Subsequently, a multi-objective optimization method, particle swarm optimization, was used to search for Pareto-optimal solution. Finally, by comparing the assembly deformation with 10-rivet coupons, the results showed that the optimized riveting parameters could improve the deformation homogeneity.
Keywords
Introduction
Riveting still remains the most popular and basic method for assembly of the large aircraft structures, such as fuselages, wings, horizontal stabilizers, and vertical stabilizers. One undesirable effect of the riveting process is the assembly deformation that can be generated and, sometimes, resulting in large deformation of the parts. 1 In general, aircraft structures assembly involves hundreds and thousands of rivets. The local joint deformation induced by each riveting process transmits its stress and strains to the whole structure, and a cumulative deformation occurs unavoidably. 2 In some cases, the material growth/cumulative deformation are too large, and it is difficult or even impossible for the subassemblies to be joined to form large assemblies. More seriously, it affects the aerodynamic performance of the aircraft. The material growth is determined directly by joint material, geometry, process parameters, and residual stress. Of these, the joint material and geometry are difficult to control, which are given by the designer. The residual stress state is influenced by the three former factors. Hence, it is essential to study and control the deformation by optimizing the riveting parameters.
A number of parameters associated with the riveting process affect the equality of formed rivets and integrity of the final assembly product. 3 With the application of automation equipment, the parameters can be controlled more accurately and precisely. For example, in a fully automated G86 C-frame riveting machine, the process parameters for a slug rivet are squeezing force, buck cavity, upsetting rise time, upsetting dwell time, and clamping force between sheets. Significant research has been conducted on the quality of riveted lap-joints resulting from process parameters. Experimental method is the direct and effective means to observe the effect of riveting parameters. Müller 4 found that a nonlinear relationship was exhibited between squeezing force and driven head diameter obviously; moreover, the fatigue life improvements with approximately 10 times can be obtained by increasing the force. The similar findings are also mentioned by De Rijck et al. 5 Diffraction method and micro-strain gauge are the useful techniques to measure the residual stress and strain in and around the rivets and plates. Using these methods, Li and colleagues6–8 found that squeezing force was the most important factor in the riveting process, and the finite element method (FEM) results were consistent with experimental results. Furthermore, the riveting force was reported to have a considerable effect on rivet quality through riveting process experiments conducted by Liu et al. 9
In addition, FEM is widely used in riveting process simulation, and some important conclusions have been drawn. Combining FEM with statistical analysis, Cheraghi 10 investigated the factors of squeezing force, rivet dimension, and hole diameter tolerance and found that reducing the countersunk depth ensured a higher level of rivet quality with no gap between the rivet and hole. Aman et al. 3 used the FEM to analyze the effect of riveting sequence, rivet pitch and gap between sheets on the residual stresses, material growth, and bulging. Atre and Johnson 11 studied the impact of interference sealant on the induced stresses. It was found that the residual hoop stress increased in the majority situation with sealant in comparison to the results without sealant. The study by Li 12 revealed that non-uniform expansion occurred on the riveting hole after being cut through the center plane of riveted joint. The sheet material, which was very close to the hole side, was actually compressed rather than expanded due to the compression from the bottom of the rivet head. C Zeng et al. 13 studied the initial fit tolerance and squeeze force on the effect of residual stress. The non-uniform expansion along the axis of the hole was observed to result in non-uniform distribution of through-thickness stress. Abdelal et al. 14 reported the effect of the riveting factors, such as head die design, impact force, rivets pitch, and material type on the panel deformations. The results showed that the panel growth depends on the rivet pitch distance, the material of the stiffener, as well as the manufacturing loads.
Some researchers combined elastic-plastic mechanics and thin-walled theory to reveal the riveting forming mechanism simply, such as rivet deformation modeling, 15 stress and stain analysis of sheet metal, 12 and squeezing force computation. 16 Wang et al. 17 studied the mechanism of riveting-induced deformation in the slug rivet installation process. However, the riveting process is a highly complex nonlinear behavior, which restricts the application of theoretical methods. FEM is an efficient approach to study the riveting process, which has been widely employed and verified in engineering application. Numerous numerical simulations are time-consuming and laborious, hence designers are unwilling to use it. The metamodel is an efficient solution for this puzzling problem. To build the mapping relations between the process parameters and out response, many methods have been developed, such as response surface method (RSM), artificial neutral networks (ANN), and radial basis function (RBF). 18 Yang et al. 19 combined FEM with RSM to get optimized process parameters for deformation homogeneity and die under filling. Mandal et al. 20 adopted back propagation artificial neutral network (BP-ANN) to model the electrical discharge machining process and non-dominating sorting genetic algorithm-II to optimize the process. Jourdan 21 showed that Kriging model has higher accuracy in obtained fitting surface dealing with multi-dimensional and nonlinear problems. The riveting process is a nonlinear manufacturing process, like metal plastic forming. Kriging metamodel, as a global interpolation method, was applied to build the nonlinear mapping relationship between the riveting parameters and required response. However, the particle swarm optimization (PSO) algorithm, an evolutionary computation (EC) method inspired by flocking birds was utilized for multi-objective optimization. The particle in PSO did not use selection criterion in iterative procedure, which was different from other evolutionary algorithm. Therefore, population members would survive from the beginning to the end in optimization process. This algorithm has been successfully applied to solve many engineering problems. 22
Based on the above literature, it could be stated that their beneficial work was focused mainly on how the single factor, including geometrical and process parameters of riveting, affected the driven head dimension and induced residual stresses and fatigue performance in a rivet joint. Even though multiple factors are taken into account, the main concern is still the riveting quality, while their impact on the deformation homogeneity is seldom discussed. For the purpose of reducing global assembly deformation, it is essential to improve deformation homogeneity by optimizing riveting process at each local riveting location. The purpose of this article is to put forward a new method for identifying an optimal combination of the riveting parameters which could help to improve assembly homogeneity and to reduce assembly deformation. The method combined the FEM and Kriging to estimate the effect of riveting parameter on local deformation. PSO algorithm was applied to search for the Pareto-optimal solution. The proposed methodology was evidenced to be efficient and reliable. The sections are organized as follows: section “Approach of riveting parameters’ multi-objective optimization” introduces the proposed approach. Section “Riveting process modeling and evaluation of deformation” presents a three-dimensional (3D) finite element model. Section “Experiment design and Kriging prediction model” deals with Kriging metamodels construction and the significance level of riveting parameters on the out responses. Section “Optimization of riveting parameters using PSO” shows the multi-objective optimization of riveting parameters and validation experiment, and section “Conclusion” is the conclusion.
Approach of riveting parameters’ multi-objective optimization
The present work proposes an approach by integrating Kriging metamodel and PSO. Kriging metamodel is employed to build the nonlinear mapping relationships between the riveting parameters and riveting deformation; PSO is utilized to search solution sets and find Pareto-optimal solution. This multi-objective optimization process is shown in Figure 1. The procedure consists of the following steps:
Step 1. Identify the riveting parameters’ optimization problem including the objective function, the design variables, and upper and lower limits. The considered variables are squeezing force, buck cavity, upsetting rise time, upsetting dwell time, and clamping force between sheets. The output parameters are the value of hole expansion and sheet bulging. The purpose is to seek the uniform expansion value and minimum sheet metal bulging.
Step 2. Develop a 3D finite element (FE) model to simulate the effect of riveting parameters on the deformation.
Step 3. Determine whether the developed FE model is appropriate to simulate or not.
Step 4. Design the experiments to get sample point through constructed FE model. The optimal Latin hypercube is applied to generate sample points.
Step 5. Test the Kriging prediction model. If the established model has sufficient prediction accuracy, it could be used to riveting parameters optimization; if not, return to the previous step.
Step 6. Based on the constructed Kriging prediction model, the PSO algorithm is used to search the optimum solution sets.
Step 7. Perform the verification experiment to validate the feasibility of optimal results.

Flow diagram of multi-objective optimization.
Riveting process modeling and evaluation of deformation
FE model development
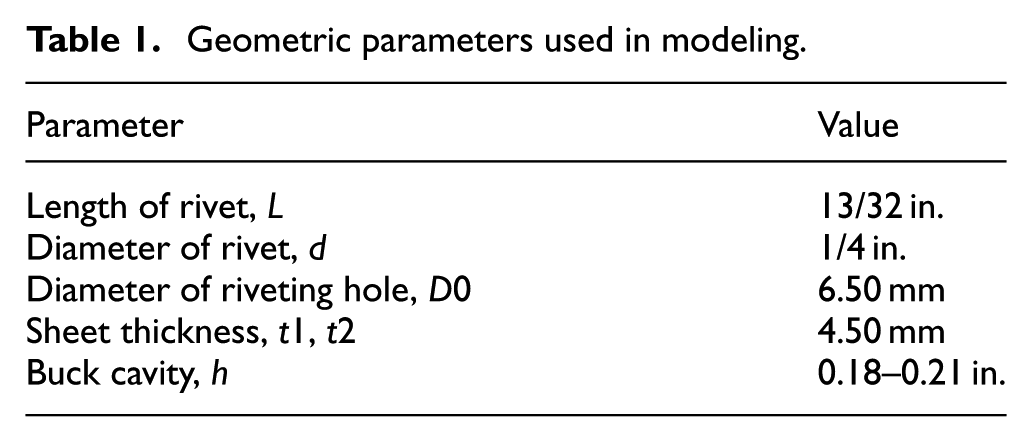
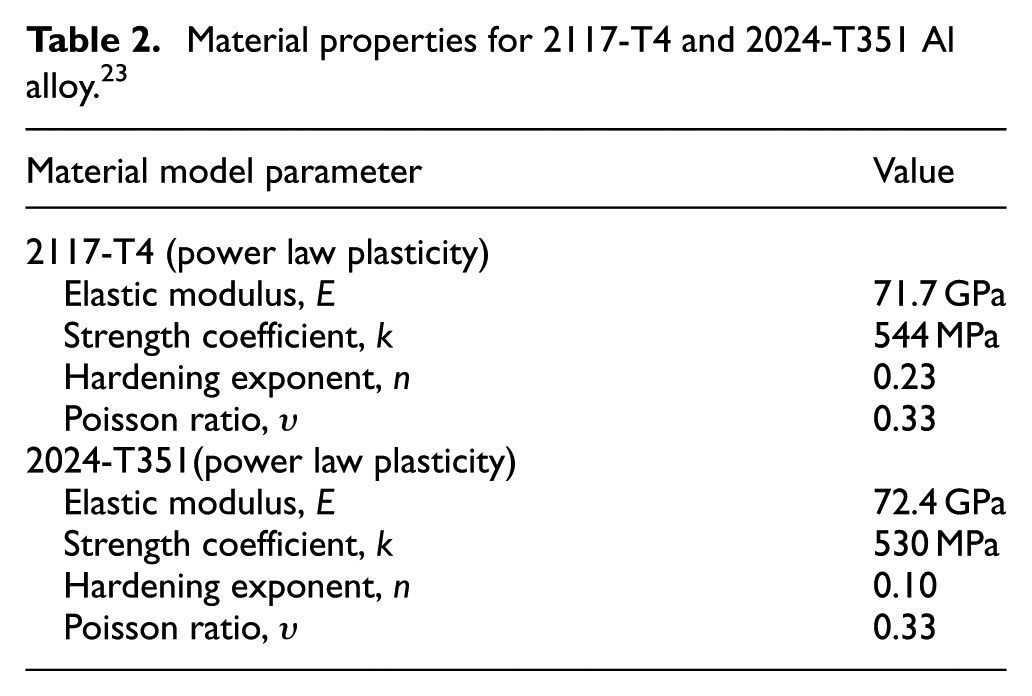
As a full-scale 3D FE simulation is very time-consuming, a quarter FE model was adopted. As shown in Figure 2, the FE model consisted of a standard 2117-T4 aluminum alloy slug rivet (NAS1321AD8E13) and two sheets made of 2024-T351 aluminum alloy, which was commonly used in aircraft manufacturing. More geometric dimensions of the model can be found in Table 1. The diameter of riveting hole was larger than the nominal diameter of the rivet for the ease of assembly. The riveting process is a kind of metal-flow problem, and nonlinear isotropic hardening material models are used in ABAQUS/Explicit analysis, as listed in Table 2. The used model included seven contact pairs, and the friction coefficient of 0.2 was specified for each of the contact interface. 13

FE model configuration.
Geometric parameters used in modeling.
Material properties for 2117-T4 and 2024-T351 Al alloy. 23
The riveting process was simulated in three steps: a loading step in which the rivet was deformed by the applied squeezing force, a keeping step in which the rivet tools kept static, and an unloading step in which the rivet was allowed to spring-back. By virtue of partition technique, a fine mesh density was used in the rivet and in the region of interest surrounding the rivet location, while coarser elements were applied in the remaining parts. The boundary conditions are shown in Figure 3, and detailed description can be found in another paper. 24
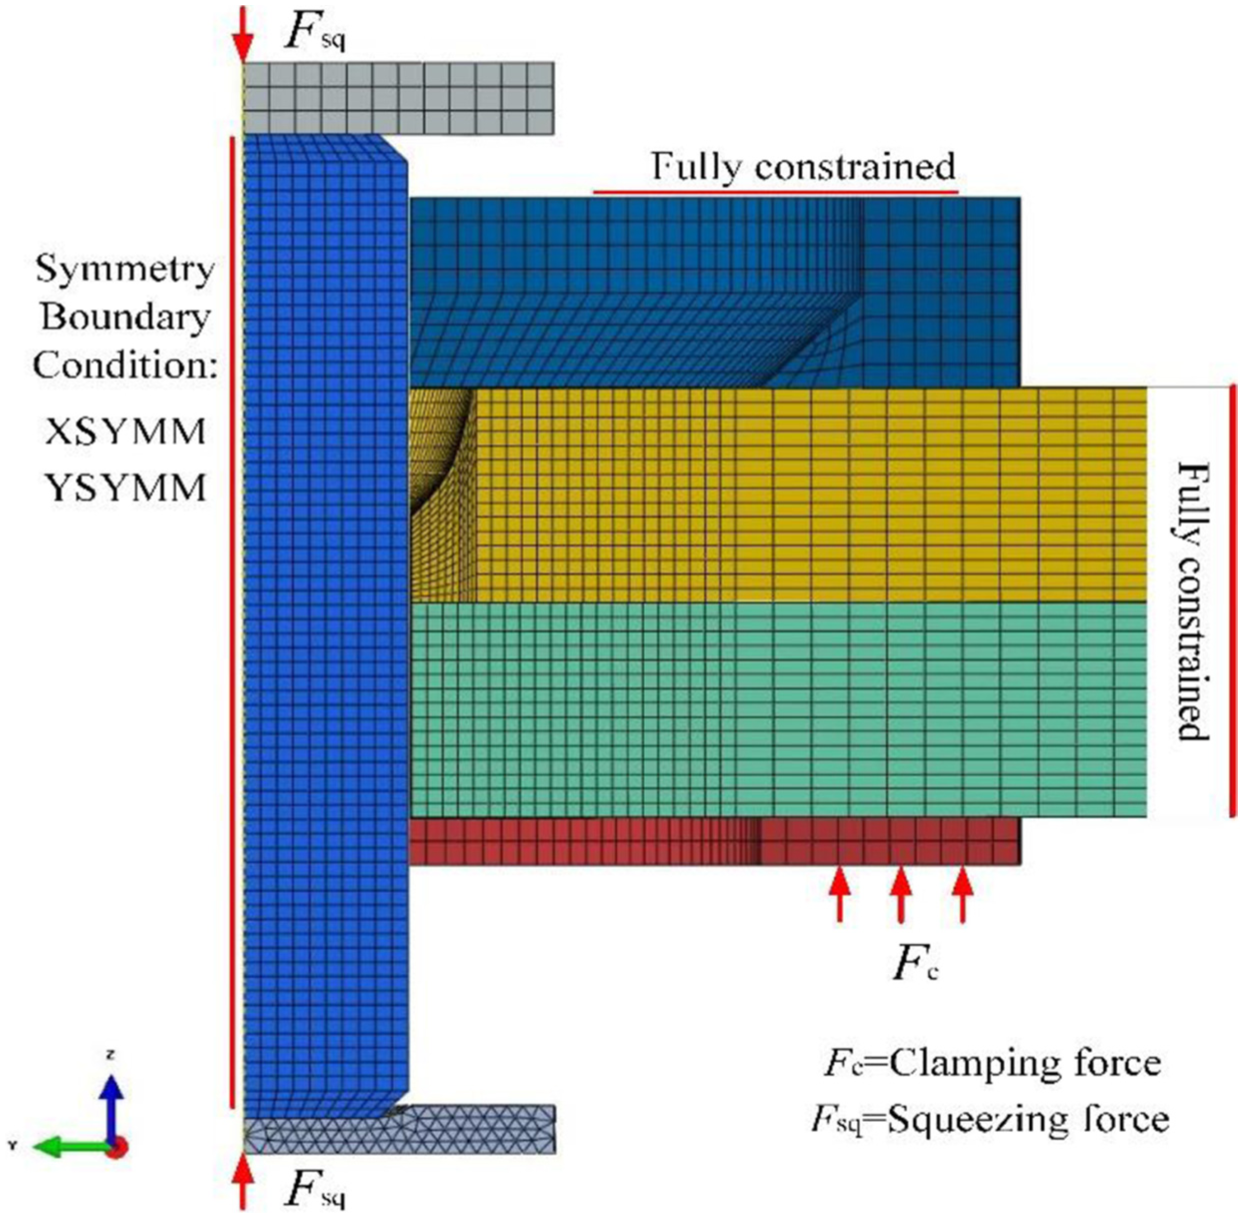
FE model with boundary conditions.
Verification of the FE model
The FE model has been validated in two aspects: (1) the dimension of formed head and (2) the interference value between rivets and riveting holes. The experiments for the validation of the FE model were performed in a fully automated G86 C-frame riveting machine, and the wire electrical discharge machine (WEDM) was used to cut the riveted joint coupons for measuring the interference level. The detailed validation procedure and results have been described in another article. 24 The comparative results showed that the simulation results matched the experimental results very well, even in detailed area. These results indicated the constructed base model can be applied for further analysis. Meanwhile, it was found that the interference value of formed head end was much larger than that of the countersunk end, and the interference value of the rivet exhibited a highly non-uniform distribution along the thickness direction.
Evaluation of deformation homogeneity
The interference fit is well known to improve the fatigue property of the riveted joints; however, the non-uniform distribution of interference fit results in joint deformation. The deformation will reduce the accuracy of aircraft product and impact on the subsequent assembly, so ensuring the uniformity is helpful to control deformation. Sheet metal local bulging 12 is unavoidable in the riveting process and could give rise to an unsmooth surface in the skin, which has a severe effect on the aerodynamic performance of aircraft. Furthermore, the bulging generated in outer sheet is also taken into consideration. Based on above description, a total number of 11 and 9 measuring points are distributed along the sheet thickness and in the outer sheet, respectively, to evaluate the expansion of riveting hole and bulging in sheet (see Figure 4).

Distribution of measuring points.
In order to assess the homogeneity of interference value distribution quantitatively, the coefficient of variance (CV) in the field of statistics was used, as expressed in equation (1) 25

where
Experiment design and Kriging prediction model
Experiment design
Five riveting parameters, namely, squeezing force, buck cavity, upsetting rise time, upsetting dwell time, and clamping force, are input variables. Two measured values of hole’s expansion and sheet bulging are chosen as the output variables.
The optimal Latin hypercube sampling (LHS) is widely used in design of experiment (DOE) by virtue of its advantage of nonlinear fitting. This article adopted LHS for DOEs to build the mapping relation between input variables and output variables. For simplicity, factors A, B, C, D, and E are used to represent squeezing force, clamping force, buck cavity, upsetting rise time, upsetting dwell time, respectively. The limit of riveting parameters is listed in Table 3. Based on the same base model, 50 groups of process parameters are generated through the LHS algorithm using software MATLAB, which compliance with the maximization minimum distance rule. The simulated results for these process parameters combinations are shown in Table 4. A preliminary quality check was carried out for all 50 models to make sure the formed rivets meet the quality requirements, which are specified in the Aircraft Manufacturing Handbook. For the instance referred to in this article, the minimum dimensions of formed head diameter and formed head height are 0.322 in. and 0.068 in., respectively. Moreover, the interference value is within the limit range in certain position.
The ranges of riveting parameters.

The simulation values of 50 sets of sample points.

Modeling of Kriging metamodels
Kriging metamodels, a spatial correlation modeling technique, was originally developed in geostatistics by the South African mining engineering called Krige. 26 Due to its excellent approximation capability and unique error estimation function to nonlinear functions, the Kriging is one of the most representative and promising methods of metamodels and widely studied and used in many areas. The detailed theoretical information and modeling process are described in Jiang et al. 18
Using Isight 5.8, the Kriging metamodels are constructed between the input parameters and output parameters. In this article, anisotropic fit is employed as the Fit Type, and a Gaussian correlation function is applied for the global. The filter distance is set to 5.0e−4, and the maximum iteration to fit is 1000. A total of 50 groups of simulation results (nos 1–50) are utilized to build Kriging prediction model. The established Kriging prediction models for hole expansion homogeneity and bulging value (represented by letters CV1 and M, respectively) are demonstrated in Figure 5. For simplicity, factors C and D are selected as fixed value. Six sets of sample points (nos 5, 15, 25, 35, 45, and 50) are randomly used to test the fitting accuracy of models. Comparison of the simulation results and prediction results is depicted in Figure 6. The agreement between the numerical predictions and the predicted results is good. The average errors of Kriging prediction models for CV1 and M are 1.48% and 0.5%, the biggest errors for CV1 and M are 6.1% and 1.2%, respectively. The relative errors are in an acceptable range. Therefore, it indicates that the Kriging prediction models are credible and could be used for further analysis.
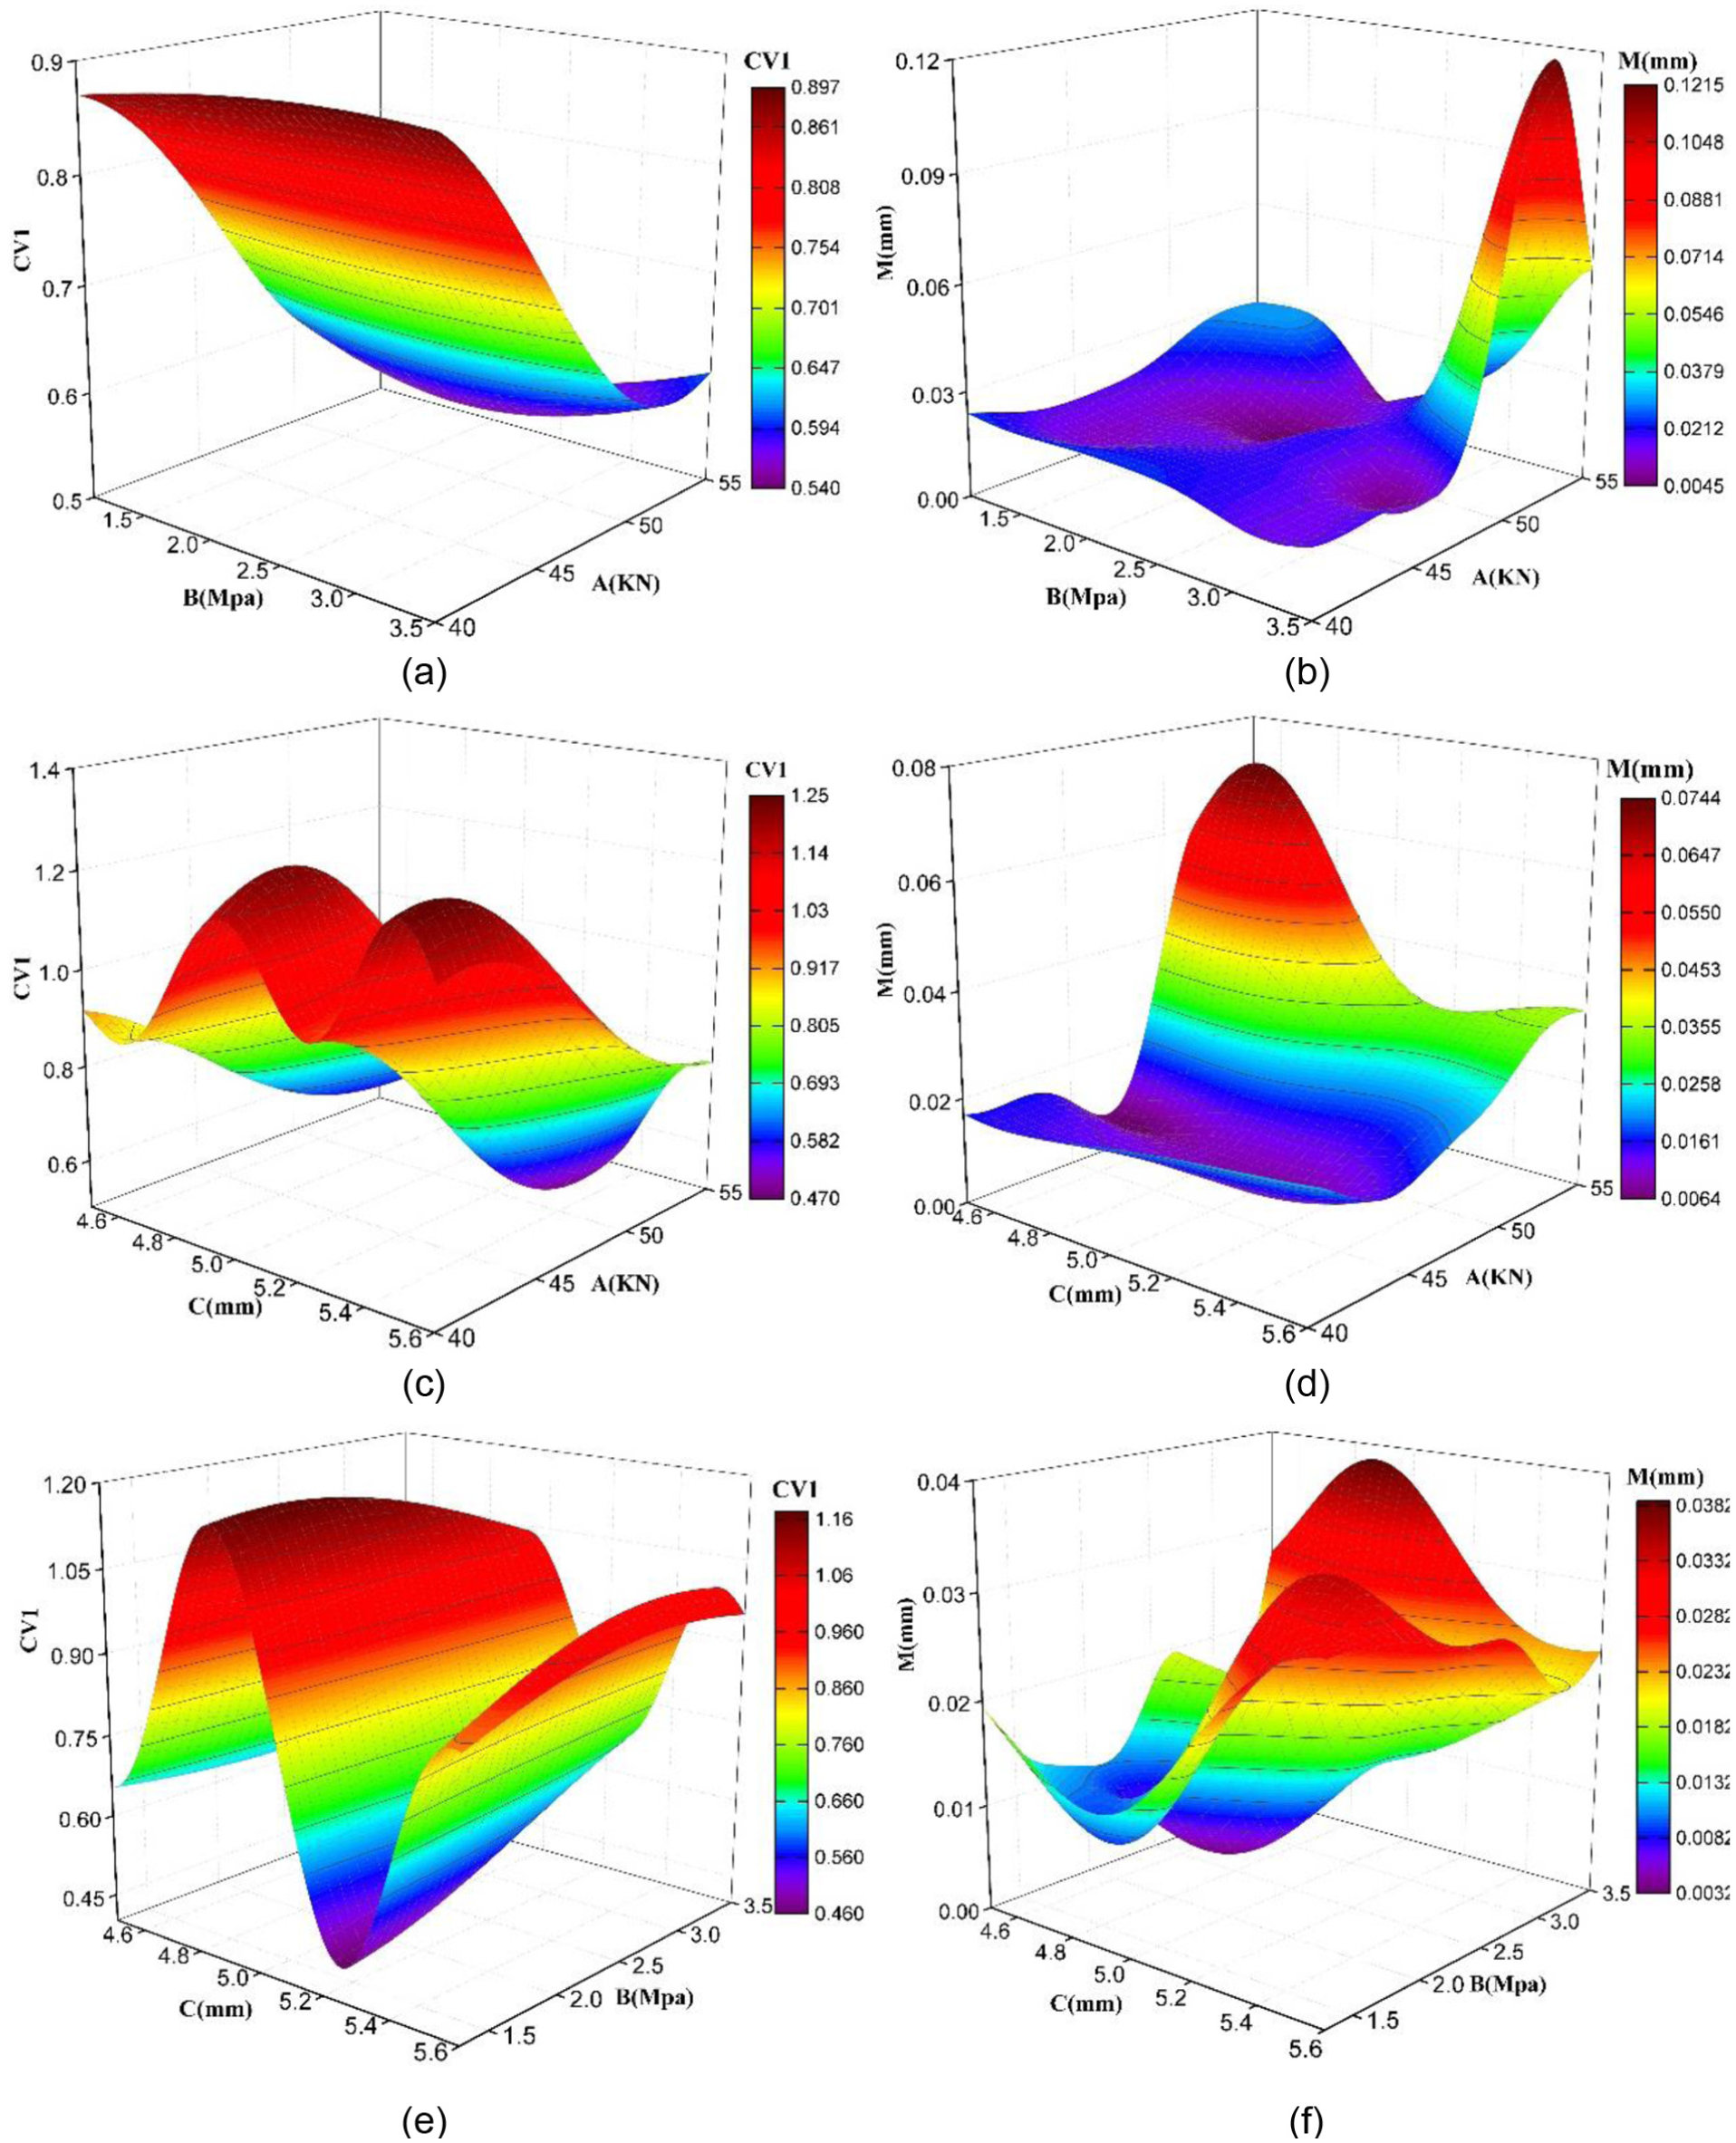
Kriging metamodels for (a) CV1 and (b) M (C = 4.6 mm, D = 0.1 s, E = 0.05 s); (c) CV1 and (d) M (B = 2 MPa, D = 0.1 s, E = 0.05 s); (e) CV1 and (f) M (A = 45 kN, D = 0.1 s, E = 0.05 s).

Comparison of the simulation results and prediction results: (a) CV1 and (b) M.
Main effects and contribution rate analysis of multi-parameters
The main effect of a factor on the response is defined as the average value of all tests in a certain level. The main effects of factors can be obtained via analysis of variance (ANOVA). 27 The graph of main effects of each process parameters on local deformation is depicted in Figure 7. As plotted in Figure 7(a), CV1 decreased with the increase in factors A and C. Besides, as factors B, D, and E increased, CV1 first increased and then decreased. From Figure 7(b), it was observed that the bulging value (M) would first drop and then increase rapidly from the median of factor B. M increases linearly with the factor E. M had an ascending tendency as factors A and C increased, while a downward trend was exhibited to factor D.

Main effects of each process parameters on hole expansion and bulging value: (a) main effects on CV1 and (b) main effects on M.
In order to identify the significance of the riveting parameters and their interactions effect, the Pareto Graph is conducted using Isight 5.8. As illustrated in Figure 8. The blue bar (positive correlation) shows that the riveting parameters have a positive effect on the target value, while the red exposes a negative effect. In Figure 8(a), it could be concluded that A–D has the largest positive impact (14%) on CV1, while E 2 , A–C, A, A–B, and D 2 have the most influential negative effect on CV1 with a percentage of nearly −13%, −12%, −11%, −8.5%, and −8%, respectively. In Figure 8(b), it was observed that the factor A–B has the most significant contribution rate to M (about 13%), and the factors B 2 and A have positive contribution rates to M with a percentage of approximately 8.5% and 7.8%, while A–D and B–D have the largest negative effect on M with a percentage of −12.5% and −10%, respectively. Other factors affect M with a percentage of nearly or under 6%.

Importance level of the process parameters to CV1 and M: (a) contribution rate to CV1 and (b) contribution rate to M.
Optimization of riveting parameters using PSO
Description of optimization problem
In this article, the purpose of riveting parameters optimization is to obtain minimum CV1 and M simultaneously, which is a multi-objective optimization problem. The formulation of the process optimization can be expressed as follows


As discussed in section “Main effects and contribution rate analysis of multi-parameters”, conflicts exist between the two objectives. The optimization problem in equation (2) generally gives rise to a set of optimal solutions instead of a single optimal solution. 28 The set of solution is known as Pareto-optimal solution. In the absence of any further information, one of these Pareto-optimal solutions cannot be said to be better than the other. In this section, PSO algorithm is applied to solve the riveting process parameters’ optimization problem and obtain the Pareto-optimal front. The setting parameters for the PSO in software Isight 5.8 are listed in Table 5. The adaptive values of CV1 and M in PSO optimization process are calculated by Kriging prediction models developed in section “Modeling of Kriging metamodels.”
Setting parameters for PSO.
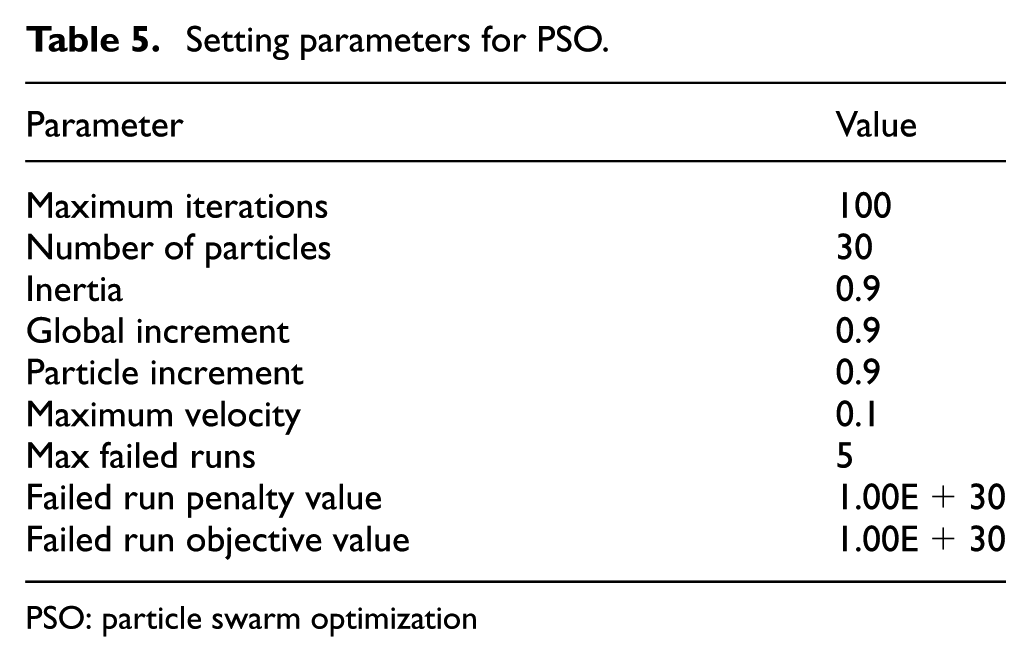
PSO: particle swarm optimization
Optimization results
The Pareto-optimal front for CV1 and M is plotted in Figure 9. Each point in Figure 9 means a specific solution, which represents a corresponding group of riveting parameters. The engineering technicians can select the optimal solution according to the design requirements. As shown in Figure 9, the maximum M obtained is 0.012 mm, while the minimum CV1 is nearly 0.41 correspondingly. If the M value decreases, the CV1 value will rise. So, the optimal solution for two targets has conflicts, the tradeoff of between them is needed. In general, the hole expansion CV1 is the first target to consider when the local bulging is within the range of design limit because the hole expansion has an considerable impact on the local bulging in turn.

Pareto-optimal front for CV1 and M.
Verification
In order to validate the effectiveness of optimized results, two solutions (see Table 6) in the Pareto-optimal front are selected to conduct the riveting experiments. Considering that the deformation in single rivet joint is less obvious than that in multiple joint, 10-rivet coupons are chosen for enlarging the deformation. Coupons are carried out in G86 riveter and measured using CREAFORM HandySCAN 3D (0.05-mm resolution) both before and after joining. The actual deformation value of coupons equals the measurement value after riveting minuses the measurement value before joining. Figure 10 shows the deformation contour of these two verification experiments. As depicted in Figure 10, although the maximum deformation among them is close, the distribution is different. The deformation in Figure 10(b) and (c) is more homogeneous than in Figure 10(a). The results indicate that the riveting parameters play an important role in assembly deformation. It also implies the optimization method is valid and the optimized solutions can improve the deformation homogeneity.
Optimized parameters selected from Pareto-optimal solutions.


Comparison of deformation with current parameters and optimized parameters: (a) parameters used in the current riveting process, (b) 1# parameters selected from Pareto-optimal solutions, and (c) 2# Parameters selected from Pareto-optimal solutions.#mean two groups of experiments, and their parameters are selected from Pareto-optimal solutions. For convenience, the parameters combinations are represented by simple characters.
Conclusion
The riveting process is a complex nonlinear process, including multi-input process with multi-response. This article focuses on proposing an integration method by integrating FEM, Kriging metamodels, and PSO algorithm to address the multi-objective problem. Conclusions are summarized as follows:
A quarter 3D explicit FE model was built to study the riveting process parameters (squeezing force, buck cavity, upsetting rise time, upsetting dwell time, and clamping force), which was validated with experiments. 24
The mapping relationship between riveting process parameters and local deformation (hole expansion and sheet bulging value) was constructed with Kriging metamodels, which agrees well with the simulation results.
The importance level analysis of the process parameters to output responses shows that (a) A (squeezing force) and E (upsetting dwell time) have the largest negative effect on CV1, while A (squeezing force) and B (clamping force) have the most significance contribution rate to M; (b) the interactions contribution rates are complex, for example, the factor A–D (squeezing force and upsetting rise time) has the largest positive effect to CV1, while A–C has negative contribution rate to CV1.
The optimized riveting process parameters are obtained by means of PSO algorithm and have been proved to be effective through multiple rivet experiments, which demonstrates that the proposed optimized solutions can improve the deformation homogeneity.
In practice, there are many other process parameters that affect riveting deformation, such as die design parameters and riveting sequence. All of them are the further directions of our work.
Footnotes
Acknowledgements
The authors would like to thank the anonymous reviewers for their comments and suggestions.
Academic Editor: Kang Cheung Chan
Declaration of conflicting interests
The author(s) declared no potential conflicts of interest with respect to the research, authorship, and/or publication of this article.
Funding
The author(s) disclosed receipt of the following financial support for the research, authorship, and/or publication of this article: This research was supported by National Natural Science Foundation of China (Grant No. 51375396); Natural Science Foundation of Shaanxi Province, China (Grant No. 2016JM5011); and AVIC Production-Study-Research Cooperative Innovation Project (Grant No. CXY2014XGD07).