
Abstract
In this work, the flow effects on an isolation plugging tool in a pipeline were numerically investigated using computational fluid dynamics. The study focused on optimal parameter design for the isolation plugging tool, which reduced the unsteady force effects on the x and y directions of the flow field. First, three-dimensional models of the isolation plugging tool and pipe were built. The velocity, pressure, and force analysis on the flow past the isolation plugging tool were investigated via computational fluid dynamics simulation. Second, a combination of design parameter ratios was selected using the Box–Behnken method for a series of numerical experiments. From the simulation results, three regression total force models were determined for the x, y, and z directions using response surface methodology. A modified genetic algorithm was proposed to optimize the design parameter ratios for the isolation plugging tool based on the regression models. The optimum parameter ratios were chosen and verified using the simulation results.
Keywords
Introduction
At present, transmission pipelines are the main way to transport gas and oil. A remote-controlled (tether-less), high-pressure isolation plugging tool (IPT) is used when pipeline maintenance requires plugging operations.1,2 The IPT starts plugging and sealing operations when it receives a signal indicating its correct position. For both onshore and offshore IPT applications, the working conditions are critical to an IPT’s operation. For complex flows in a pipeline, there may be considerable variations, leading to unsteady forces on the IPT and unwanted vibrations in the pipe. It is therefore necessary to design an appropriate structure that reduces the unsteady forces on an IPT in a pipe.
Studies on unsteady flow arising from obstruction-associated structures such as an IPT have been carried out.3–8 Steady and unsteady forced convection flows are affected by the height-to-diameter ratio of the bluff body. There has also been a considerable amount of research on the existence of inherent three-dimensional flow structures arising from geometry effects.9,10 In-pipe robot design studies have focused mainly on mechanical design analysis11,12 and control techniques.13,14 In addition to in-pipe robot design, studies on appropriate designs for three-dimensional flow structures have many applications.15–17 Li et al. 18 describes a multi-phase flow simulation for designing and controlling a passive magnetic levitation carrier system via the Taguchi method. Song et al. 19 have conducted an optimal design of an internal flushing channel for a drill bit using response surface methodology (RSM) and computational fluid dynamics (CFD) simulations, achieving very good results. However, to the best of our knowledge, the flow effects on an IPT have not been considered for design and have not been studied.
The aim of this article is to study the optimal design for IPT’s main parameters to improve and reduce unsteady conditions in the flow. First, a three-dimensional pipeline model and a plugging model have been constructed. The flow effects on the IPT are studied for its normal operating state using CFD simulation. The analysis focuses on changes in the flow field, such as velocity, the distribution of the pressure on the IPT, and the total forces in the x and y directions on the IPT. Second, Box–Behnken designs have been introduced to build models between the total forces in the x, y, and z directions and design parameter ratios based on the RSM. The influence parameter ratios have been discussed. Third, an optimal design based on a modified genetic algorithm (GA) has been proposed, with the results demonstrating the effectiveness of the design.20–22
Mechanical structure of the IPT
Figure 1 shows a model of an IPT. The device consists of five main parts: the left pressure head module, the bowl, the blocking module, the pushing cylinder module, and the right pressure head module. An IPT is propelled from a pigging ball launcher and is operated via tether-less control. For both onshore and offshore IPT applications, the working conditions are critical to the IPT’s operations. Figure 2 shows the normal condition of an IPT in a pipe.

Isolation plugging tool.

Model of an IPT in a pipe.
Numerical simulations and analysis
As turbulent conditions affect the stability of the flow field for an IPT in a pipe (as shown in Figure 2), the standard k − ε turbulence model is used to simulate the model in Fluent. 23
The diameter of the pipeline model was 0.8 m and the length was 10 m. The flow media was simple phase gasoline, and the central point of the IPT model coincided with that of the pipeline. The pipeline inlet of the model was set as a velocity inlet at a constant 3 m/s, which is defined as an economic flow speed. The pipe’s wall and the wall of the IPT in contact with the fluid are defined as no-slip wall boundary conditions. With the exception of the above boundary conditions, the other simulation parameters are given in Table 1.
Numerical simulation parameters.

Governing equations for the CFD simulations
To describe the flow system considered in this study, we use the mass conservation equation 24 (equation (1)) for fluid flow. The simulation assumes that the fluid is incompressible and adiabatic. The numerical method is based on a time-marching version of the semi-implicit method for pressure-linked equations consistent (SIMPLEC) pressure correction algorithm

The Reynolds number was calculated to be 6 × 10⁶. The features of the flow field through the IPT are as follows: a simple phase flow medium that is incompressible and a low fluid velocity. Equation (2) depicts the turbulence kinetic energy k, and equation (3) describes the turbulence dissipation rate ε 25

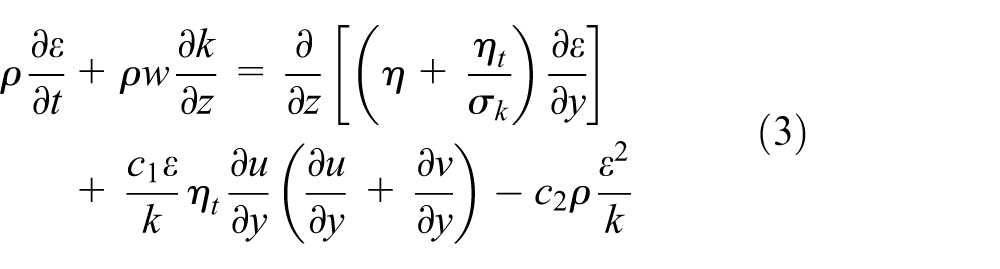
where
Boundary conditions
To improve the efficiency of the calculation, the structure of the IPT is simplified (as shown as Figure 3(a)). The IPT model in the pipe is in its normal operating condition and a boundary layer is created for viscous flow through the pipe. The face of the inlet was divided into a boundary layer and triangle cells (as shown as Figure 3(b)). A tetrahedral mesh type is applied to the entire model. The entire grid contains 463,904 cells and 89,035 nodes, which are suitable for the determination of an accurate simulation. The meshing process is conducted using line meshing to volume meshing, and the meshes become denser moving away from the IPT wall to the flow field.

Mesh model: (a) 3D mesh model of the IPT in the pipe and (b) mesh model of the inlet face.
Validation of the numerical model
The model is validated against a normalized axial velocity profile available in the literature. 25 The computations are performed for a Reynolds number (Re) of 8800. Figure 4 shows the normalized velocity profile distribution compared to the experimental PIV results obtained by Camussi et al. The normalized velocity profile distribution is in good agreement with the PIV results.

Comparison of the velocity profile obtained by Camussi et al. 25 with a validated simulation velocity profile.
Box–Behnken design for the response surface methodology
The RSM is a statistical and mathematical method applied to engineering modeling and optimization design.26–28 Box–Behnken designs are experimental designs for RSM and are effective at identifying first and second coefficients. 29 In each block design, a certain number of factors are examined for all combinations of a factorial design, whereas other factors are kept at central values. Saravanakumar et al. 30 discussed influencing parameters in a servo-pneumatic system using RSM. In this study, three factors are selected to build the models for the force response results. Leontini and Thompson 31 discussed geometric effects, and how it is important to study the effects of a pipe’s length-to-diameter ratio (L/D), the ratio of the diameter of the blocking part to the diameter of the pipe(d/D), and the ratio of the diameter of blocking part to the diameter of the pressure module (d1/d). The largest L/D ratio is restricted to the elbow passage, and the largest examined L/D ratio is 2.8. The three factors used were these ratios, and a level of three was selected as the design level of the experiment, as shown in Table 2. Then, the three-factor Box–Behnken design coordinates are listed in Table 3.
Level of design factor.

Design layout and corresponding responses.

A series of CFD simulations are conducted using the design described in Table 3. The results for the total force in the z direction (Fz), the total force in the y direction (Fy), and the total force in the x direction (Fx) are listed in Table 3. The resulting design combinations are also listed in Table 3.
The regression model is a second-order model in the Fy and Fz design

The equation contains a free term (b0), a linear term (Xi), a squared term (
Numerical result analysis based on RSM
Numerical results of CFD simulation
The pressure contour on the IPT for normal operations is shown in Figure 5. The left pressure head module experiences the highest pressure and the pressure on the blocking module is not high as that in the flow obstructed by the IPT. The wheel and wheel hub are simplified in the model. The pressure on the right-hand pressure module is small, but most of the module exhibits a high negative pressure. The negative pressure is caused by the complicated structure and the sudden expansion of the flow without being obstructed by the rear face of the IPT.

Pressure contours on the IPT model for normal operations.
A cloud chart of the velocity distribution of the flow at the central plane (x = 0) is shown in Figure 6. For a detailed analysis, we set the origin in the left surface of the blocking module. A flow separation phenomenon appears in the adjacent area near the back-end of the IPT. The high-speed fluid particles still flow past the IPT, along with the low speed particles. As a result, vortexes form. The periodic evolution of the vortexes leads directly to the development of further turbulence.

Cloud chart of the velocity distribution in the flow field on the central plane (x = 0).
The total force is the summation of the static pressure forces and fluid viscosity forces. Figure 7 shows the variation in the total forces on the IPT at different number of iterations in the x and y directions. Comparing the curves, the total forces in the two directions exhibit a significant difference, which is not a conducive to the steady control of the IPT.

Variation in the total force in the x and y directions on the IPT.
RSM results
Analysis of variance (ANOVA) and response surface analysis are used to determine the statistical significance of the model. The adequacy of the model was predicted through the ANOVA (p < 0.05) and regression analysis (R2). The relationship between the response and the independent variables is demonstrated using a response surface plot.
Influences of factors on the total force in the z direction Fz
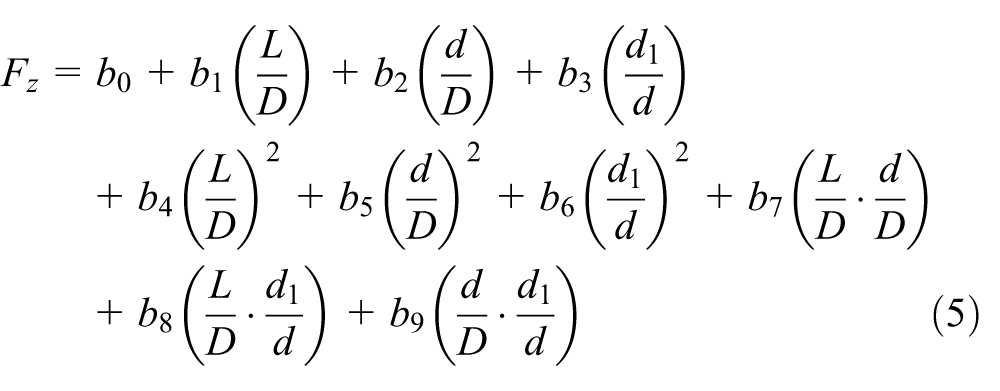
The second-order regression model of the total force in the z direction Fz is shown in equation (5) and the estimated regression coefficients are listed in Table 4
Estimated regression coefficients.

The results of the ANOVA conducted on the effect that the IPT factors have on the total force in the z direction Fz are shown in Table 5. The index of the table includes an illustrated sum of squares, the mean squares, the degrees of freedom (DFs), the F value, the probability (p-value), and the percentage contribution (C%). The low p-value indicates that the regression model can predict Fz based on the design factors with 99.97% confidence. It is clear that the ratio of d/D greatly influences the total force in the z direction, which contributes 72.2% of the results of the ANOVA. The ratios d1/d and L/D have less influence, contributing 0.02% and 0.03%, respectively. Two-dimensional surface plots comparing Fz and the three ratios are shown in Figure 8 and were generated using the Minitab software package. Figure 8 shows the surface plots of the total force in the z direction compared against the two variable factors and a single fixed variable.
ANOVA results for the total force in the z direction Fz.
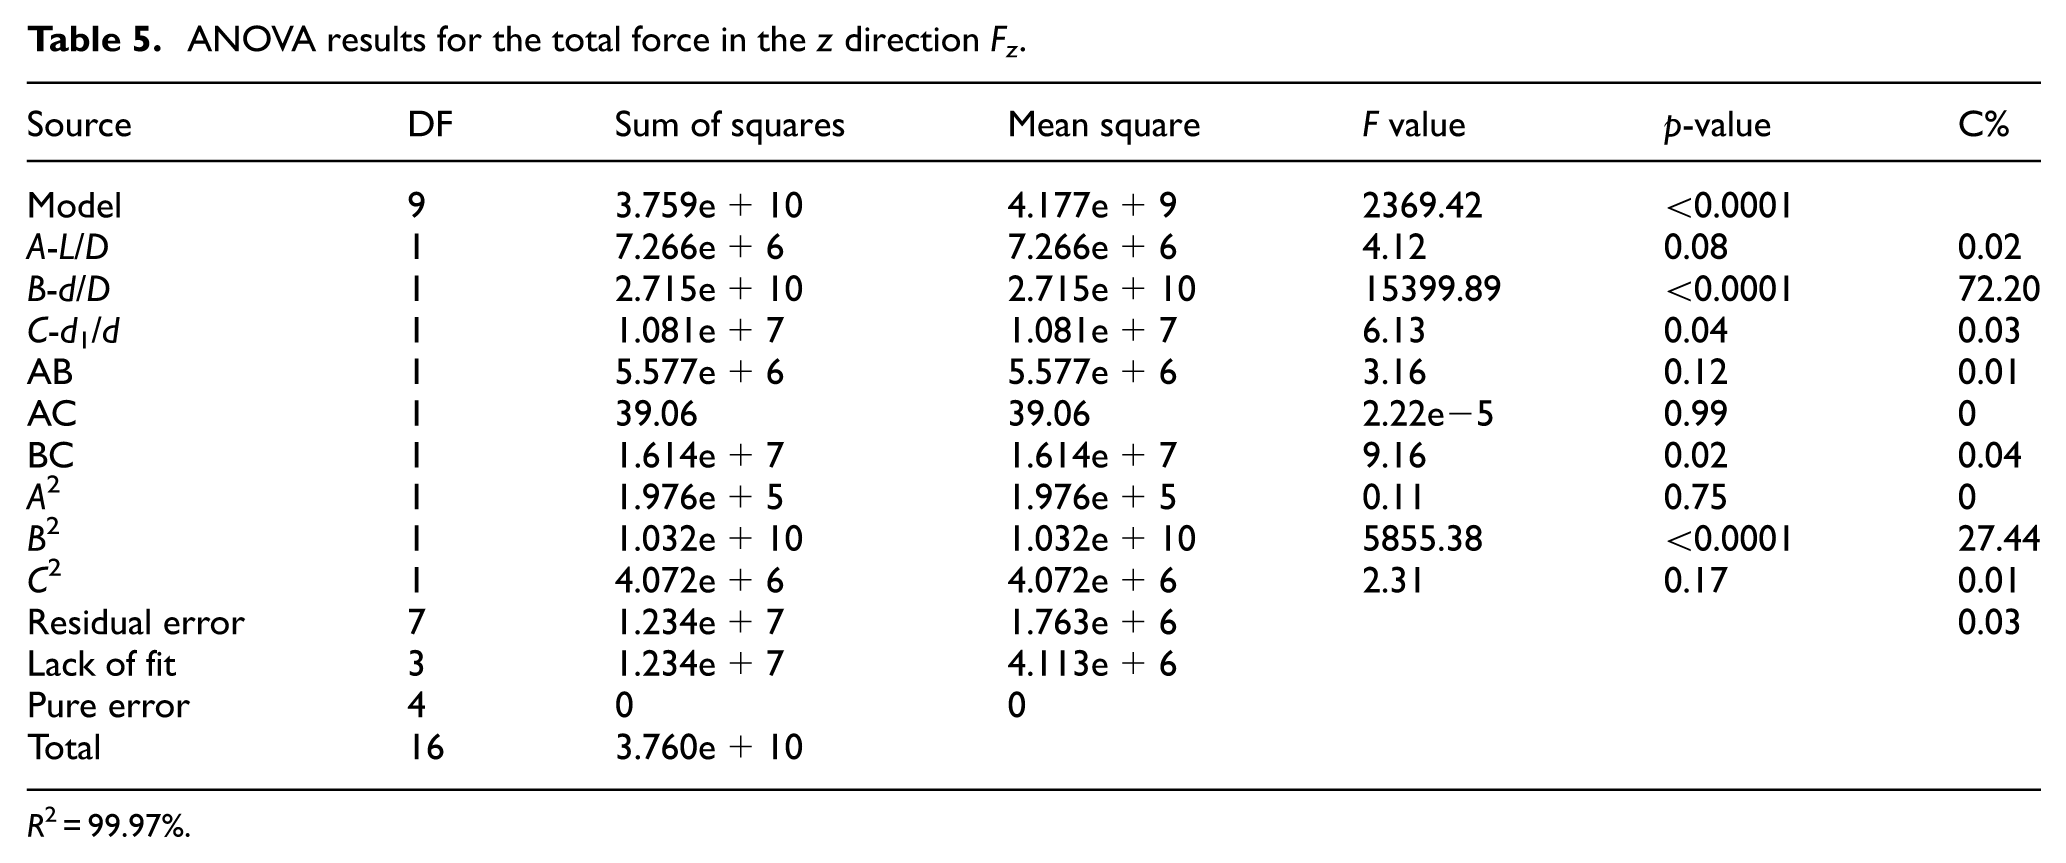
R 2 = 99.97%.
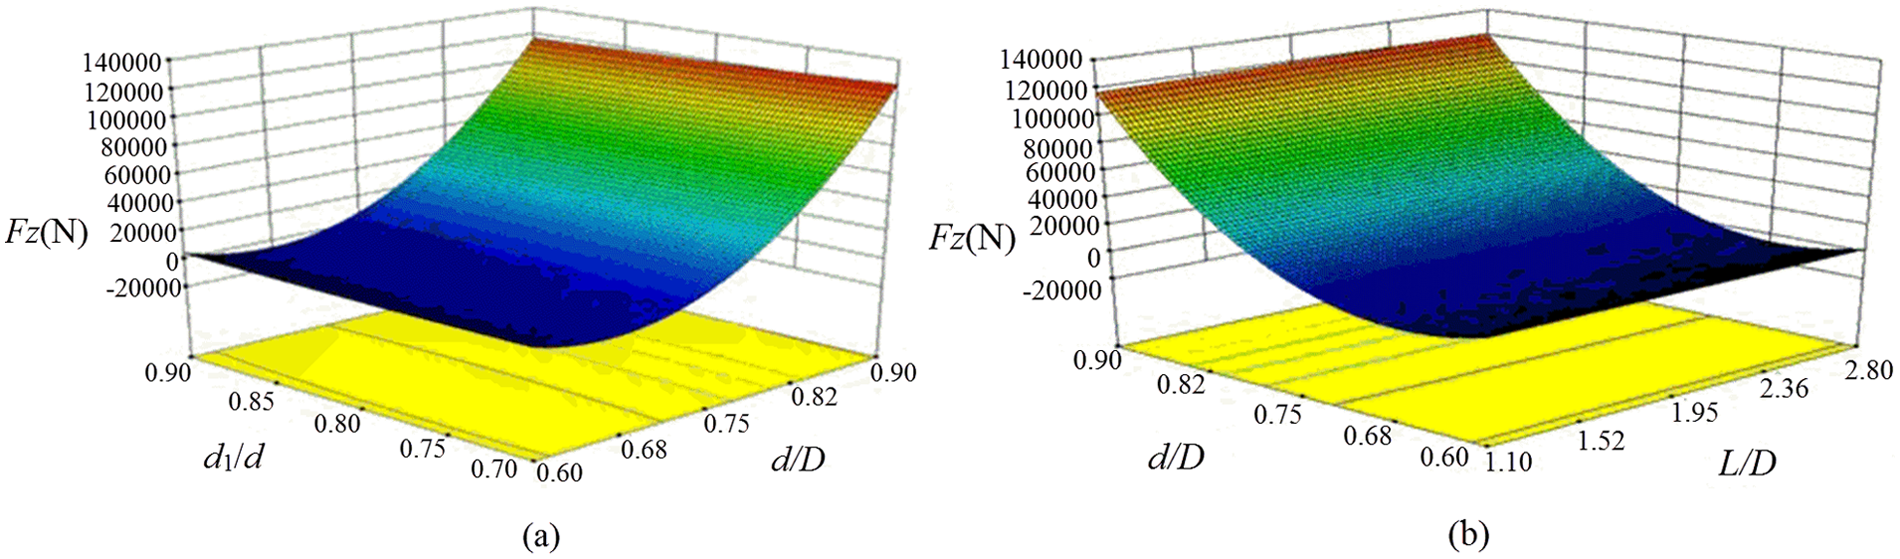
Surface plots comparing the total force in the z direction Fz and the three ratios: (a) d1/d and d/D for L/D = 1.95 and (b) d/D and L/D for d1/d = 0.8.
Influences of factors on total force in the y direction Fy
The second-order regression model of the total force in the y direction with parameter ratios is shown in equation (6) and the estimated regression coefficients are listed in Table 6

Estimated regression coefficients.
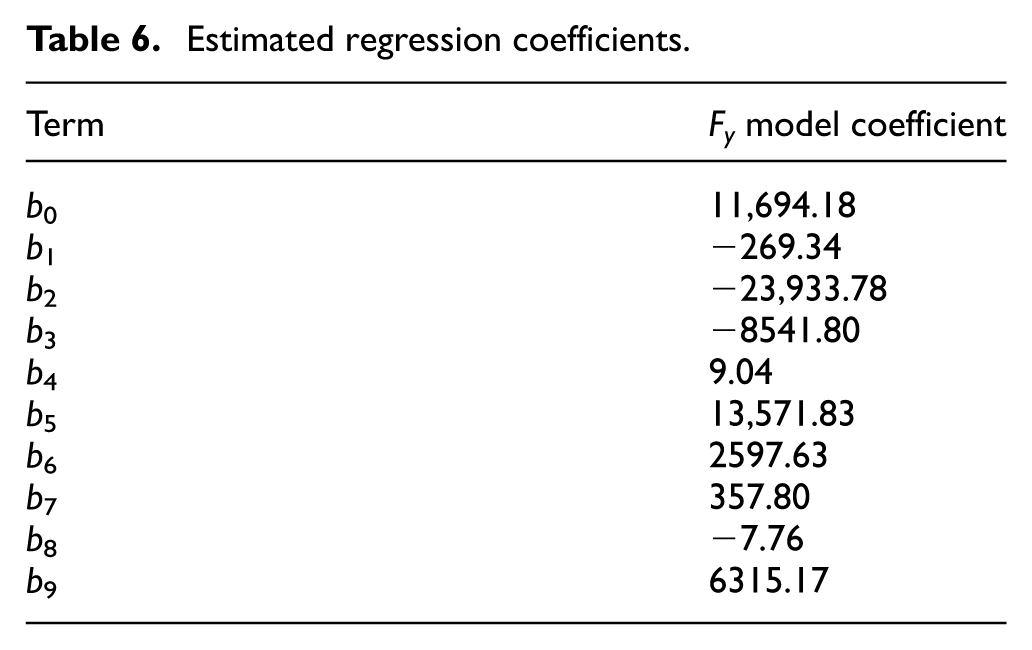
The results of the ANOVA for the effect that the IPT factors have on the total force in the y direction Fy are shown in Table 7. The low p-value indicates that the regression model can predict Fy from the design factors with 97.81% confidence. It is clear that the ratio of d/D greatly influences the total force in the y direction, which contributes 63.6% of the ANOVA results. The ratios d1/d and L/D contribute only 0.33% and 0.67%, respectively. Three-dimensional surface plots comparing Fy and the three ratios are shown in Figure 9 and were generated using the Minitab software package. Figure 9 shows the surface plots of the total force in the y direction compared to the two variable factors and a single fixed variable.
ANOVA results for the total force in the y direction Fy.
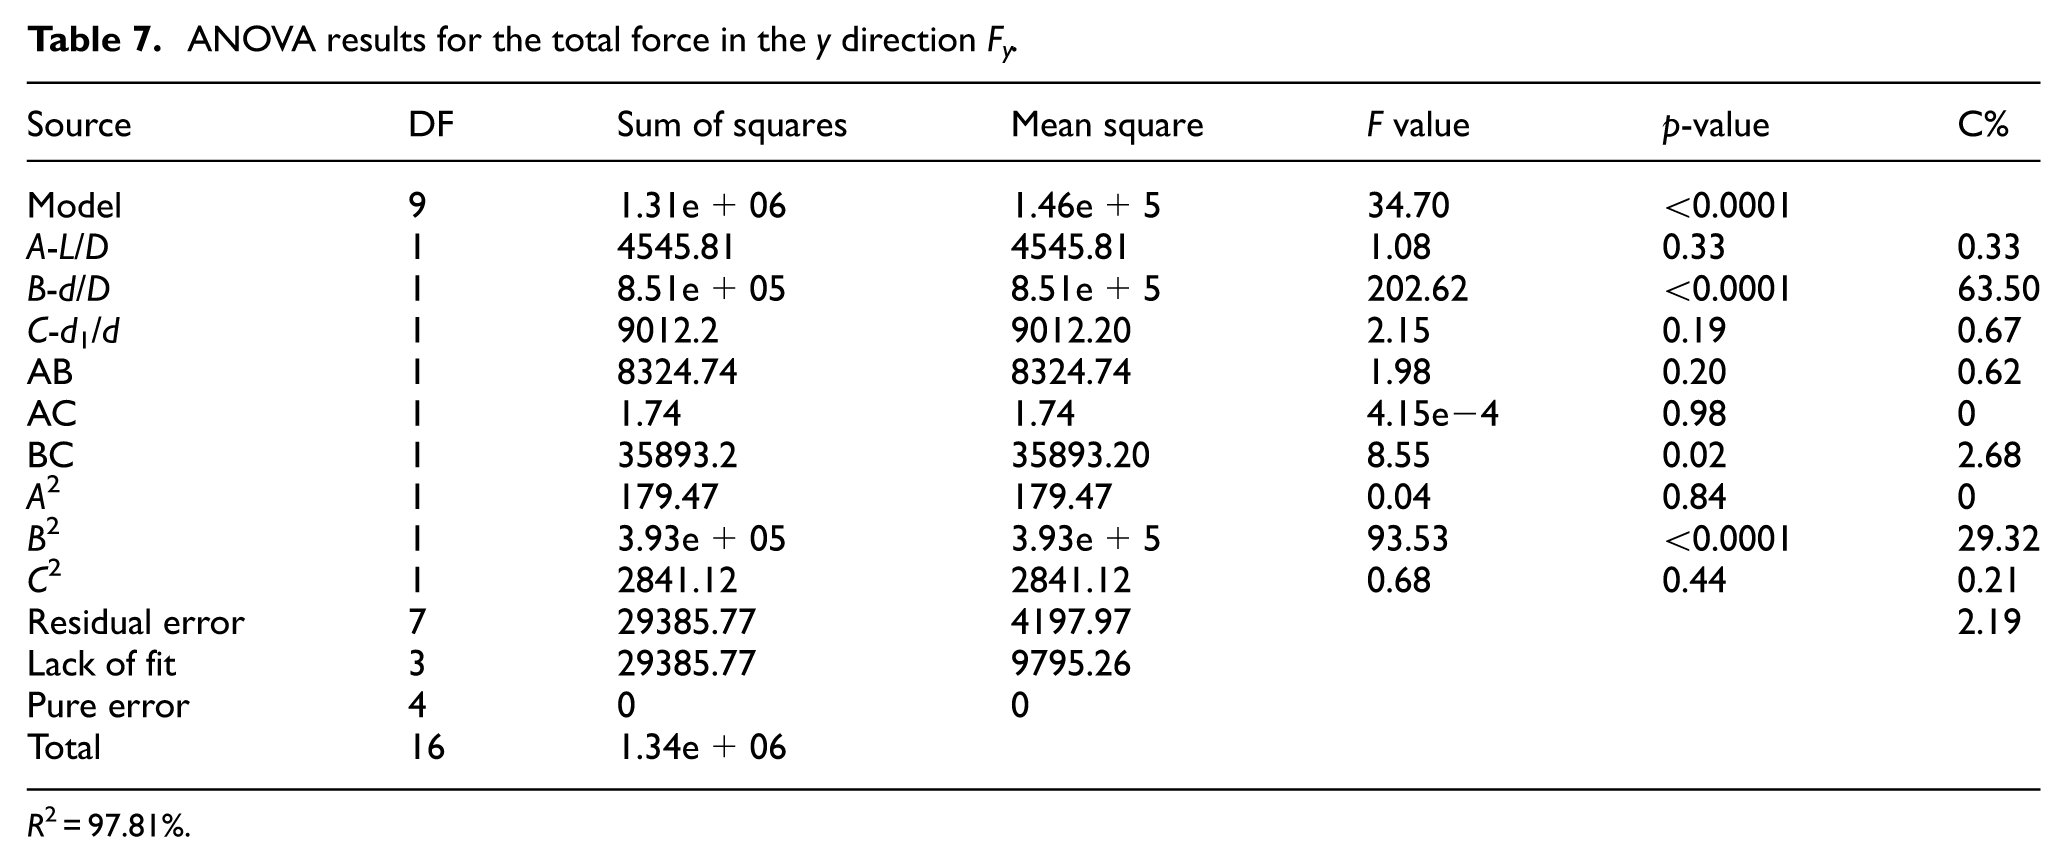
R 2 = 97.81%.

Surface plots comparing the total force in the y direction Fy and the three ratios: (a) d/D and L/D for d1/d = 0.8, (b) d1/d and L/D for d/D = 0.75, and (c) d1/d and d/D for L/D = 2.
Influence of factors on the total force in the x direction Fx
The second-order regression model cannot determine the total force in the x direction. A modified third-order regression model is shown in equation (7) with the estimated regression coefficients listed in Table 8

Estimated regression coefficients.
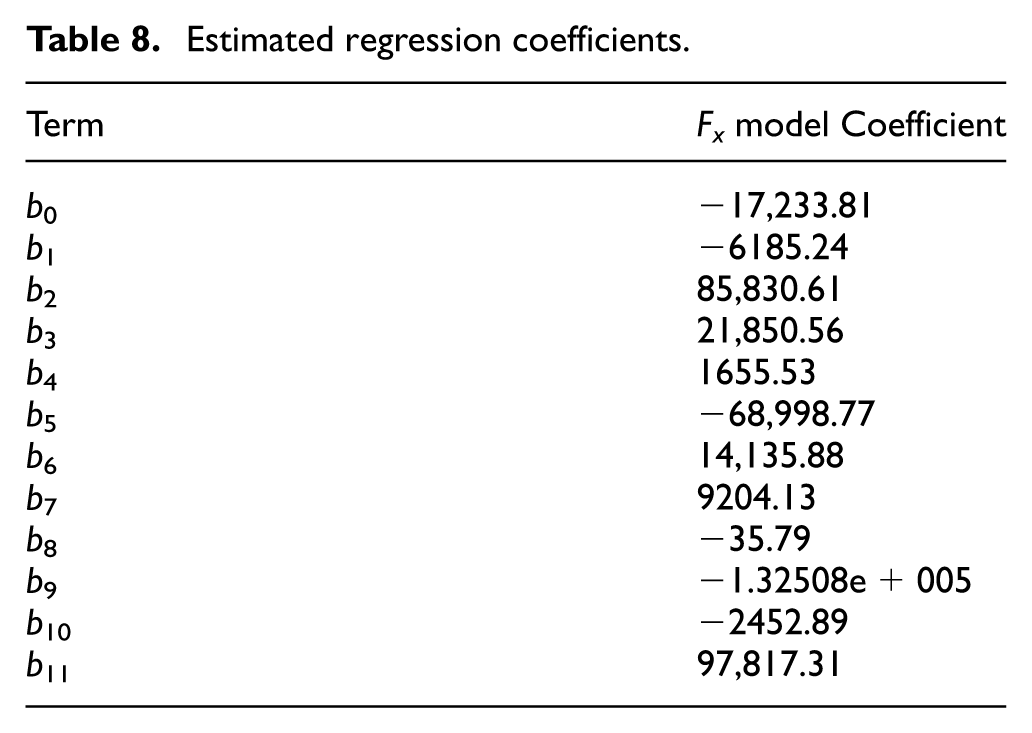
The results of the ANOVA for the effect that the IPT factors have on the total force in the x direction Fx are shown in Table 9. The low p-value indicates that the regression model can predict Fx from the design factors with 99.76% confidence. It is clear that the ratio of d/D greatly influences the total force in the x direction, which contributes 40.6% to the ANOVA results. The ratios d1/d and L/D contribute 0% and 0.386%, respectively. Figure 10 shows the three-dimensional surface plots comparing Fx and the two ratios, which were generated using the Minitab software package.
ANOVA results for the total force in the x direction Fx.

R 2 = 99.76%.

Surface plots comparing the total force in the x direction Fx and the two ratios: d/D and L/D for d1/d = 0.8.
Optimal design based on a modified GA
From the above discussion, minimization of Fy and Fx is considered to reduce the effects and differences in the two directions to achieve a steady control environment. The objective function is expressed as


Optimal design based on the modified GA
The problem of a multi-objective optimal design is very common in engineering. There are several optimization algorithms, such as a GA for global optimization based on evolutionary computation, which has been widely applied to solve many engineering parameter optimization problems. 33 Meanwhile, it is also applied to the optimization of mechanical engineering. In this study, a modified GA is proposed for the IPT design and is shown to be effective in achieving optimization of the IPT design.
1. Generation
The creation of a new generation initializes the operation of the GA. Each set of parameters in the generation is known as a single individual. One gene is defined as one parameter in the individual. In this study, the creation of a new generation is limited within the bounds of the solution space. The gene value of one individual is limited to satisfying the condition of Fz. The size of population is set at 100.
2. Fitness
In this design, the purpose is to find structure parameters that satisfy the minimum of the objectives. The fitness is defined as

where chfa is the weight coefficient, which considers the difference between Fx and Fy. The minimum of Fx and Fy should be considered to be the difference between Fx and Fy
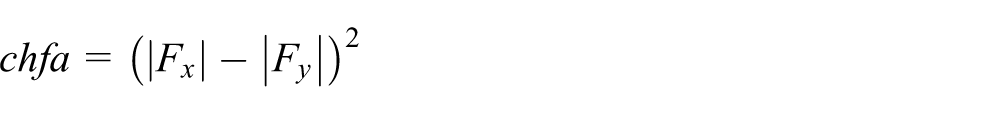
where λ1 and λ2 are the weight factors and λ1 = λ2 = 0.5.
3. Crossover and mutation
Crossover is the process of exchanging offspring reproduction. The new generation is produced by linear combinations of parents. These parents are individuals that are selected to crossover as parents. In this design, the new generation is designed to satisfy the conditions of Fz. The generation that does not satisfy this condition is eliminated and another random generation that satisfies the condition will be introduced. In this way, the process of optimization does not end too early and cause the results to be a local minimum. The crossover percentage is set to 0.95, and the mutation percentage is set to 0.1. The algorithm flowchart for the modified GA is shown in Figure 11.
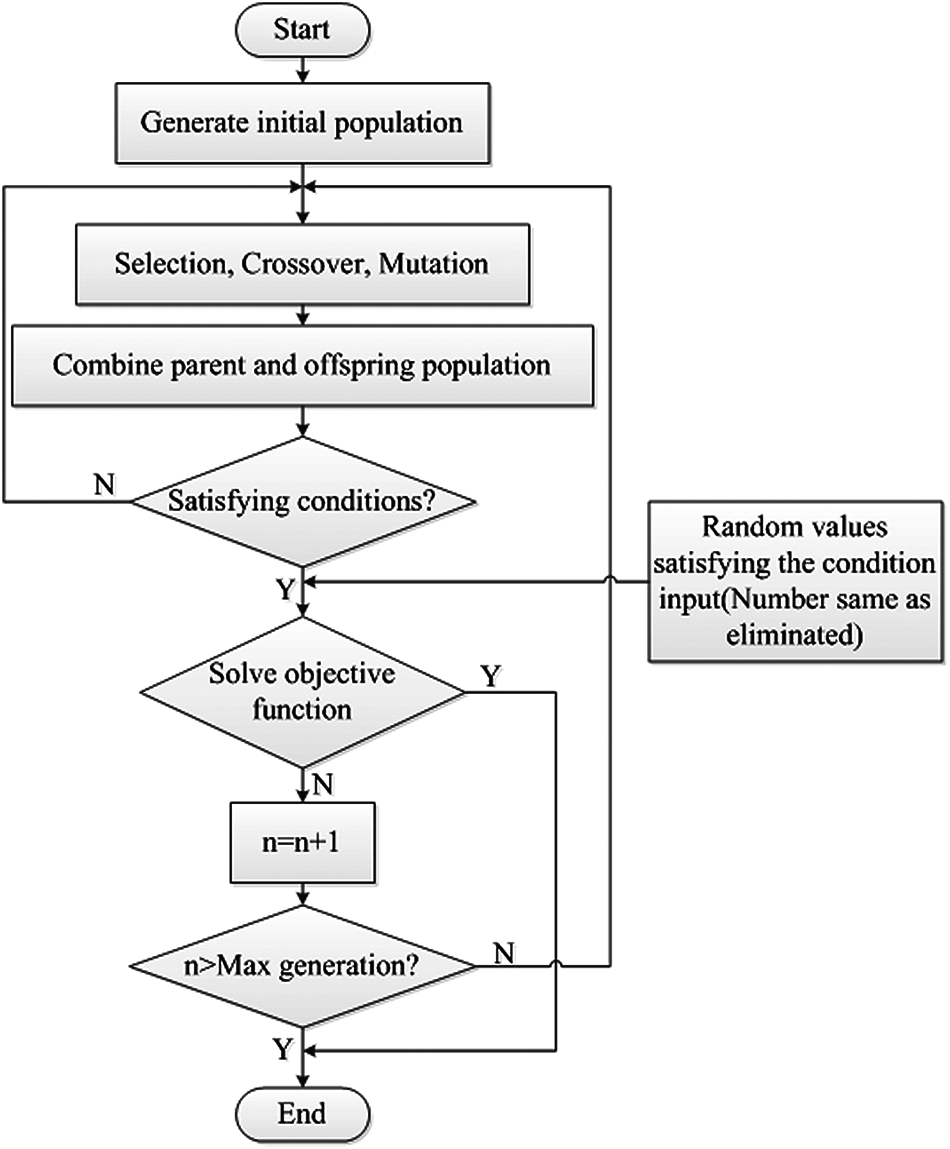
Flowchart of the modified GA algorithm.
4. Optimal design results
The optimum ratios for minimizing the objective are determined to be 1.4 for L/D, 0.6 for d/D, and 0.81 for d1/d (as shown in Table 10). To validate the optimized design ratios, CFD simulations of the optimal design are conducted. The optimized results show that Fy decreases from 916.95 to 1.01 N and Fx decreases from 429.186 to 1.001 N. The optimized results are shown in Figure 12.
Design ratios for the isolation plugging tool.


Total forces in the x and y directions on the IPT for the optimum design.
Conclusion
In this study, fluid effects are discussed using CFD simulations for an IPT in a pipeline. Box–Behnken designs are used to analyze the relationship between the mechanical parameter ratios and the forces in three directions. Models of the forces with three factors are constructed and solved based on RSM. The optimal design ratios are selected using a modified GA. The following conclusions can be made:
The optimum design using a modified GA yields 1.4 for L/D, 0.6 for d/D, and 0.81 for d1/d in the x, y, and z directions on the IPT.
The IPT model was optimized using a modified GA-based RSM analysis to reduce the total forces in the x and y directions on the IPT.
ANOVA was conducted on the CFD simulation results to predict the total forces in the x, y, and z directions: Fx, Fy, and Fz at a confidence level of 99.76%, 97.81%, and 99.97%, respectively, using regression models.
In this article, the effect of the IPT size is considered for the first time on the flow field of plugging process, and its modeling is analyzed and optimized quantitatively. The optimal design based on modified GA and RSM is proposed, and results show that it can effectively reduce the total forces on IPT and make the plugging operation safe and reliable.
Footnotes
Appendix 1
Handling Editor: Ramoshweu Lebelo
Declaration of conflicting interests
The author(s) declared no potential conflicts of interest with respect to the research, authorship, and/or publication of this article.
Funding
The author(s) disclosed receipt of the following financial support for the research, authorship, and/or publication of this article: This research was financially supported by the National Natural Science Foundation of China (grant no. 51575528), the Scientific Research Foundation of the Education Ministry for Returned Chinese Scholars (China), and the State Key Laboratory for Coal Resources and Safe Mining, China University of Mining &Technology (no. SKLCRSM10KFB04). The research was also supported by the Science Foundation of China University of Petroleum, Beijing (no. YXQN-2014-02).