
Abstract
The presence of significant proportion of novice drivers greatly affects traffic flow performance due to their poor driving skills. The primary objective of this study was to develop adjustment factors to evaluate the impacts of novice driver’s car-following characteristic on roadway segment capacity. On-road experiments were conducted for measuring the car-following behavioral data associated with novice and experienced drivers. Comparative analyses were conducted. It was found that novice drivers preferred keeping significantly larger spacing and headways than experienced drivers did. Linear regression analyses were conducted to relate travel speeds to spacing and headways. Adjustment factors were developed to quantitatively evaluate the effects of novice drivers’ car-following behaviors on roadway segment capacity. It was found that as the proportion of novice drivers in the traffic stream increased, the reduction rate of capacity had the same trend of increasing. The presence of novice drivers may result in up to 13% of capacity reduction when traffic flow composed entirely of novice drivers traveling with an average speed of 90 km/h. The validity of implementing the novice driver adjustment factor was tested against measured data. The results of validation determined that the proposed adjustment factors improve the estimation accuracy of roadway segment capacity.
Introduction
During the last decade, as greatly growing number of Chinese people obtained their own cars and licenses, the novice driver population has occupied a considerable proportion of the licensed drivers in China. Novice drivers are inexperienced drivers who generally have inadequate driving skills and problems with perceiving traffic conditions.1–7 As typically found by Van Winsu, 6 novice drivers are less skilled in adjusting the brake response to the visual transformation of leading vehicle. Accordingly, they generally prefer maintaining larger headways than experienced drivers do. Some other researches also presented that novice drivers tend to select larger safety margins compared to those selected by experienced drivers.8,9 Theoretically, according to the fundamental relationships between microscopic car-following measures and macroscopic traffic descriptors, the differences in headways between novice and experienced drivers can have a profound impact on traffic flow quality. Then, the presence of significant proportion of novice drivers may greatly affect roadway capacity.
Capacity defined in the Highway Capacity Manual (HCM, the 2010 edition) 10 is the maximum hourly rate at which persons or vehicles reasonably can be expected to traverse a point or a uniform section of a lane or roadway during a given time period under prevailing roadway, traffic, and control conditions. The procedures for estimating the capacity of various traffic facilities usually start from estimating the ideal capacity. Various adjustment factors have been proposed to account for the real conditions which cannot be considered ideal. For example, for basic multilane roadway segments, the real capacity can be determined by making adjustment with considerations of geometric parameters, 11 traffic states, 12 environmental conditions, 13 and driver population factors.14,15 Unfortunately, current estimation method in the HCM does not take a deep insight into the impacts of novice drivers, and instead assumes that all drivers with similar experience travel on road with respect to capacity estimation. Moreover, to the extent of our knowledge, research on quantifying the novice-driver-related factors is still missing. With the abrupt increase in novice drivers in China, research is needed to examine whether the presence of significant proportion of novice drivers can affect capacity.
The primary objective of this study was to evaluate and estimate the impacts of novice drivers’ inexperienced car-following behaviors on capacity of traffic facilities. The focus of the study is on the multilane roadway segment, where traffic congestion often constitutes a concern. More specifically, the research objective includes the following tasks: (1) to compare the car-following behaviors of novice and experienced drivers, (2) to evaluate the effects of novice drivers’ car-following behaviors on the characteristic of traffic flow on roadway segments, (3) to develop adjustment factors regarding novice drivers for estimating the roadway segments capacity, and (4) to test the validity of using the adjustment factors. The research results are valuable for helping professionals perform better capacity estimations and ultimately influence planning, designing, and operation analysis of transportation facilities.
Background studies
HCM method for capacity estimation
According to the HCM, basic roadway segment capacity is defined as the service flow rate for level of service “E” condition. The service flow rate is calculated using the following formula

where
In equation (1), the maximum service flow rate MSF is determined by estimating the free-flow speed for a multilane roadway

where FFS is the free-flow speed, BFFS is the base free-flow speed,
Equations (1) and (2) declare the adjustment factors used to determine capacity. Note that the variable
Note that the recommended “exact” values in Sharma’s work were mainly based on “expert” opinions. Due to the lack of related driver behavior investigations, these recommended values may not show good consistency with the actual effect of unfamiliar drivers’ behavior features on capacity.
Characteristics of the novice driver population in the literatures
No literature relating the performance of the novice driver population to capacity estimation can be found; however, several researches have investigated novice drivers’ driving behavior and safety performance which directly or indirectly affects roadway capacity.
Duncan et al. 5 used an instrumented car driven in normal traffic condition to assess driving skills of four kinds of drivers: trained experts, normal drivers, experienced drivers, and novice drivers. The results confirmed that for aspects of vehicle control (e.g. speed of maneuvers), normal drivers largely resembled experts while novice drivers performed poorly, which means experience can improve driving skills. However, they found that experience may not always be so beneficial. For information feedback such as scanning patterns, anticipation, and safety margin, it was often the normal and experienced drivers who performed worst, and novice drivers sometimes even resembled experts.
Van Winsum 6 found that there were substantial differences in the value of time headways between two kinds of drivers. He showed experimental evidence that the transformation of visual information about leading vehicle hardly affected the braking response of drivers with larger preferred headways, while drivers with smaller preferred headways were strongly affected by such visual information. This indicated that drivers who were less skilled in adjusting the brake response to the leading vehicle generally chose to drive with larger time headways. Based on this concept, Van Winsum 16 presented a mathematical car-following model considering psychological knowledge of human drivers discussed above. In his model, drivers with inadequate skills attempted to maintain larger preferred following distances, which could be considered as a mechanism that inexperienced drivers compensated for the gap of driving skill level in the manner of keeping larger following distance.
Li et al. 8 conducted a study to identify the safety differences between Chinese novice drivers and experienced drivers based on two safety indicators, namely, time gap and time to collision (TTC). Data collected from an on-vehicle experiment indicated that novice drivers accounted for a smaller proportion of TTC values during the period of 0–10 s but a larger proportion during the period of 10–20 s than experienced drivers did. Taking safe stop time as the criteria, time gap had a clear boundary to distinguish safe and unsafe car followings and then 2.9 and 2.2 s were recommended as the safe thresholds for novice drivers and experienced drivers, respectively. However, they found that a constant threshold for TTC did not exist since it was related to speeds as well as speed differences between vehicle pairs.
Jiang et al. 9 discussed the differences of desired following distances between novice drivers and experienced drivers. They conducted an on-road experiment to collect the data of two driving behavior parameters including speed and following distance. Through the data analysis results, the study discovered that at most speed intervals, experienced drivers kept longer desired following distance than novice drivers did. The desired following distances were proportional to the speed but were affected asymmetrically by positive and negative speed differences. Based on these empirical findings, new desired following distance models for novice and experienced drivers were established, calibrated, and verified.
Research by Laapotti et al. 17 evaluated novice drivers’ accidents and violations based on a hierarchical model of driving behavior which consisted of four hierarchical levels, namely, from the lowest level to the highest one: vehicle maneuvering, mastering traffic situations, goals and context of driving, and goals and skills for living. Through the analysis of the survey data, three conclusions were drawn: (1) young novice drivers had more problems corresponding to the higher hierarchical levels of driving behavior than middle-aged novice drivers did, (2) number of accidents and violations was highest among the young males and their accidents took place more often at night than the accidents of other drivers did, and (3) female novice drivers showed more problems with respect to the lower hierarchical levels of driving behavior, for example, problems in controlling speed, direction, and position.
Clarke et al. 18 evaluated the effect of experience on young drivers’ safety performance. By collecting a sample of over 3000 accidents involving drivers aged 17–25 years, they found that accident rate generally reduced along with increasing driving experience which was reflected as the number of years for holding full license. More especially, cross-flow turn and rear-end accidents showed quick improvements with increasing experience, while accidents occurring in darkness with no street lighting showed the slowest rate of improvement.
In summary, based on the literature review, there has been a good deal of research on the influence of novice drivers on traffic performance and safety. These previous findings imply that the presence of novice drivers may have significant impacts on traffic flow operation. However, little research specifically on the impact of novice drivers on capacity of roadway sections is found. The results of this study can help traffic operators better understand how novice drivers’ car-following characteristics affect traffic performance. The results can also be used by traffic engineers and traffic management department to quantitatively evaluate the reduction of roadway capacity due to novice drivers’ inexperienced driving style.
Methodology
The fundamental relationships between microscopic car-following behavior measures and macroscopic traffic descriptors form the foundation of the approach used to develop the novice driver adjustment factors. As mentioned in the HCM, in the aggregate, both of the spacing and the headway of individual vehicles can relate to macroscopic flow parameters of density and flow rate. The relationship between average spacing and flow density is determined by

Flow rate relates to average headway of a traffic stream, as determined by

The relationship between average spacing and average headway depends on flow speed, which can be indicated as
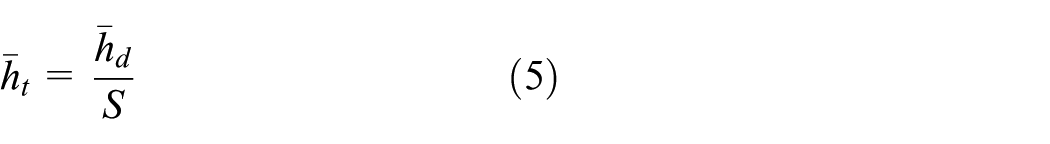
According to the relationships above, average spacing can relate to flow rate, as determined by
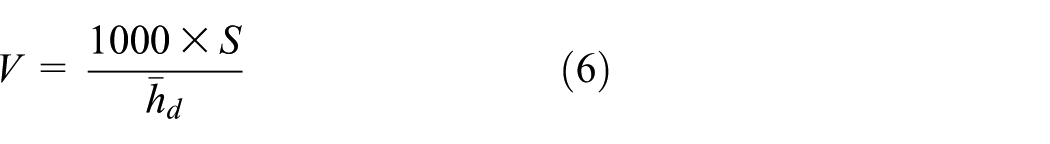
where V is the flow rate (veh/h), D is the flow density (veh/h), S is the flow speed (km/h),
Assuming that PN and PE, respectively, denote the percentages of novice drivers and experienced drivers in traffic stream, capacity corresponding to the maximum flow rate at the critical operating speed 19 can be calculated using equations (4) and (6) as follows
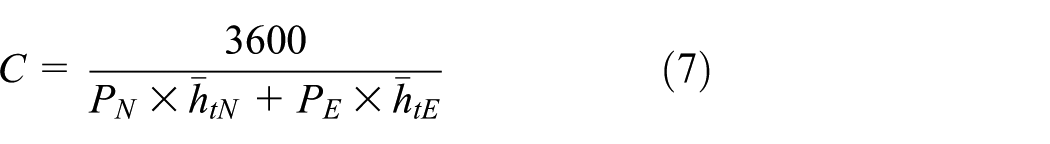

where C denotes the capacity;
In this research, we further determine the capacity by taking average over the two capacities calculated using the data referred to spacing and headway

In the HCM, the adjustment factor is developed in the manner of dividing the prevailing capacity by the ideal capacity. Then, the novice driver adjustment factor is determined as
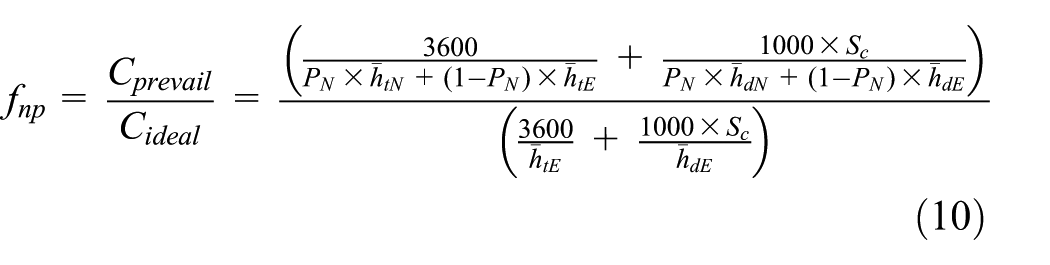
In the equation above, the capacity calculated at the denominator corresponds to an ideal traffic stream operating with no novice drivers, while the capacity at the numerator corresponds to a prevailing traffic stream composed of novice and experienced drivers. As previous studies discussed, novice drivers prefer keeping larger spacing and headways than experienced drivers do, which in turn means that the presence of novice drivers can lead to a reduction in capacity of roadway segments. Obviously, the reduction rate will grow with an increase in the amount of novice drivers. In order to identify and quantify the differences in spacing and headway between novice and experienced drivers, we conducted an on-road experiment to collect car-following behavioral data in nature traffic conditions.
Field data collection
As depicted in Figure 1, the data collection route passes through an eight-lane roadway named Xuanwu road in the Nanjing area in China. The Xuanwu road is a west-east highway which serves as a major corridor connecting the central area to the Xianling area of Nanjing. The average annual daily traffic (AADT) on Xuanwu road exceeded 35,000 vehicles per day in 2015. The posted speed of the road is 80 km/h. The total length of the selected segment is about 3.8 km, and then it is ensured that data collected on this facility are compatible for the analysis with respect to uninterrupted flow facilities. 10 The following criteria were also considered in the route selection process:
The route was divided with physical median;
The surfaces of the route were in good condition;
The traffic streams were donated by passenger vehicles;
The roadside development was not intense.

Data collection segment.
These criteria assure that the instrumented vehicle could travel under a condition with small interference caused by traffic traveling in the opposite direction, presence of non-motorized or pedestrian, presence of heavy vehicle, and poor road surface.
The equipment system of data collection was mainly composed of a laser rangefinder, a Global Positioning System (GPS), and a micro-computer. The laser rangefinder was used to measure the following distance, a distance from the front of the following vehicle to the rear of the associated leading vehicle. Its measuring range can reach 200 m, and it has an accuracy of 0.01 m. The GPS can locate the position of the instrumented vehicle by measuring its latitude and longitude coordinates. It has a positional accuracy of 10 mm + 2 ppm2. The micro-computer was used as a data-recording terminal. Other equipment included a video camera used to record the experimental scenario and a laptop installed with the related software to read data from the micro-computer.
As shown in Figure 2, we fixed the laser rangefinder on the dashboard behind the windshield and adjusted its pitch angle to keep it irradiate at the rear plate of the leading vehicle. The GPS was fixed at the middle of the vehicle. The camera stood on the backrest of the rear seat so that it could record the test driver’s maneuver and road traffic conditions ahead. The micro-computer and the laptop were placed on the rear passenger seat. The instrumented vehicle was a Hyundai SONATA with manual transmission. Its discharge capacity is 2.0 L. This type of vehicle is common and representative for vehicles traveling on roads.

Equipment and the instrumented vehicle.
Subjects included 18 novice drivers and 16 experienced drivers. Two standards were used to distinguish novice and experienced drivers: (1) number of years for holding licenses and (2) cumulative mileage. Drivers with driving age of less than 3 years or with cumulative mileages less than 30,000 km were classified into the novice group, while others were categorized as experienced drivers. The results of the t-test indicated that both the age and gender between the novice subjects and the experienced subjects did not show statistical differences. Ages of the novice subjects were between 24 and 45 years and their average age was 32 years, and ages of the experienced subjects were between 29 and 49 years and their average age was 37.5 years. Mileages of novice subjects varied from 6000 to 25,000 km with an average of 15,000 km, while mileages of experienced subjects varied from 35,000 to 2,50,000 km with an average of 1,50,000 km. Male subjects accounted for about 60% of the all subjects.
The experiment was conducted in sunny days and daytime, including three typical time periods: morning peak hour: 8:00 am to 9:00 am; off-peak hour: 10:00 am to 11:00 am; and evening peak hour: 17:00 pm to 19:00 pm. Before the experiment, the experimenter did not tell the subjects the purpose of the experiment, and did not require them to reach a location at a certain time, thus avoiding the possible influence on the results caused by time pressure. The formal experiment process was as follows: each subject could drive the instrumented vehicle for 15 min to adapt to the operation of this vehicle. Then each subject drove the instrumented vehicle on the selected route for about 45 min. In the experiment process, following distances between the instrumented vehicle and its leading vehicle were measured by the laser rangefinder at every sampling interval (1.0 s), and positions of the instrumented vehicle were located by the GPS at every sampling interval.
Temporal trajectories of the instrumented vehicle and its following distance were directly recorded. The raw data referred to position coordinates were measured with high accuracy by the GPS. However, there were some problems with the following distances: (1) missing data due to reflectivity, steering of the vehicle pairs, and other factors; (2) random measurement errors. Post-processing of the data of following distance should be conducted so that trajectories of the leading vehicles with high accuracy could be reached. In this work, locally weighted regression was used to develop leading vehicles’ trajectory profiles. According to Toledo’s 20 analysis, this method is robust regarding measurement of random errors and missing values.
By means of the data processing proposed above, the data set per second contained a following distance and two location coordinates corresponding to the instrumented vehicle and its leading vehicle. Then, we can directly calculate speed, following distance, and time gap. Furthermore, spacing and headway were calculated according to their relationships with following distance and time gap. These relationships are determined by adding an item with respect to the contribution of leading vehicle’s length

where g is the time gap (s), v is the running speed (km/h), d is the following distance (m),
Results of data analysis
Spacing
A total of 116,112 spacing measurements were taken from the experiment including 59,750 and 56,362 spacing measurements with respect to novice drivers and experienced drivers, respectively. Summary statistics for spacing at different speed intervals are given in Table 1. Note that due to the small size of samples at higher speed intervals (>80 km/h), the analyses to the results at these speed intervals were not carried out. Student’s t-tests were conducted in this study to identify whether the differences in spacing between novice drivers and experienced drivers were statistically significant. With a 95% level of confidence, the p-values of the t-tests are given in Table 1. The mean spacing for every individual novice drivers and experienced drivers at different speed intervals are compared in Figure 3.
Summary statistics of spacing (m).

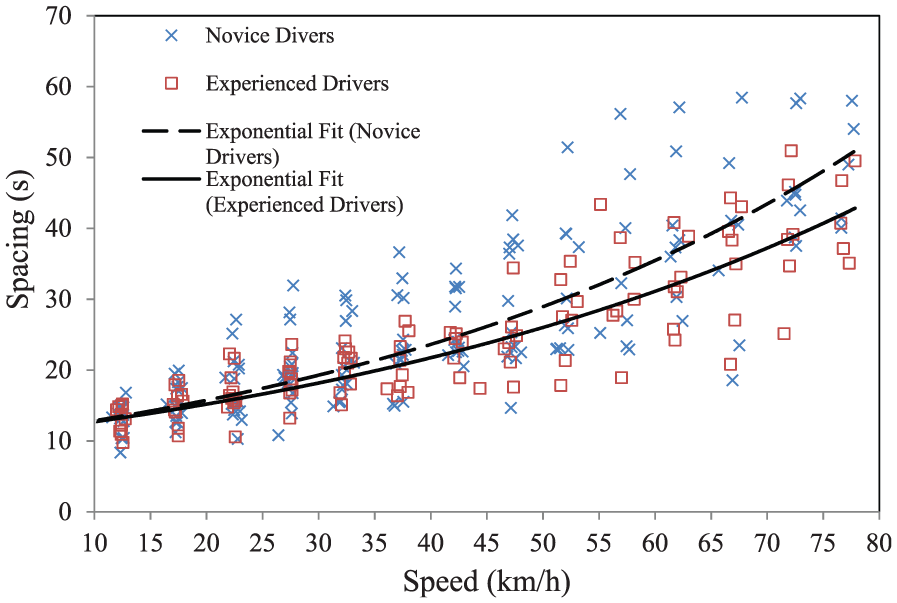
Speed versus spacing relationships with exponential fit.
According to Table 1, we can find that novice drivers tend to maintain larger spacing than experienced drivers do. With a 95% level of confidence, the differences in mean spacing between novice and experienced drivers were found to be statistically significant. These differences range from 0.47 m at the speed interval of 5–10 km/h to 7.54 m at the speed interval of 45–50 km/h. Moreover, novice drivers generally have larger standard deviations, which may be caused by their longer lags of speed adaptation to the speed variances of the leading vehicles. In addition, it is indicated that the mean spacing increases with an increase in operating speed for both novice and experienced drivers.
As shown in Figure 3, exponential regression models were fitted to relate the speeds to the individual mean spacing over each novice and experienced drivers. It was found that both of the exponential regressions perform well with


According to the analysis above, it can be expected that the presence of novice drivers can lead to a reduction in roadway capacity since they usually select to drive at larger spacing as compared to those selected by experienced drivers.
Headway
Naturally, the sample size of headway was the same as the one of spacing. Summary statistics of headways are given in Table 2. Student’s t-tests were also conducted to identify whether the differences in headways between novice and experienced drivers were statistically significant. With a 95% level of confidence, the p-values of the t-test are reported in Table 2. The mean headway for every individual novice drivers and experienced drivers at different speed intervals is compared in Figure 4.
Summary statistics of headway (s).


Speed versus headway relationships with power fit.
Table 2 denotes that the headways maintained by novice drivers are always greater than those maintained by experienced drivers (excluding the speed interval of 10–15 km/h). The differences in mean headway between novice and experienced drivers were found to be statistically significant with a 95% level of confidence. Novice drivers also have larger standard deviations of headway, which, as discussed before, may relate to their poor abilities of speed adaptation. As can be expected, the mean headways have general decreasing relationships with operating speeds.
As shown in Figure 6, power regression models were fitted to relate the speeds to the individual mean headways over novice and experienced drivers. It was found that power regression performed well with


In general, novice drivers choose to drive with relatively larger headways than experienced drivers do. According to Van Winsum,6,16 it can be considered as a mechanism in which novice drivers compensated for their poor perception of variance of following distance by keeping larger headways in driving skill level. Then, the significant larger mean headway in the traffic stream suggests that capacity reduction is possible in response with the presence of novice drivers.
Development of the novice driver adjustment factor
The on-road study in this research along with past researches have shown that novice drivers’ car-following behaviors can greatly impact the efficient of traffic stream with respect to capacity. The product of this research is to provide the quantified adjustment factors to support the current methodology.
The method of developing the novice driver adjustment factor is given in equation (10) and, according to the data analysis results, it can be further expressed as
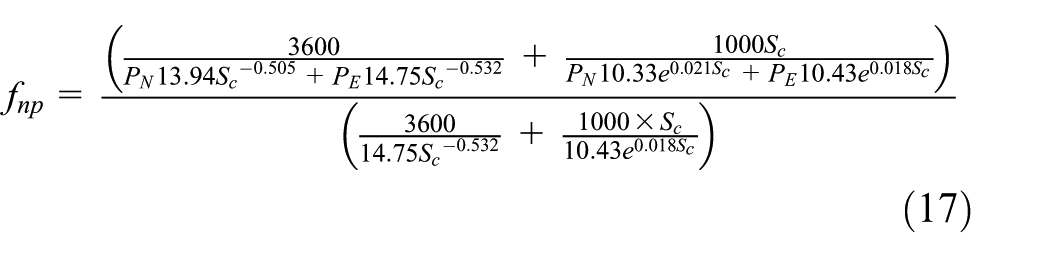
Using equation (17), the novice driver adjustment factors are calculated and are presented in Table 3 and Figure 5. The proposed adjustment factors range from 1.000 to 0.872 associated with the increasing proportion of novice drivers, which indicates that up to about 13% reduction in capacity occurs when 100% novice drivers exist on the whole road and travel with an average speed of 90 km/h. The curves in Figure 5 also show that as critical operating speed increases, the rate of capacity reduction increases. For example, the rate of capacity reduction ranges from 0% to 10% for a traffic stream with an average speed of 60 km/h, while the maximum rate of capacity reduction grows up to 13% for a stream with an average speed of 90 km/h. Then, it can be concluded that operating speed contributes to the reduction in capacity. Such result implies that critical operating speed should be determined when the proposed adjustment factors are used in practical engineering applications.
Novice driver adjustment factors for capacities of basic roadway segments.


Novice driver adjustment factors for capacities of basic roadway segments.
The lookup table above provides a quantified way for engineers and designers to make adjustments to their capacity estimations by implementing the novice driver factors. These adjustment factors can be used combined with other adjustments proposed in the HCM to perform capacity analysis for roadway segments. The capacity of a given roadway segment can be calculated as follows

where
Validation
In this section, the validity of using the novice driver adjustment factors is to be tested by comparing the estimated capacities adjusted by the novice driver factors to measured capacities, as well as estimations without a consideration of the novice driver factors. These measured capacities were taken from the data observed at the selected roadway segments by Traffic Management Authority in Nanjing. All the selected segments satisfy the following conditions: (1) lane width ≥3.5 m, (2) divided median type, (3) few accesses, (4) good surface conditions, and (5) low intensity of commercial or residential developments. A total of 11 roadway segments in Nanjing area were selected. Most of them connect the central area of Nanjing to other suburban areas. The measured capacities varied from 1815 to 2103 pc/h/ln. According to the official statistics on number of drivers in Nanjing, drivers with driving ages less than or equal 3 years occupies about 36% of the total drivers. Due to the reason that it is difficult to identify cumulative mileages of a driver, we approximately implement the values of 30% and 20% as the percentage of novice drivers for this validation work. A summary description of the validation results are given in Table 4, and the relationships between the three kinds of measured capacities and the estimated capacities are plotted in Figure 6. The mean absolute percent error (MAPE) was used to measure the differences between the measured capacities and the estimated capacities. The MAPE value can be calculated using the following equation

where n is the number of measurements,
Summary descriptions of measured and estimated capacities.


Relationships between measured and estimated capacities.
The critical speeds shown in Table 4 were calculated using the speed–flow relationships of multilane highway proposed in the HCM. As can be seen from Table 4 and Figure 6, the estimated capacities without a consideration of the novice driver factors are biased toward overestimating the measured capacities, and this bias is partly eliminated using the novice driver adjustment factors. More especially, the MAPE value reduces from 6.15% to 3.55% regarding 20% as the proportion of novice drivers and to 2.85% regarding 30% as the proportion of novice drivers. It can be considered that taking 30% as the percentage of novice drivers may be closer to the real proportion. In general, the test results confirm that the accuracy of capacity estimation can be improved by making adjustment for quantifying the factor with respect to novice drivers’ car-following behaviors.
It is worth noting that the proportion of novice drivers in total driver population is difficult to be determined accurately. Nevertheless, as can be seen in this section, the accuracy of capacity estimation can be improved significantly by means of determining a reasonable range of the proportion of novice drivers.
Conclusion
This article presented an investigation into the effects of novice drivers on capacity of roadway segments. Using the car-following data collected by the on-road experiments, we compared the spacing and headways maintained by novice drivers and experienced drivers, respectively. Based on the data analysis, the following conclusions are made.
The difference in car-following behavioral data of spacing and headways are statistically significant for novice and experienced drivers. In general, novice drivers usually prefer driving at larger spacing and headways than experienced drivers do, and this difference tends to enhance with an increase in operating speed.
By relating spacing and headway to traffic flow rate and using the fitted relationships between speed, and spacing and headway, we provide the way of developing the novice driver adjustment factor. It was found that the reduction in capacity increases with an increase in the proportion of novice drivers in a traffic stream. The reduction grows up to about 13% as 100% novice drivers exist on the whole road with an average operating speed of 90 km/h. Moreover, as the operating speed increases, the rate of capacity reduction increases. It is indicated that in addition to the proportion of novice drivers, critical operating speed should be determined when the proposed adjustment factors are used in the estimation of roadway capacity. Compared to the estimated capacities without a consideration of the novice driver factor, the estimated results further adjusted by the novice driver factor show better consistency with the measured capacities.
The novice driver adjustment factor developed in this research can be directly used to quantify the impacts of novice drivers’ car-following behaviors on capacities of basic roadway segments. However, before the proposed adjustment factors are to be used in practical engineering applications, additional research is needed to test the transferability of the research results to other driving environment and interrupted-flow facilities. Furthermore, a number of other factors may also affect the car-following behaviors of novice drivers, such as their gender, age, and social economic characteristics. The authors recommend that future studies may focus on these issues. In addition to capacity, other key traffic performance measures such as capacity drop are also needed to be investigated considering the presence of novice drivers.
Footnotes
Academic Editor: Hai Xiang Lin
Declaration of conflicting interests
The author(s) declared no potential conflicts of interest with respect to the research, authorship, and/or publication of this article.
Funding
The author(s) disclosed receipt of the following financial support for the research, authorship, and/or publication of this article: This research was funded by the Fundamental Research Funds for the Central Universities of China (no. 2015B29614), the National Natural Science Foundation of China (no. 71501061), the Natural Science Foundation of Jiangsu Province (no. BK20150821), and the Science and Technology Plan of Hubei Provincial Transportation Department (no. 2016-13-1-3).