
Abstract
In this study, we attempted a novel drag reduction technique for 25° and 35° Ahmed models by experimenting with two types of flap structures, respectively, added to the slant edges of the two models. Different pairs of flaps were added at various angles compared to the slant for the sake of comparison. The study comprehensively analyzed the effects of the “big-type” and “small-type” flaps on the aerodynamic drag and near wake of an Ahmed model in a greater range of flap mounting angles. Parametric analysis results confirmed that large and small flaps are most efficient when configured on the 25° Ahmed model at specific angles; up to 21% pressure coefficient reduction was achieved for the 25° Ahmed model (flap configurations at slant side edge) and 6% for the 35° Ahmed model (flap configurations at both slant side and top edges). The velocity and pressure contours indicated that the key to drag reduction is to weaken (if not eliminate) the longitudinal vortex created at the side edges of the rear slant.
Introduction
Reducing the global consumption of vehicle fuel is a crucial and urgent necessity if we are to respond swiftly and appropriately to climate change. Research on drag reduction, which enhances fuel efficiency, thus represents a very significant environmental concern. To reduce aerodynamic drag effectively, we surely need a comprehensive understanding of the flow structure around the vehicle. The air drag surrounding an automobile, for example, is mainly constituted of pressure drag and friction drag. For a basic bluff vehicle type of body (i.e. the Ahmed model), up to 85% of the total drag is pressure drag and the remainder is friction drag. 1 Ahmed et al. 1 also found that the rear end contributes as much as 91% to the total pressure drag and is especially predominant at high speeds, as confirmed by Hucho and Sovran 2 in 1993.
There have been numerous previous studies on the Ahmed body, which is a simplified car model of 3D bluff shape; its front is designed to be blunt so that the flow cannot separate and aerodynamic forces depend instead largely on the flow structure created on the rear. The wake of the Ahmed model is a series of fully 3D complex flows which are directly linked to the coherent structures in the vehicle as reported by Vino and Watkins 3 and Beaudoin and Aider. 4 The flow structures contain three major components: The recirculation bubble over the rear slant, the longitudinal vortices created on the side edges or C-pillars of the slant, and the recirculation torus on the base of the model.
There is an interesting relationship (or competition) between these three types of flow structures along with the slant angle of the upper rear surface of the model. Previous studies on the wake of the Ahmed model,1,5–7 via both experimentation and numerical simulation, have observed the critical angle to be around 30°—after this point, there is an abrupt decrease in drag along with a full separation of the rear flow after increasing sharply to the maximum drag value. 2 Wang’s previously published article 8 provides a helpful schematic diagram of the coherent structures for the 25° and 35° Ahmed models. With a slant angle of 25°, the flow separates at the lower edge of the slant and the two counter-rotating longitudinal vortices are dominant throughout the entire flow structure; at the slant angle of 35°, conversely, it separates at the upper edge of the slant along with a burst in the longitudinal vortices.9,10
Several previous researchers have explored flow control techniques both experimentally and by simulation over a 3D bluff body. Mixed results, some quite favorable, have been achieved by applying active or passive techniques. The active steady-state flow method, as first introduced by Aubrun et al. 11 in their research on wake flow reduction and control, can be used to cut the drag coefficient by 9%–12% and the lift by 42%. Khalighi et al. 12 carried out wind tunnel tests and computational investigation on the transient wake flow structures of a bluff body equipped with a plate-shape drag reduction device, they succeeded in modifying the flow field behind the test model by disturbing the shear layer. As a consequence, the closure of the wake is altered and reductions in aerodynamic drag of more than 20% are observed. Howell et al. 13 conducted applied dents and through-holes to the zero-degree Ahmed model for drag reduction. Beaudoin and Aider 4 from Peugeot-Citroen mounted tail fins on all edges of both surfaces at the tail of the 30° Ahmed model to secure a drag coefficient reduction of 25%. Castejon et al. 14 achieved automobile drag reduction for the SAE model (proposed by Society of Automotive Engineers) without reducing the automobile aerodynamic stability. The drag reduction of a pickup truck by a rear downward flap was examined computationally and experimentally in the study of Ha et al. 15 Fourrie et al. 16 carried out experimental investigations to study the drag reduction in a generic car model using a deflector. They achieved a drag reduction of up to 9%. Altaf et al. 17 studied the shape, sizing, and design of flaps for drag reduction of bluff bodies in heavy vehicle aerodynamics. Hanfeng et al. 18 experimentally investigated the effects of deflectors on the aerodynamic drag and near wake of an Ahmed model with a 25° slant angle.
Insightful research into the flow structures and the mechanism of controlling aerodynamic drag has shown that the key to reducing drag is the control of the flow separation and large coherent structures. The previous studies improved the near wake of an Ahmed model with a 25° and 35° slant angle and then reduced the aerodynamic drag by employing flow control techniques. But their research variables were relatively single and the experiments were conducted at the critical flap mounting angle between α = 0° and α = 80°, the conclusions may not be applicable for other flap mounting angles. We comprehensively analyzed the effects of the “big-type” and “small-type” flaps on the aerodynamic drag and near wake of an Ahmed model in a greater range of flap mounting angles. The primary goal of this study was to successfully utilize specific actuators to modify the flow structures of 25° and 35° Ahmed models so as to reduce drag and select the optimal solution in different situations.
Simulation details
3D bluff body and actuators
The Ahmed model used here, as it was first described in 1984, is the equivalent of one quarter the size of a real automobile (Figure 1). To improve the simulation efficiency, we used the half model in our steady formulation experiment. Like the rear window of a car, the slant surface takes an angle relative to the horizon.

Dimensions of the Ahmed vehicle model (length (mm); angle (°)).
Although many of the classical steady-state Reynolds-averaged Navier–Stokes (RANS) approaches have some difficulties in capturing the main flow features, especially slightly below the critical slant angle, some other works, such as the one from Craft et al., 19 showed also that with a proper combination of theoretical modeling and numerical setup, the steady-state RANS turbulence closure strategies can lead to surprisingly good quantitative predictions of the aerodynamic force coefficients. And our previous work has compared the Cd values obtained by our simulation with the experimental results of Ahmed et al. 1 (Figure 2), the simulation results are closed to the experimental results, and the error is very small. Additionally, because of the limitation of time and computing hardware resources, the steady RANS is used to simulate the time-averaged flow field in this study, so the velocity got in the simulation is time-averaged velocity not instantaneous velocity. And as mentioned above, we examined the aerodynamic forces of 25°and 35° slant angles with various flap configurations.
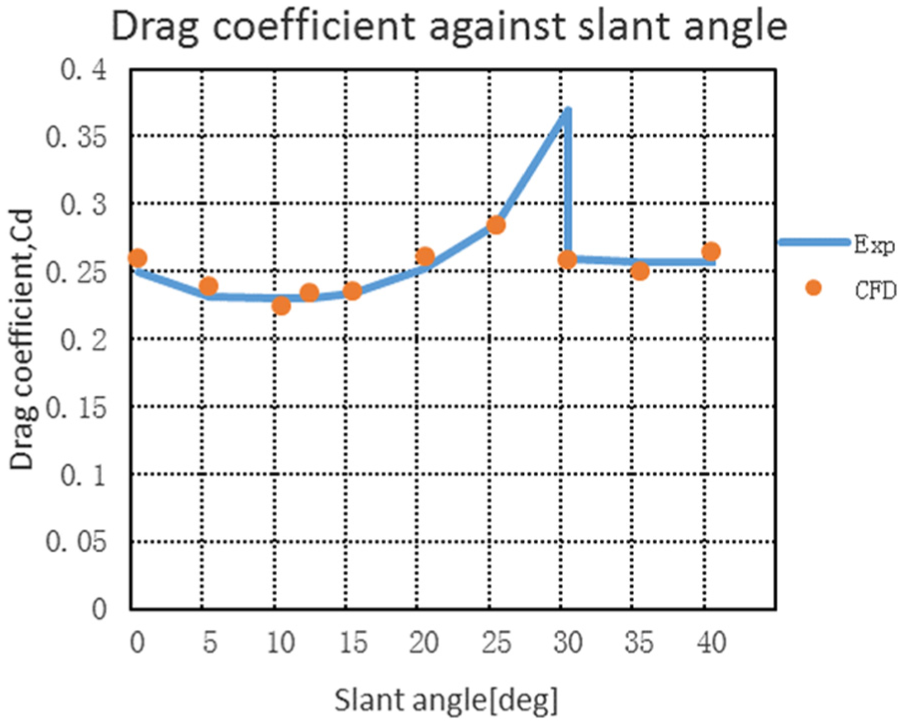
Comparison between numerical and experimental results.
There are two types of flap shape used here: large (also called “big” in this article), which was 1 mm in thickness and 20 mm in height, and small which was 1 mm in thickness and 8 mm in height; both were 4 mm in width with an interval of 12 mm (Figure 3). The flap structures were configured at the four edges of the slant as “top-type,”“side-type,” or “bottom-type” (Figure 4), α=0° corresponds to the flaps parallel to the slant surface.

Detailed characteristics of the two flap shapes: (a) big and (b) small.

Configurations of flap structures at the four edges of slant surfaces: (a) top-type, (b) side-type, and (c) bottom-type.
Parameters
Numerical simulation can achieve useful and accurate results with the notable advancements in computational fluid dynamics (CFD). Simulation facilitates the rapid development of new devices while saving cost, but does come with some amount of uncertainty in terms of accuracy. To improve the accuracy of our simulations which we ran in STAR-CCM+ software (CD-adapco), we researched the turbulent model, mesh style, and mesh size on three levels: whole aerodynamic drag coefficients, partial coefficients, and known statistics of the flow field put forward by Makowski and Kim. 20 To determine the steady flow structures which can efficiently reflect the main vortices, 21 we utilized primarily tetrahedral unstructured mesh of 5 mm in size in the SST k–ω turbulence model.
Using the 35° Ahmed model tested in 1984 1 as our standard case, we set the simulation parameters as similar as possible to the following:
Mesh domain: 15 × 3 × 1.5 m3;
Velocity inlet: 60 m/s;
Pressure outlet: P = 0;
Reynolds number Re = 4.29 × 10⁶, character length = 1.044 m;
Turbulence intensity: <0.5%.
The model is four times its own length away from the inlet and eight times its own length from the outlet, which is sufficient to guarantee adequate air flow growth around the vehicle. The distance (50 mm) between the model and the ground is the same as that in a standard wind tunnel test. 22 Figure 5 shows the layout of the model and mesh which involves two blocks of grid refinement.

Layout of model and mesh space.
To ensure a favorable simulation of the boundary layer flow near the model, we employed a prism layer mesh with five layers to control the y+ value between 20 and 100 (Figure 6). We have done the grid independence research in the previous work to make sure the simulation results are irrelevant to the mesh model. The results of the grid independency study were shown in Table 1. There is a maximum variation of only 9% between the coarsest and finest meshing used, so the results are assumed to be largely grid independent. So we followed the previous mature simulation method in this project. The total number of cells of our half model is about 5 million, which ensures simulation accuracy.

(a) Prism layer mesh around the model and (b) y+ value contour.
The results of the grid independency study.

Parametric study of various flap configurations
Simulation validation
Aerodynamic drag is mainly pressure drag, so we paid only cursory attention to the friction coefficient and instead considered the pressure drag coefficient as our primary research object. In this article, Cp* is total pressure drag coefficient, Ck* is the forebody pressure drag coefficient, Cb* is the vertical base pressure drag coefficient, and Cs* is the slant surface pressure drag coefficient. To verify the simulation accuracy, we compared published 35° Ahmed model experiment results against our simulation.
Table 2 shows a comparison between the experimental data 1 and results based on the converged simulation of the 35° Ahmed model. Errors between the CFD results and wind tunnel experiment results were small, so the errors meet the engineering application requirement of 5%.
Comparison between the experiment data and simulated 35° Ahmed model.

CFD: computational fluid dynamics.
We also compared the velocity at the x direction between the experiment 5 and simulation. Much of the data came from a paper by Lienhart and Becker 5 which describes the velocity distribution in the wake of the model. The experiment database was accessed online through the ERCOFTAC homepage. We evaluated the accuracy of our simulations with experimental velocity at five lines including the date both at slant and the base in the symmetry plane (Figure 7) and used that as the verification standard. As shown in Figure 8, the x component velocity of the simulation matches closely with the experimental velocity development at the z position. But there is a deviation between CFD data and the experiment, this may be because the flow separation at the slant surface is difficult to predict and the k–ω turbulence model cannot simulate the turbulence structure very accurately.
Data comparison: x = −0.163 m; x = −0.123 m; x = −0.083 m; x = −0.043 m; x = 0.037 m at symmetry plane. Origins of coordinate system: x = 0 (end of the car); y = 0 (symmetry plane); z = 0 (ground plane).

X component velocity comparison between CFD and experiment in the shear layer.
From the comparison between the simulation results and the experimental results reported in the previous literature1,5 above, we can confirm that the simulation is credible and the results obtained without flow control are accurate.
Drag reduction of 25° Ahmed model
Top-type flap configuration
The configuration of flaps at the junction between the roof and the slant has a common feature of the roof spoiler of a real automobile. In this study, we explored two types of structures in continuous and discontinuous shapes, that is, “big” and “small” types (Figure 3). Varying the configuration alters the flow direction from the roof, as well as transforms separation bubbles on the slant which may consequently change the pressure drag coefficient. By varying the angle of the flap to the slant surface (α = 0° corresponds to the flap aligned with the slant wall), we conducted a parametric analysis of changes in pressure drag coefficient. As shown in Figure 9, the pressure drag coefficient changes with flap angle as the configuration of big and small flaps changes. For the large flap type, we found that as angle α increased, the pressure drag coefficient first decreased and then increased (as expected). Between α = 10° and α = 20°, there were some sharp drop in the curve. This is because the pressure changed a lot at the slant surface, we can see that from Figure 10. When α was about 20°, approximately parallel to the roof, the pressure drag coefficient reached its minimum value—44 counts (1 drag count = 10−3) less than the baseline model. Beaudoin and Aider 4 achieved 54 counts drag reduction for Uo = 40 m/s in their experimental study when α was about 25°, approximately parallel to the roof (the slant angle of their Ahmed model is 30°). When α exceeded 20°, the pressure drag coefficient increased until reaching the original level of the Ahmed model at about 60°, which is consistent with the experimental results presented in Beaudoin and Aider. 4 As α continued to increase, pressure drag coefficient increased due to the drag reduction effect of the flap configuration was lower than the drag produced from the flap itself. The pressure drag coefficient reached its maximum value (before beginning to decrease) when α = 115°, that is, when the flap was vertical to the roof.

CFD drag evolution results of top-type flaps with different flap angles for 25° Ahmed model.

Pressure distribution on the slant surface: (a) top_big_10 and (b) top_big_20.
Similar reduction was observed with the small-type flap configurations. There was a reduction in the pressure drag coefficient when the angle increased from 0 to 40° and reached its minimum (−44 counts) when α = 40°. Between α = 20° and α = 30°, there were also some sharp drop in the curve. The change of the pressure at the slant surface is similar to the big-type flap. The pressure drag coefficient then increased slightly and remained a relatively stable level (and still under the original value) until the end of the simulation.
Table 3 shows a comparison between the original and modified models with the top configuration of a big-type flap at 20° (Top_big_20) and small-type flaps at 40° (Top_small_40). The slant surface was mostly responsible for the reduction (−61 counts), while there was an increase in pressure drag coefficient at the vertical base (+13 counts) in Top_big_20. There was a 47-count reduction of the slant surface pressure drag coefficient in Top_small_40 and almost no change in the vertical base pressure drag coefficient compared to the baseline.
Comparison of standard 25° Ahmed model with Top_big_20 and Top_small_40.

Side-type flap configuration
It is well known that the side edges of a slant surface are the positions at which longitudinal vortices (C-pillar vortex) are generated, that is, why we set the flap on these positions. The longitudinal vortices on the side edges interacting with the separation bubbles on the slant surface 4 are the predominant source of drag of the 25° Ahmed model. By configuring big- and small-type flaps on the side edges (α = 0° corresponds to the flaps laying over the rear slant), we are able to destroy the longitudinal vortices effectually.
As shown in Figure 11, for the big-type flap, the pressure drag coefficient was basically invariant until α = 40° at which point it began to decrease. There was a critical moment when the flap approached a vertical position to the slant surface—specifically, the pressure drag coefficient dropped to its minimum at α = 80° with a 52-count reduction. This trend is consistent with the experimental results in Beaudoin and Aider; 4 Beaudoin and Aider first observed a plateau for 0° < α < 67° before a sharp drag reduction (nearly 62 counts for Uo = 40 m/s) for αopt ≈ 70°. It is well known that the drag value is strongly dependent of the slant angle, 1 and for a more rounded bluff body, or even a real car, the drag coefficient can be much more Reynolds dependant, 4 so the small errors between the simulation results and the experimental results are understandable. Figure 12 shows that the pressure at the slant surface was reduced surprisingly, so there was some sharp drop in the curve. The pressure drag coefficient in present work then continued to increase and remained lower than the original model throughout the simulation. In effect, the big-type flap varied the pressure distribution on the slant surface by damaging or even preventing entirely the formation of longitudinal vortices. Certain flap angles caused greater extent of damage.

CFD drag evolution results of side-type flaps with different flap angles for 25° Ahmed model.

Pressure distribution on the slant surface: (a) Side_big_70 and (b) Side_big_80.
For the small-type flaps, there was nearly no reduction effect. Conversely, the pressure drag coefficient exceeded the original model. This can be attributed to the fact that the discontinuous flaps are unable to stop the crimping process of the longitudinal vortices, that is, the small flaps were unable to damage the vortices. This observation further confirms that preventing the crimping process of the longitudinal vortices results in drag reduction.
Table 4 shows a comparison between the original and modified models with the side configuration of the big-type flap at 80° (Side_big_80). There was an overall reduction of 52 counts: The pressure drag coefficient of the slant surface (Cs*) was reduced by 48 counts and the pressure drag coefficient of the vertical base (Cb*) by 7 counts.
Comparison of standard 25° Ahmed model with Side_big_80.

Bottom-type flap configuration
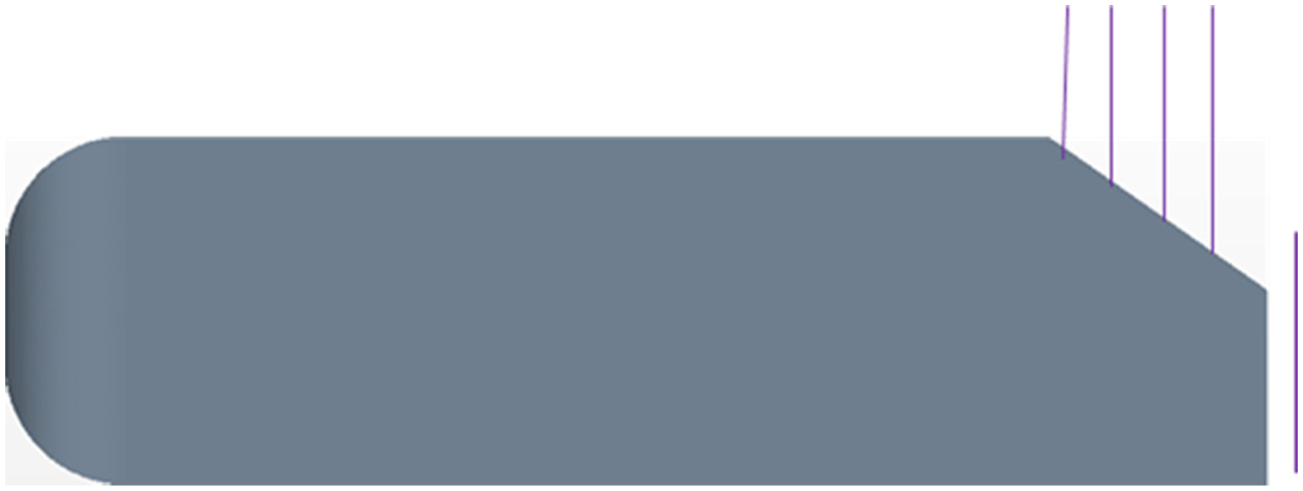
The flap configuration at the junction between the rear slant and the vertical base is designed to modify the recirculation bubble on the slant surface and the torus on the vertical base of the model. Flaps placed here can stop the flow along the slant surface and raise it (α = 0° corresponds to the flap aligned with the slant wall). Although this may lead to a stronger separation on the slant, the upward trend of separation flow, in turn, will constrain the longitudinal vortices and reduce the drag.
As shown in Figure 13, for the big-type flap, there was some reduction at small α angles (0°–40°) but not much. At 50°, the pressure drag coefficient suddenly increased but then continuously decreased until reaching its minimum at α = 130° (−28 counts). The inverse changing trend from α = 180° to α = 150° is similar to the changing trend from α = 65° to α = 95° in Beaudoin and Aider. 4 In Beaudoin and Aider, 4 the α = 0 case corresponds to a vertical flap along the vertical wall of the afterbody, from 65° to 95°, the drag decreases nearly linearly toward a 24-count reduction for α = 95°. Between α = 150° and α = 160°, there were some sharp rise in the curve; this is because the flap in the upper part of the plane has positive effects to the flow separation when α = 150°; however, when α = 160°, the flap in the lower part of the plane and the flow field is very different from the one when α = 150°. So their effects to the pressure drag coefficient are different.
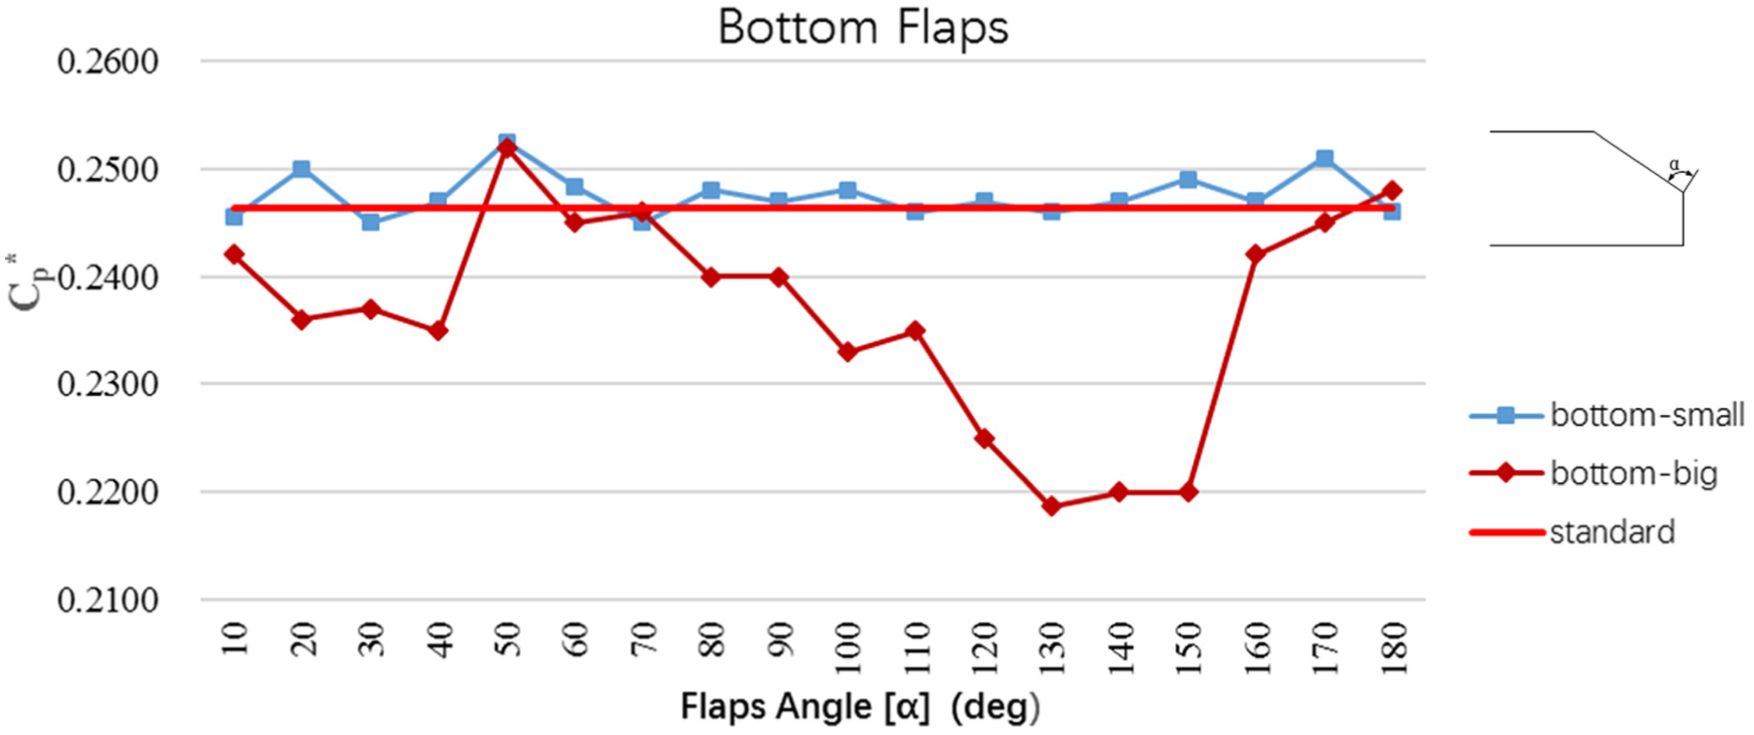
CFD drag evolution results of bottom-type flaps with different flap angles for 25° Ahmed model.
For the small flaps configured on the bottom edge of slant, there was no reduction in pressure drag coefficient regardless of the angle. In effect, the small flaps cannot prevent flow from the slant.
Table 5 shows a comparison between the original and modified models with the bottom configuration of the big-type flap at 130° (Bottom_big_130). The slant surface accounted for most of the reduction (−35 counts), while there was an increase of pressure drag coefficient at the vertical base (+5 counts).
Comparison of standard 25° Ahmed model with Bottom_big_130.

Combination of different configurations
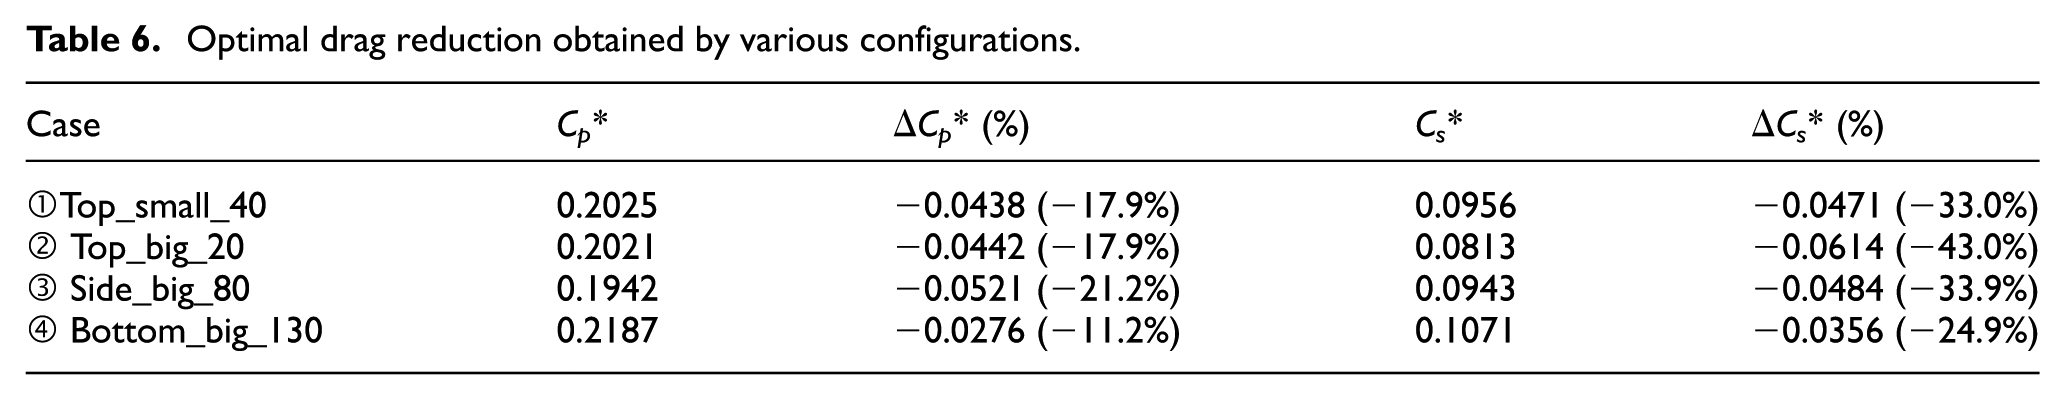
According to the above results, there are four categories of schemes which enhance drag reduction for the 25° Ahmed model: Top_small_40, Top_big_20, Side_big_80, and Bottom_big_130, and marked as ①, ②, ③, and ④, respectively in Table 6. Clearly, the most efficient way to reduce the pressure drag coefficient is to modify the flow circulation around the side edges of the slant (configuration ③). The configurations at the top side of the slant surface both with large and small flaps are more efficient than the bottom configuration. Interestingly, the slant surface pressure drag coefficient decreased markedly under all of these configurations.
Optimal drag reduction obtained by various configurations.
We created several combinations of the configurations in order to test another seven schemes: ①+③, ①+④, ②+③, ②+④, ③+④, ①+③+④, and ②+③+④. The results are shown in Table 7. No one combination was any more efficient than the single configuration of ③, that is, there was no accumulative effect to the configurations.
Results of combination schemes for 25° Ahmed model.

Drag reduction of 35° Ahmed model
Optimal 35° Ahmed model configuration
Because the 35° Ahmed model itself is in low drag regime, most of our configurations for the 35° Ahmed were not as remarkable as the configurations in the 25° Ahmed model. The optimal scheme of the 35° Ahmed model, Top_big_30 (Top_big_30 for a 35° slant angle and Top_big_20 for a 25° slant angle correspond to the same location of the flap), had a 9-count reduction in total pressure drag coefficient mostly due to the contribution of the slant surface (Table 8).
Comparison of standard 35° Ahmed model with Top_big_30.

Combinations of different configurations
Similarly to the 25° Ahmed model analysis, we further tested Top_big_30, Side_big_80, and Bottom_small_30 (marked as ①, ②, and ③, respectively) by testing four combination schemes: ①+②, ①+③, ②+③, and ①+②+③. The results are shown in Table 9. The reduction of pressure drag coefficient was very limited with any of the combinations. The optimal combination scheme was ①+②, at only a 12-count reduction.
Results of combination schemes for 35° Ahmed.

Drag reduction analysis and discussion
Drag reduction analysis of 25° Ahmed model
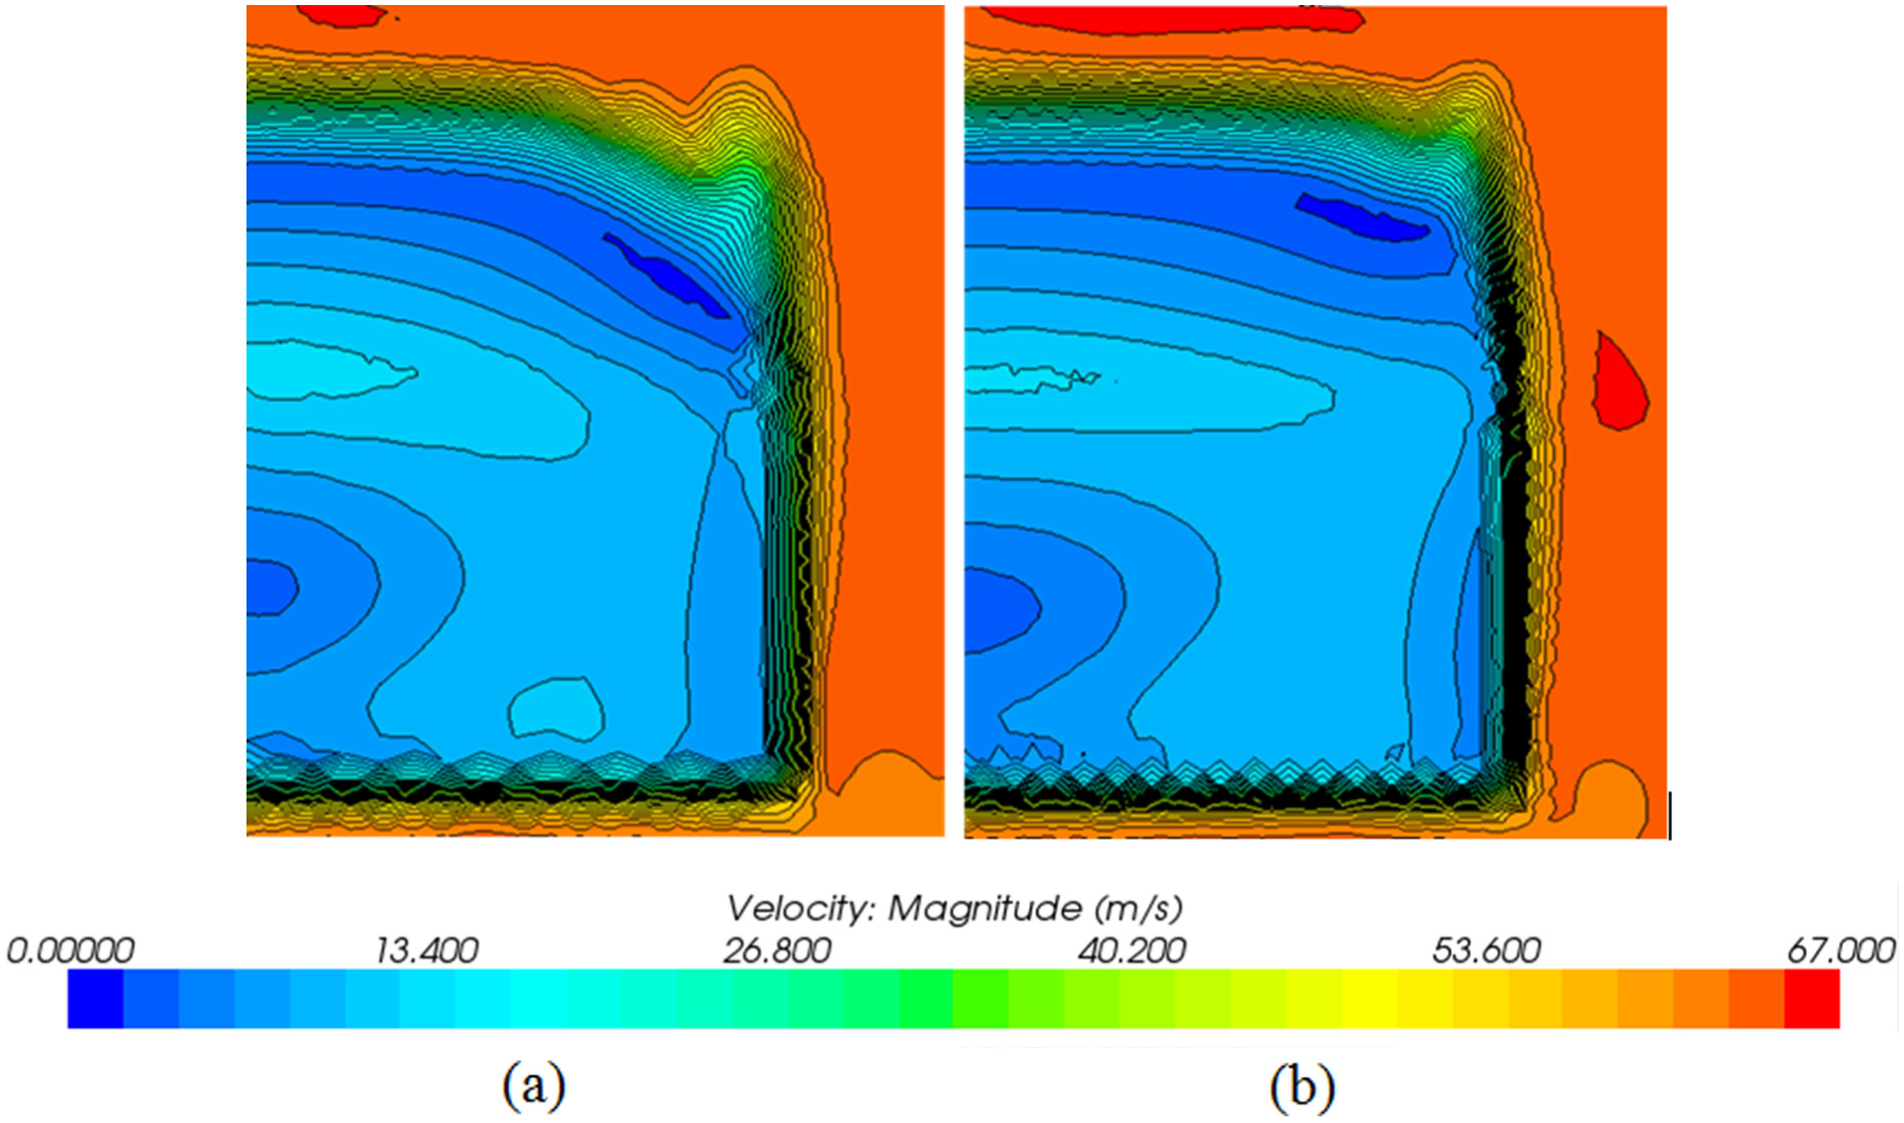
To delve further into the mechanism of drag reduction, we further compared the original 25° Ahmed model against the optimal corresponding individual configuration of Side_big_80 and Top_small_40. The velocity contours on the symmetry plane (Figure 14) indicate the flow separates after the configuration of the side big flap or top small flaps, a phenomenon which should be have increased the drag—but in fact, the total pressure drag coefficient significantly decreased as explained by the transversal velocity contours (Figure 15) on the cross-sectional plane (10 mm away from the tail) as well as the pressure distribution (Figure 16) on the slant surface.

Velocity contours on symmetry plane of (a) standard 25° Ahmed model, (b) Side_big_80, and (c) Top_small_40.

Transversal velocity contours on cross-sectional plane (10 mm from tail): (a) standard 25° Ahmed model, (b) Side_big_80, and (c) Top_small_40.

Pressure distribution on the slant surface: (a) standard 25° Ahmed model, (b) Side_big_80, and (c) Top_small_40.
Although the separation region expanded on the slant surface during the simulation, the longitudinal vortices raised and were weakened in intensity as evidenced by the transversal velocity contours in Figure 15. The expanded lower velocity region in the tail resulted from the enlarged separation region. Due to the strong interaction between the flow from the roof and the streamwise vortices created along the side edges, the strong downforce generated from the crimping process of the longitudinal vortice suppressed the separation vortex. Placing flaps on the side edges of the slant to constrain the longitudinal vortices or configuring flaps on the top of slant to raise the flow intensified the flow separation and, in turn, weakened the longitudinal vortices. Weaker longitudinal vortices caused the downforce decreased, the separation vortex strengthened, and the drag generated by flow separation is small, so the total drag decreased. This is why the separation phenomenon shown in Figure 14 did not necessarily increase the drag.
Beaudoin et al. 23 showed that longitudinal vortices are regions of low pressure which contribute to overall pressure drag. In the pressure contour shown in Figure 16, the negative pressure on the slant surface of the reduction scheme models substantially increased (i.e. the absolute pressure value decreased.). It was diluted considerably compared to the longitudinal vortices stamped on the standard Ahmed body, suggesting that longitudinal vortices were well suppressed.
As shown in Figure 17, we compared the velocity at different positions on the 25° Ahmed with Side_big_80 among experiment
5
and simulation results CFD_ with and without control. Because the experiment was conducted at various velocities, we applied non-dimensional methodology
24
to unify the velocity value with

Velocity comparison among experiment, CFD_ control, and CFD_ without control.
Drag reduction analysis of 35° Ahmed model
For the standard 35° Ahmed model, the flow separates on the top of the slant and the longitudinal vortices on the slant are very thin. The model is inherently in a low drag regime, accordingly. We compared Top_big_30 against the standard 35° Ahmed model to find out that the overall pressure drag coefficient for our scheme dropped by 9 counts (mostly contributed by the tail slant). The change from the standard model was fairly negligible apart from the fact that the separation area on the slant grew somewhat transversely and mixed better with the longitudinal vortices, which were weaker for this configuration (Figure 18(b)). As shown in Figure 19(b), the pressure on the slant of Top_big_30 increased to a certain extent compared to the baseline. Furthermore, the longitudinal vortices disappeared completely when this scheme was applied.
Transversal velocity contours on cross-sectional plane (10 mm from the tail): (a) standard 35° Ahmed model and (b) Top_big_30.

Pressure distribution on slant surface: (a) standard 35° Ahmed model and (b) Top_big_30.
Conclusion
In this study, we demonstrated the efficiency of adding specially designed flaps on the four edges of a standard Ahmed model’s slant surface to break down the longitudinal vortices and reduce the aerodynamic drag. For the 25°Ahmed model, adding flaps on any possible edge can weaken the longitudinal vortices. Vortex breakdown modifies the wall pressure distribution of the slant. The optimal pressure drag coefficient reduction, 21.2%, was obtained with a large flap placed on the side at 80° angle. There was a reduction of 17.9% for the top configuration with both large and small flaps at 40° and 20° angles, as well. Flaps placed around the slant bottom were shown to be less efficient but to allow for a reasonable pressure drag coefficient reduction, particularly a large flap at 130° (up to 11.2% drag reduction). For the 35°Ahmed model, adding flaps in any position had practically negligible effect. The optimal configuration (the combination of Top_big_30 and Side_big_80) for the 35° Ahmed model achieved only a 12-count reduction (6% drag reduction) in total pressure drag coefficient.
The flow of the original 25° Ahmed model does not separate on the slant, but creates strong longitudinal vortices along the side. The different flap configurations investigated in this study were observed to transform the flow structures into the formation of the 35° Ahmed model (low drag regime), the flow which separates at the top of the slant consists of no or little longitudinal vortices. The results of this study demonstrate a potential approach to flow control supported by the substantial drag reduction observed with various flap configurations.
Footnotes
Academic Editor: Pietro Scandura
Declaration of conflicting interests
The author(s) declared no potential conflicts of interest with respect to the research, authorship, and/or publication of this article.
Funding
The author(s) disclosed receipt of the following financial support for the research, authorship, and/or publication of this article: This project was supported by the State Key Laboratory of Automotive Simulation and Control in Jilin University, the Hong Kong Scholar Program, and Postdoctoral Science Foundation of China (2012M510874, 2012T50314, and 2014M551180).