
Abstract
With the rapid development of China’s container port industry, the emissions of air pollutants in port areas have been increasing. Cargo handling equipment as a non-road mobile source of emissions has become a focus of public attention. This article adopted a full activity-based “bottom-up” method to establish the inventory of emissions by cargo handling equipment at a container port. Drawing on the OFFROAD model, we conducted investigation and analysis of cargo handling equipment holdings, activity levels, and equipment-related parameters and modified the emission factors. The Nanjing Longtan Container Port was taken as a case study. Results show that in 2014, emissions by cargo handling equipment of the Nanjing Longtan Container Port were as follows: PM10 4.25 t, PM2.5 3.91 t, NOx 82.98 t, SOx 1.06 t, CO 23.84 t, and HC 16.39 t, all lower than results from an earlier research based on 2013 fuel consumption data. Cargo handling equipment produced more PM and HC emissions than any other emission source at the port. The method and main conclusions of this article provide support for future work on energy conservation and emission reduction in port areas.
Air pollutant emissions at a container port mainly come from three sources: vessels, cargo handling equipment (CHE), and heavy-duty vehicles. 1 Among them, pollutants from CHE mainly include PM, NOx, HC, COx, SOx, and other emissions that are toxic and harmful. These pollutants have negative impacts on the regional air quality, climate change, and human health.2–5
Countries including the United States and Switzerland6,7 have developed official non-road mobile source emissions inventory. Z Samaras and KH Zierock 8 adopted the method of emission factors—based on power, equipment’s engine activity, fuel type, and engine type—to calculate EU non-road mobile source emissions of atmospheric pollutants in 1990, compared the results with pollutant emissions of on-road mobile sources, and proved that non-road emissions were a major source of atmospheric pollution; Kean et al. 9 estimated NOx and PM emissions of non-road mobile sources of the United States of 1996 with the method based on fuel consumption; M Lindgren and PA Hansson 10 studied the effects of transient operating conditions on emissions of non-road diesel engine and it was concluded that the air fuel ratio had an important influence on the formation of the emission under the transient load; and P Lewis et al. 11 adopted OFFROAD model of the USEPA (United States Environmental Protection Agency) to study on the emission characteristics of non-road diesel engine with various emission data sources.
For the implementation of the San Pedro Bay Ports of the clean air action plan (CAAP) in the United States, the first global port emission inventory was compiled in the Port of Long Beach in 2004. On such a basis, in 2005, the California Air Resources Board (CARB) officially promulgated CHE management regulations and established non-road mobile source emission simulation method. On the basis of traditional OFFROAD model, they adjusted the calculation formulas of deterioration rate as an important influence parameter. 12 Compared with the road motor vehicle emission standards started in 1999, the emission control of non-road mobile sources in China started later. 13 National standard to limit exhaust emission from diesel engines of non-road mobile machinery was not released until 2007 and now the third as well as the fourth issue of emission regulations have been reached. However, the newest standard did not make any special provision on the emission limits of CHE diesel engine, just subsumed them into the scope of construction machinery instead, which would lead to the lack of clear indicators for the implementation of emission standards in port. Emission inventory is an important basis for emission control and environmental management. Compared to some developed countries’ matured emission inventory, the related researches in this field are still in the initial stage, especially the systematic researches on the emission of CHE are still scarce at present in China.
D Li et al. 13 referred to the basic method of non-road mobile source emission simulation by EPA’s NONROAD model and proposed the estimating method of pollutant emissions as well as fuel consumption of construction machinery for the first time based on the actual fuel consumption rate. As a result, they estimated fuel consumption and emissions of two types of typical construction machinery, excavator and loader in China in 2007. L Zhang et al. 14 investigated five types of non-road mobile sources in nine cities of the Pearl River Delta and adopted emission factor method based on fuel consumption to establish a list of non-road mobile source emission, which drew public attention to NOx emissions of the non-road mobile sources. X Kui 15 used the fuel consumption method, and average emission factors from results of other studies of reference, to establish the non-road mobile source emission inventory with the help of provincial yearbook of Beijing–Tianjin–Hebei region after getting date of districts and counties through distribute city-level data on a pro-rata basis and summarizing the activity data of construction machinery and other non-road mobile sources. The article also supplemented and improved emission source preparation work of the Region through gridding the emission inventory data and making qualitative analysis on the result.
There are few researches on CHE emission inventory, except for those of H Tan et al. 5 and X Jia et al. 16 In the former paper, a revised and localized calculation method was put forward on the basis of comprehensive analysis of literatures and the investigation results of various CHE in Shanghai port. The emission inventory of air pollutants from the CHE in Shanghai Port in 2010 was established. At the same time, some measures were proposed to reduce emissions and some suggestions were proposed to further improve the emission calculation. The latter paper is the previous research results of this article. The local pollutant emission factor was selected on the basis of the field investigation results of various CHE in Nanjing Longtan Container Port (NLCP). The emission inventory of air pollutants from the CHE in NLCP in 2013 was calculated by adopting fuel consumption method.
Overall, to develop the emission inventory of CHE based on fuel consumption was common practice in the existing researches (called top-down approach). There is another top-down method based on the atmospheric environment pollution samples, using the analytical model of various sources, parsing out the contributions of different emission sources of pollutants to perform source apportionment. The former neglects various activity data of different kinds of equipment and the equipment’s power, using hours, deterioration rate, and effects of different fuels, which leads to ambiguous emission characteristics and non-targeted measures to emission reduction. The latter cannot be implemented due to the lack of local emission source characteristic spectrum in China. On the other hand, some of the western countries have set local emission factor databases to build CHE’s emission inventory (called bottom-up approach), which can overcome the weaknesses of the top-down approaches, and has been proved an efficient way to solve environmental problems. 17
In this article, the bottom-up method based on activity was used. Local emission factors of CHE in container terminals were revised from the emission factor database of port of Long Beach, and other necessary factors, such as equipment power, using hours, deterioration degree, model year, engine type, the sulfur content of diesel fuel, and already used emission reduction technologies, were comprehensively taken into consideration to set up the emission inventory. NLCP was taken as a case, and the air emission inventory of CHE in 2014 was established according to the relevant data collection. In order to provide a basis for the prevention and control of air pollution in the port area, the emission results were analyzed and discussed with alternative emission reduction measurements.
Activity-based air emission inventory
Air emission inventory
The air emission inventory is a list of one or more kinds of the pollutant emissions from various sources, in a certain geographical area and a certain period of time, and plays an important role in identifying the air pollution source and the trend of evolution in the concerned area as well as using air quality model to study the formation mechanism of pollutants and formulating the control measures of air pollution prevention, which has become one of the key scientific methods for air pollution control and prevention.
Bottom-up method based on activities
To establish the emission inventory, we focus on the emission of equipment’s activity. That is, according to the total number of each kind of CHE (including the engine production year, the energy type, and equipment deterioration degree), the active power of a single device, equipment’s engine activity hours per year, emission factors and fuel correction factors (FCFs), control factors, emission reduction measures as well as other related information, the pollutant emissions of CHE were estimated one by one. Taking equipment activity and engine load into consideration, the method used in this article is a kind of bottom-up method based on activity.
With this bottom-up method based on activity, each parameter will be described in the following sections. The equation to estimate CHE emissions is given in section “Emissions estimation methodology,” and the next section describes the emission factors and associated parameters. Control factors are given in section “CHE emissions reduction technologies and control factors,” where the changes in emissions due to the use of various technologies are clearly reflected. The equipment list, the activity record, load factors and FCFs, and so on have been given in the case study part.
Establishment of air pollutant emissions inventory from CHE
Research method
Common CHE includes reach stacker, forklift, container trailer, empty container handler, the bridge crane, and rubber tired gantry (RTG) crane. The inventory includes CHE powered by diesel, gasoline, and electricity. In this article, port district was the research scope, and the equipment driven by electricity was not calculated in emission inventory. Bottom-up method based on activity was adopted as emission estimating method.
Equipment information and related parameters, such as equipment type, equipment ID, rated power of the engine, model year, engine type, cumulative running hours, and annual operating hours, were obtained by investigation (such as distribution and collection of questionnaires, observing and recording equipment activity times, and consulting ledger) and analysis with database software.
Emissions estimation methodology
The bottom-up method based on activity is a more accurate method for development of port emissions inventory.17,18 Equipment was divided into groups by engine fuel type, and pollutant emission factors were established on the basis of equipment model year as well as the engine power. FCFs and control factors were established through detailed investigation of fuel quality and emission reduction measures. The emissions calculation methodology used to estimate CHE emissions is consistent with CARB’s latest methodology for estimating emissions from CHE. 17 The basic equation used to estimate CHE emissions is as follows

where E = emissions, grams/year; Pop = Population (number of a particular CHE type in the port); Power = rated power of the engine, kW; Activity = equipment’s engine activity, h/year; LF = load factor (ratio of average load used during normal operations as compared to full load at maximum rated horsepower), dimensionless; EF = emission factor, grams of pollutant per unit of work, g/(kW h); FCF = fuel correction factor to reflect changes in fuel properties that have occurred over time, dimensionless; CF = control factor to reflect changes in emissions due to installation of emission reduction technologies not originally reflected in the emission factors, dimensionless; i, j, k, l, m = CHE type, engine type, engine power, equipment model year, and characterized pollutants; Ei,j,k,l,m = CHE emission whose engine type is j, engine power is k, equipment production year is l, CHE type is i, and calculating pollutant is m.
Emission factor
The emission factor is a function of the zero-hour emission rate by fuel type (diesel or liquefied natural gas (LNG)), CHE engine type, model year, deterioration rate, and cumulative hours. The deterioration rate reflects the fact that the engine’s zero-hour emission rates change as the equipment is used, due to wear of various engine parts or reduced efficiency of emission control devices. The cumulative hours reflect the CHE engine’s total operating hours. 17 The emission factor is calculated as follows

where ZH = zero-hour emission rate by fuel type by CHE engine type for a given power category and model year, g/(kW h); DR = deterioration rate (rate of change of emissions as a function of CHE engine age), g/(kW h2); and CH = cumulative hours, number of hours the CHE engine has been in use and calculated as annual operating hours times age of the CHE engine, hour.
CH was obtained by the equipment list, and ZH and DR of single equipment obtained from Starcrest Consulting Group 17 according to equipment engine energy type (LNG, diesel, etc.), production type, and the category of rated power, which were obtained by the survey.
CHE emission factors based on activity need a large number of measured data, and it can only be obtained by statistical analysis method. In China, there is no basis for such research at present. Therefore, a revised and localized calculation method referring to OFFROAD model was put forward in this article on the basis of comprehensive analysis of literatures and taking various CHE activity information into consideration.
CHE emission reduction technologies and control factors
Emissions are revised according to the energy-saving and emission reduction measures implemented in ports in China, such as the technologies “converting diesel to LNG” or “converting diesel to electricity.” As such, CHE at ports are classified by their source of power and control factors are specified accordingly. Control factors are used to reflect the changes in emissions due to the use of various technologies mentioned above. The emission reduction percentages associated with the various emission reduction strategies can be verified by the actual situation in the port, subtracting which from 1.0 is the control factor. For example, a technology that achieves an emission reduction of 70%, or 0.70, will have a control factor of 0.3 (1.0 − 0.7 = 0.3). In this article, for the hybrid (diesel and electricity) equipment, the emission reduction measures will be revised by the actual operating time of diesel fuel.
Case analysis
Research object and scope
The NLCP is along Yangtze River downstream, located in Longtan district, about 30 km from the city of Nanjing. Typical operating equipment in the port includes bridge cranes, RTG cranes, reach stackers, empty container handlers, container trailers, and forklifts. Among them, bridge cranes are used for the loading and unloading operations of vessels, container trailers are used for container horizontal movements from the wharf apron to the yard, RTGs and reach stackers are used for handling and stacking container in the yard, and container handlers are suitable for empty container handling. Geographical location and typical CHE of the NLCP are shown in Figure 1.

NLCP location and typical CHE.
There are 94 equipment in NLCP, including 22 RTG cranes, 6 reach stackers, 14 container handlers, 30 container trailers, and 22 forklifts (due to the emission reduction measures of diesel to gas, emissions of the bridge crane are zero and not included in the emission inventory). We choose the container trailers as an example, as shown in Table 1.
Equipment information list of NLCP (container trailers as an example).

NLCP: Nanjing Longtan Container Port; LNG: liquefied natural gas.
Handling technology
The operation flow at the NLCP is summarized as follows: when the container ship is at the berth, containers are grabbed by the bridge crane from the ship and they are put onto the waiting container trailers, which will transport the containers to the rear yard, and ultimately the containers will be stacked to the specified location by the RTGs or reach stackers as an auxiliary. For the container to be transported out of the port gate, it will be hoisted and loaded to the container truck by the RTGs or reach stackers as an auxiliary. And the truck carries the container to each destination. The order to unload containers from the port and load them into the ship is the opposite. This operation flow is shown in Figure 2.

Containers handling process at NLCP.
Parameter selection
The rated power of equipment is obtained by field investigation. Multiply engine load factors of different types of machinery on the basis of rated power. Table 2 lists the load factors for specified CHE, including reach stacker, forklift, container trailer, empty container handler, the bridge crane, and RTG crane.
Cargo handling equipment engine load factors. 17
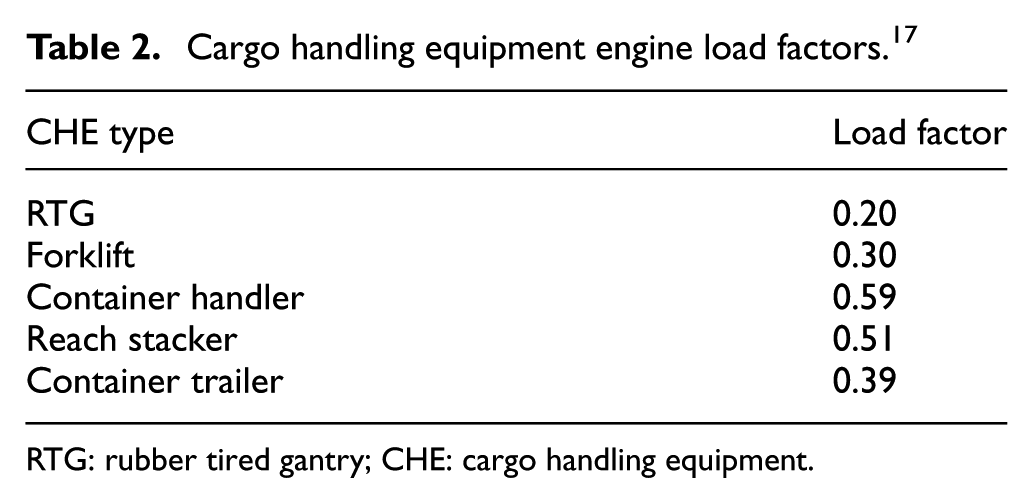
RTG: rubber tired gantry; CHE: cargo handling equipment.
FCF reflect the influence of changes in diesel products on the pollutant emission ratio of different year types of equipment engine. It was found in the investigation that CHE of the NLCP used Chinese No. 0 diesel with maximum sulfur content of 350 ppm. According to the ultra-low sulfur diesel FCF in the literature, 17 localization correction has been made by linear interpolation (for the diesel with a sulfur content of 350 ppm), thereby obtaining the FCF for the equipment model year we need. We use FCF revised by CARB. The engine energy for LNG equipment was not taken into account. 17 They are shown in Table 3.
Fuel correction factors.

The production year of typical equipment’s engine was between 1996 and 2014. The zero-hour emission and deterioration rates were obtained by combining the equipment’s information with CARB’s latest emission calculation methodology for CHE. 17 Emission factors were estimated. Table 4 gives the result on container trailers as an example.
2014 NLCP CHE emission factors (container trailers as an example).

NLCP: Nanjing Longtan Container Port; CHE: cargo handling equipment.
Some of the pollutant emission factors are reduced to zero when liquefied natural gas is used by the equipment engine.
Results and discussion
2014 NLCP CHE emission inventory by equipment type
2014 NLCP CHE emissions by equipment type were calculated according to the foregoing method in this article and presented in Table 5.
2014 NLCP CHE emission inventory by equipment type (tons).

NLCP: Nanjing Longtan Container Port; CHE: cargo handling equipment; RTG: rubber tired gantry.
2014 NLCP CHE CO2 emissions by equipment type (tons).
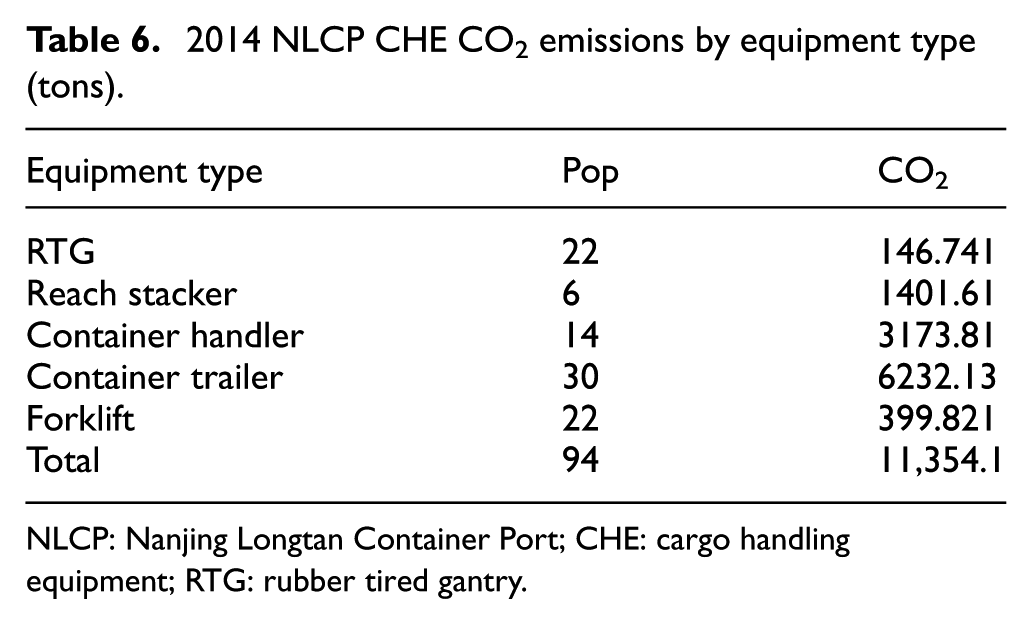
NLCP: Nanjing Longtan Container Port; CHE: cargo handling equipment; RTG: rubber tired gantry.
Results show that 2014 NLCP CHE totally emitted PM10 4.25 t, PM2.5 3.91 t, NOx 82.98 t, SOx 1.06 t, CO2 3.84 t, and HC 16.39 t, among which NOx contributed the highest percentage of air pollutant (60.60%). CO was the second highest percentage, 17.41% (Table 5).
Figure 3 presents the percentage of CHE emissions by equipment type. Container trailers’ contribution rate of total CHE PM10, PM2.5, NOx, SOx, CO, and HC emissions are, respectively, 36.9%, 36.9%, 48.7%, 51.4%, 40.4%, and 55.8%, accounting for most of the emissions. Container handlers and reach stackers account for most of the remainder of the emissions.

Emission shares of CHE of criteria pollutants (%).
Figure 4 presents the percentage of CHE emissions by pollutant type. Among the pollutant emissions of every CHE, NOx shows the greatest contribution. It contributes 46.67% of total forklift pollutant emissions, 62.8% of total container trailer pollutant emissions, 62.26% of total container handler pollutant emissions, 56.71% of total reach stacker pollutant emissions, and 50.33% of total RTG pollutant emissions. CO and CH take the second place. Particulate matter emissions are smaller than other air pollutants emitted by CHE.

Emission shares of criteria pollutants of CHE (%).
In the literature, 19 four port-related mobile source categories of NLCP were analyzed, as shown in Figure 5. CHE is the main contribution source of HC, PM, and CO in the port, which contributes 59% of total HC emissions, 51.86% of total PM10 emissions, 55% of total PM2.5 emissions, and 41.29% of total CO emissions. CHE is the main emission source of particulate matter and carbon emissions.

Emission shares of four port-related mobile source categories of criteria pollutants at NLCP (%).
Figure 6 presents CO2 emissions. Container trailers are the main contribution source of CHE, and container handlers come second.

CO2 emissions of CHE in NLCP.
Comparative analysis of related researches
According to the analysis of the previous research results of this article, 2013 NLCP CHE air pollutant emissions from the literature 16 using the fuel consumption method were as follows: NOx 230.0 t, CO 190.05 t, PM10 28.80 t, and SOx 17.40 t, which can be seen higher than the result of this article. An important factor is the technical schemes for the energy-saving in rubber tired type of container gantry cranes (RTG) and other cranes in recent years. Engine types of the bridge crane were entirely changed from diesel into electricity, as well as a few power of RTG cranes were changed from diesel into electricity. Diesel-electric hybrid-driven technology which combines a diesel engine and an electric motor together has been used in most RTG and received significant breakthrough in emission reduction, in which the CO and NOx emissions were reduced to about 68%. And emissions of particulate matter, sulfur oxide, and so on also largely decreased. In addition, the proportion of container trailer emissions was also more significant, especially reflected in the completed emission reduction innovation (100% RTGs adapt E-RTG conversion methods, consisting of the bus bar, touch wire, and cable reel systems; 40% container trailers adapt “converting diesel to gas” method) of this article. Overall, it is of great effectiveness to use clean energy to control the pollutant emissions and to further improve the using proportion of clean energy is a major task of port energy conservation and emission reduction. Compared with the literature of X Jia et al. 16 which adopted fuel consumption method, equipment engine types using LNG and diesel-electric hybrid-driven technology were not taken into consideration when calculating, and fuel emission factor value used in calculation was an average level. The accuracy of the calculation results was somewhat short. However, quantitative analysis could be made on the single type of equipment and qualitative analysis could be made on the whole.
Improvement measures suggestions
In order to reduce pollutant emissions, the container trailer “diesel to gas” or crane “diesel to electricity” process should be promoted as soon as possible. Compared with RTG, the rail-mounted container gantry crane (RMG) in yard has the superiority and market prospect than rubber tired one in yard occupying rate, operation cost, working efficiency, safety, and environment protection. 20 RMG should be given priority in yard operation of RTG. Magnetizer with controllable magnetic strength could be adopted to make magnetization treatment, and by taking advantage of excellent performance of the lubricating diesel to reduce friction, component life will increase, fuel consumption of engine will decrease, and pollutant emissions will decrease too. Accelerate the implementation of the engine “to optimize the fuel + SCR (selective catalytic reduction) technology roadmap” and control the emission of PM and NOx. 21
Conclusion and prospects
In this article, bottom-up method based on activity has been chosen as emission estimation methodology, 2014 NLCP CHE emission inventory has been established, and emission of all pollutants and their emission characteristics have been analyzed.
Calculation results show that 2014 NLCP CHE totally emitted PM10 4.25 t, PM2.5 3.91 t, NOx 82.98 t, SOx 1.06 t, CO23.84 t, and HC 16.39 t, among which NOx contributed the highest percentage of air pollutant (60.60%). CO contributed the second highest percentage, 17.41%. Container trailers were the largest contribution source of CHE. CHE (41.29%) and vessels (35.72%) accounted for the majority of CO emissions. And CHE accounted for the majority of PM emissions (PM10 51.86%, PM2.5 55%).
Present situation analysis. As China has not yet established a system of equipment emission factor preparation method, and has still lacked a large number of measured activity data of CHE, studies on the establishment of emission inventory on CHE and the whole port-related mobile source categories have still referred to mature research from other countries. A refined set of emission inventory system has not been formed in China. Based on the domestic and foreign literature statistics, this article constructs the corresponding emission factors and parameter correction factors based on the parameter information and activity information obtained from the port survey, so as to find the maximum matching model of the equipment. In addition, the FCF is based on domestic and foreign literature survey, integrated after the conversion is applicable to the current stage of non-road mobile source emission limit specification factor, not a separate consideration of specific equipment’s sulfur content of diesel, but access to the average conversion, there is uncertainty.
In the case of permission, further monitoring investigations are needed to obtain reliable emission factor basis data to provide a basis for the correction of localized emission factors.
Footnotes
Academic Editor: Yongjun Shen
Declaration of conflicting interests
The author(s) declared no potential conflicts of interest with respect to the research, authorship, and/or publication of this article.
Funding
The author(s) disclosed receipt of the following financial support for the research, authorship, and/or publication of this article: Research for this paper was funded by the Natural Science Foundation of China (NSFC; Nos 41401120, 51009060, and 50909042) and Social Science Foundation of Jiangsu province (No. 14JD014).