
Abstract
Face the energy recovery and environmental concerns and policy, the plastic molds design and develop have to focus on the issues of the lead-free, non-toxic, recyclable, re-manufactured, and integrate environmental protection and technology etc. Hence, this study adopts the product service system to integrate product and service to meet consumer demands. Furthermore, this system concept combines the procedures of design, manufacture, and distribution. This procedure of service supply will improve product life cycle for reduced environmental impact, satisfy the concepts of the reuse and remanufacturing of raw materials, reduce production waste, and further achieve the purpose of dematerialization. The purpose of this research is to construct the impact factors of the sustainable design and development of plastic molds on product service. This study integrates expert interviews and the literature review to list the principles of the sustainable design and development of plastic molds; the results of this study sum up 6 capital dimensions and 30 evaluation indicators, which are analyzed through the analytical hierarchy process, and add the plastic mold application process to provide complete products and services that improve the sustainable design, development process, and evaluation criteria of plastic molds.
Keywords
Introduction
Plastics, which transform everyday life and make life more convenient, have been a part of daily life for a century. Almost all aspects of daily life involve plastics; however, such daily necessities present modern economic and social problems, meaning the excessive overuse of natural resources, which lead to the situations of energy shortage, environmental pollution, and global warming. Governments must gradually address these problems through energy and environmental actions and policies such as waste electrical and electronic equipment regulation (WEEE), restriction of hazardous substances directive (RoHS), extra low voltage (ELV), and Enterprise Unified Process (EuP), 1 which show that environmental protection and sustainable ecology development are valued internationally. In Taiwan, the Export Trade is the main business; however, due to the Asian financial crisis, international oil and steel prices have risen, which led the economy into a slump.
According to the analysis of the Metal Industries Research & Development Centre, mold products and production and marketing are highly related industries. Recently, the export orders for electronics and information communication products were substantially reduced in 2016, electronics export orders declined by 26%, information and communications technology (ICT) products declined by 20.2%, and machinery products declined by 49.4%; 2 thus, plastic products and molds influence the industry. In view of this, the mold industry requires accelerated transformation to enhance the added value of mold products and satisfy consumers, international regulations, fashionable product designs, and the environment. Thus, how to follow fashion trend changes should be valued to solve the problem between the developments of the industry and the environment in an economic and coexistence manner, in order to facilitate industry developments in the future.
In recent years, the development of internationally advanced countries has comprehensively transformed the traditional business model to a service-oriented model, which has increased interactions between consumers and corporations to develop products that fit consumer’s requirements. 3 Moreover, when the environment is considered and integrated into product design and development, it would improve sustainable development and product life cycle for each stage. 4
Enhanced environmental awareness results in the beginning of an era of a green economy, where global emphasis is placed on sustainable development; thus, the development of plastic products should focus on being lighter, with no lead or poison, and can be recycled and reproduced, which represents the combination of environmental protection design and technology. The issues of energy and environment are important, which makes it more difficult for the plastic mold industry to develop. Nevertheless, the concept of a product service system (PSS) is a new concept based on environmental protection and economic orientation, which combines products with services to meet consumption demands, in order to reach the goal of product dematerialization. At the same time, this concept uses a PSS to integrate design, manufacture, and marketing, with the aim of reducing the product’s impact on the environment during its life cycle, repeatedly using and reproducing products, raw materials, or components, improving the usage effectiveness of resources, and reducing the production of waste. In this way, the objective of dematerialization can be reached.5,6
Therefore, this study takes the PSS as the starting point, applies its theory to plastic molding, and studies and explores it at the level of environmental consideration and product development, by considering the principles and strategy of sustainability in order to understand the demands and elements of a sustainable plastic mold industry (Figure 1). Thus, analysis will focus on the development procedures of plastic molds, the principle of green design, and other relevant strategies, with the expectation of enhancing market competitiveness by providing competitive advantage methods. This study emphasizes the concept of dematerialization through a PSS and studies the development and application procedures of plastic molding to develop a development mode that meets the demand for the sustainable development of plastic molds.7,8 It is intended that designers could thoroughly consider the conditions of different phases of the life cycle of molds during the initial design stage and effectively integrate relevant processes during the development process of plastic products, in order that companies can provide more innovative products, and thus, obtain more benefits.

Study relationship.
Materials and methods
Research framework
Through the literature review, we can clarify our understanding of the analysis applications of PSSs, the sustainable development model, and plastic mold design; through in-depth interviews with experts, this study obtains the correlation factors between the PSS, sustainable design, and the plastic mold development model, as the basis for plastic mold sustainable design. This study conducts concurrent assessments through the analytical hierarchy process (AHP) method to obtain the overall impact factors of the reordering and mold development process, in order to develop a plastic mold design and construct the models. The framework of this study is described in Figure 2.

Research framework.
Participants
This study invites plastic mold experts to compare the different product development stages of product design and plastic mold design and collects their advice and comments regarding sustainable design and development (Table 1).
The experts’ backgrounds.

Research tool
The questionnaires of the semi-structural interviews in this study investigate content, including product servitization, the strategies of sustainable design and development, and the factors of plastic mold life cycle. The main research is divided into two stages: (a) the sustainable design of product servitization and (b) the green design principles and related strategy of plastic mold design.
In order to probe into current plastic mold and sustainable design and development, this study adopts in-depth interviews through face-to-face communication regarding the subjects’ knowledge and competences required for work, duties, and conditions and extensively collects the required data. This study interviews experts in the field and invites them to provide suggestions to generalize the evaluation indices of plastic mold design and the development factors in a PSS and then modifies the research direction to establish questionnaire content.
Results and discussion
Key factors and weight factors of PSS mold sustainable design and development
Through the literature review and expert questionnaire interviews, the AHP of plastic mold sustainable design and development in a PSS is constructed, as follows:
Connection between the PSS and the sustainable design strategy; the extracted service factors are (a) green supply chain management, (b) evaluation of the phases from product life cycle to service, (c) product design service and concern for total recycling and remanufacturing, (d) environmental laws, and (e) maintenance service and increased product life. These factors are associated with the operation of plastic mold sustainable design and development in a PSS; thus, this study treats them as the highest level.
Regarding the connection between the plastic mold production cycle and sustainable design and development, experts suggest that in the development of plastic products, integrating environmental concerns in the phases of production will allow us to recognize possible environmental issues, and the impact of overall product life cycle on the environment. According to the literature review, the production cycle of plastic mold development includes five phases: “material selection,”“design integration,”“manufacturing process,”“quality control,” and “recycling and reuse.” This study treats these as the second highest goal level.
This study calculates the characteristics of the previous levels of Expert Choice 2000 of AHP in order to construct evaluation factors for decision-making and then compares the evaluation levels and factors to measure the importance of the evaluation factors of plastic mold sustainable design and development in a PSS. The connection between the AHP of the evaluation and the criteria is shown in Figure 3.

The AHP construct of plastic mold sustainable design and development in products service system.
Analytical results of key factors and weight factors
The AHP was developed by Professor TL Saaty 9 from the University of Pittsburgh in 1971, which was mainly applied to decision-making issues under uncertain conditions with many assessment principles. The objective of AHP is to systemize complicated issues by breaking them down into different levels, judging them through quantification, determining their logic, and comprehensively assessing them in order to provide sufficient information for decision-makers to choose an appropriate proposal, while reducing the risk of wrong decisions.10,11 Hence, this study utilizes AHP for decision-making. The procedures and relevant steps of AHP can be classified into the following eight steps.
Identify the issue of decision-making
The issue to be decided should be identified before a definition is given to it, which is helpful to gain a clear understanding of the purpose of the decision. Especially, when applying AHP to determine the hierarchy of assessment elements, the direction of the issue should be fully understood.
List all assessment elements
When listing all assessment elements, the opinions of experts and decision-makers should be gathered first (list all assessment elements with caution) and then consider all opinions of the assessment elements, as based on expertise and practical experience. The order and relationships of decision-making factors are not required; thus, group brainstorming or the Delphi method can be used to gather the opinions of experts and decision-makers.
Establish hierarchy
The hierarchy of all assessment elements is determined in accordance with their relations with each other and their independence. While the number of layers depends on the complexity of the issue, at each layer, the number of elements should be not more than seven, in order to avoid contradiction when assessing them and to avoid negative effect on the assessment result. The elements of the different layers should be independent. Regarding the hierarchy structure, from the overall target to sub-targets, and to the result of decision-making, a poly-hierarchy is formed. The number of layers depends on the complexity of the decision to be made and the degree of analysis required. The classification of hierarchy involves a complete hierarchy and an incomplete hierarchy. In a complete hierarchy, the elements of different layers are connected with each other, while an analytical hierarchy structure, such as education equality, is a complete hierarchy. In an incomplete hierarchy, the elements of different layers are not necessarily connected with each other. The structure of a hierarchy is established by repeatedly revising and summarizing the opinions from group discussions, relevant literature, and relevant experts. The principles for establishing the hierarchy structure can be summarized as follows:
The first layer is the target of decision-making or evaluation.
Elements with similar importance should be placed in the same layer.
The number of elements in the same layer should not be too numerous, and the elements should be independent.
The bottom layer is the action plan of decision-making or the evaluation target.
Pairwise comparison assessment
After the establishment of the hierarchy structure, the relative importance of different assessment elements in the same layer is assessed in accordance with the outcomes of the questionnaires or assessment results of experts. The AHP evaluation method takes the elements at the last layer as the basis and compares the importance or influence of two randomly chosen elements in the same layer on the elements at the last layer. This procedure helps decision-makers reduce their thinking burdens and demonstrate the relativeness of the decision factors in a clearer manner.
In pairwise comparison, in general, opinions from scholars and experts are gathered and repeatedly discussed to reach consensus; if there are different opinions and consensus cannot be reached, the geometric mean method is used to conclude a result. This study uses questionnaires to obtain experts’ opinions and concludes a result using the geometric mean method.
Create a pairwise comparison matrix
To create a pairwise comparison matrix, the assessment elements in each layer are regarded as the basis, and pairwise comparison is conducted between them and the assessment elements in the next layer. In this way, the assessment values of pairwise comparison are formed. Where C (n, 2) = n (n − 1)/2 are assessment values, that are the element values in the upper right of the main diagonal as represented in the pairwise comparison matrix (Table 2). Insert the reciprocals of the element values, which are in the upper right in the lower left of the main diagonal, and set the element values on the main diagonal as one, in order to complete pairwise comparison matrix A.
Pairwise comparison matrix. 12

aij = wi/wj. Here, w1, w2,…, wn represent the relative weights of the elements in a layer to an element in the last layer. The following two characteristics can be seen in the matrix:
The pairwise comparison matrix of AHP is a positive transpose matrix.
If all experts’ judgments are very perfect and precise, the matrix is a consistency matrix. In other words, all comparison values meet the mathematics transitive law.
Calculate the priority vectors and maximized eigenvalues of all comparison matrixes
Since A is a positive reciprocal matrix, AW = nW, A = [aij]n × n, W = (w1,…, wn)T. In accordance with the matrix theory, w is an eigenvector of consistency matrix A; while in AHP, it is called a priority vector, which represents the relative weights of all elements, and its eigenvalue is n. If the pairwise comparison matrix is a consistency matrix, and ajj = l, there will be only one eigenvalue n, while the remaining eigenvalues are zero; thus, the maximum eigenvalue is n. During the subjective comparison process, there will be few errors. Although the eigenvalue will undergo the minimum change accordingly, providing aij = l and matrix A is a consistency matrix, its maximized eigenvalue will remain close to n. Regarding how many errors are allowed before it will affect the accuracy of the result, the consistency index (CI) and consistency ratio (CR) should be used for verification. The eigenvector of maximized eigenvalue W (i.e. the priority vector in AHP) can be computed by standardizing the limit matrix of matrix A’s K power and adding the horizontal line. Since the calculation process is difficult, accurate results can be calculated by a computer. The accurate maximized eigenvalue λmax can also be calculated by a computer. However, if the requirement of accuracy is not high, its approximate value can be calculated through the following manner.
First, calculate W′ through W′ = AW (w′ is the result of the standardization of w). Second, divide every element of W′ by its corresponding element of W. Finally, compute the arithmetic mean of the value, which was obtained in step 2, and the approximate λmax can be obtained.
Calculate CI and CR
When conducting pairwise assessment comparison, experts may not reach an agreement during their assessment if the indices affect analysis accuracy. Therefore, the magnitude of the error must be checked to determine whether it is within the tolerable margin of error, in order to avoid affecting the priority results of decision-making. Saaty transformed the difference between the maximized eigenvalue λmax and n into a CI to assess the level of consistency, which works as the reference regarding whether or not to accept this comparison matrix. Its mathematic formation is CI = (λmax)/(n − 1).
Calculate the total priority vector of the entire hierarchy
If the consistency of the entire hierarchy is acceptable, in the final AHP step, the relative weights of the elements in each layer should be integrated to compute the total priority vector for the entire hierarchy. The computed vector represents all priority decision-making proposals relative to the decision-making target.
Through the obtained questionnaires, this study acquires the pairwise comparison matrix of green materials in energy saving by one key factor in the analysis of Expert Choice 2000. Through Excel, this study calculates the standardized values in order to obtain priority vectors. Maximum eigenvalue λmax is following the formula for the priority vector and maximum eigenvalue of the comparison matrix


Calculation of the maximum eigenvalue

In pairwise comparison, when experts lack consistent evaluation indices, it might influence the precision of analysis. Therefore, this study determines whether the errors are acceptable in order to avoid an impact on rankings for decision-making. Saaty transformed the difference between maximum eigenvalue λmax and n into a CI to measure the degree of consistency for the acceptance of the comparison matrix

λmax is the maximum eigenvalue and n is the number of the hierarchical factor.
In addition, the CI of the random positive reciprocal matrix is called random index (RI); Saaty obtained the corresponding RIs of the number of orders (Table 3), as well as the RI of the n-order positive reciprocal matrix.
Random index of n-order positive reciprocal matrix. 9

RI: random index.
According to the previous CI and RI, we can acquire the CR of the comparison matrix, CR = CI/RI. Saaty suggested that CR ≤ 0.1 is reasonable, an acceptable error, and consistency of the matrix is satisfied. If it is beyond the level, Saaty suggested re-modifying the evaluation to improve the CR. The following is the result of 19 valid questionnaires after software calculation. By calculation of Expert Choice, and upon plastic mold sustainable design and development in a PSS, as well as analysis of the ultimate goal (Level I), this study obtains a pairwise comparison matrix (Table 4).
Pairwise comparison matrix of PSS plastic mold sustainable design and development.

Regarding the values obtained in Table 4, this study calculates the standardized values through Microsoft Excel to acquire priority vector W′, as shown in Table 5, where the mean is acquired by the horizontal sum.
Priority vector W of PSS plastic mold sustainable design and development.
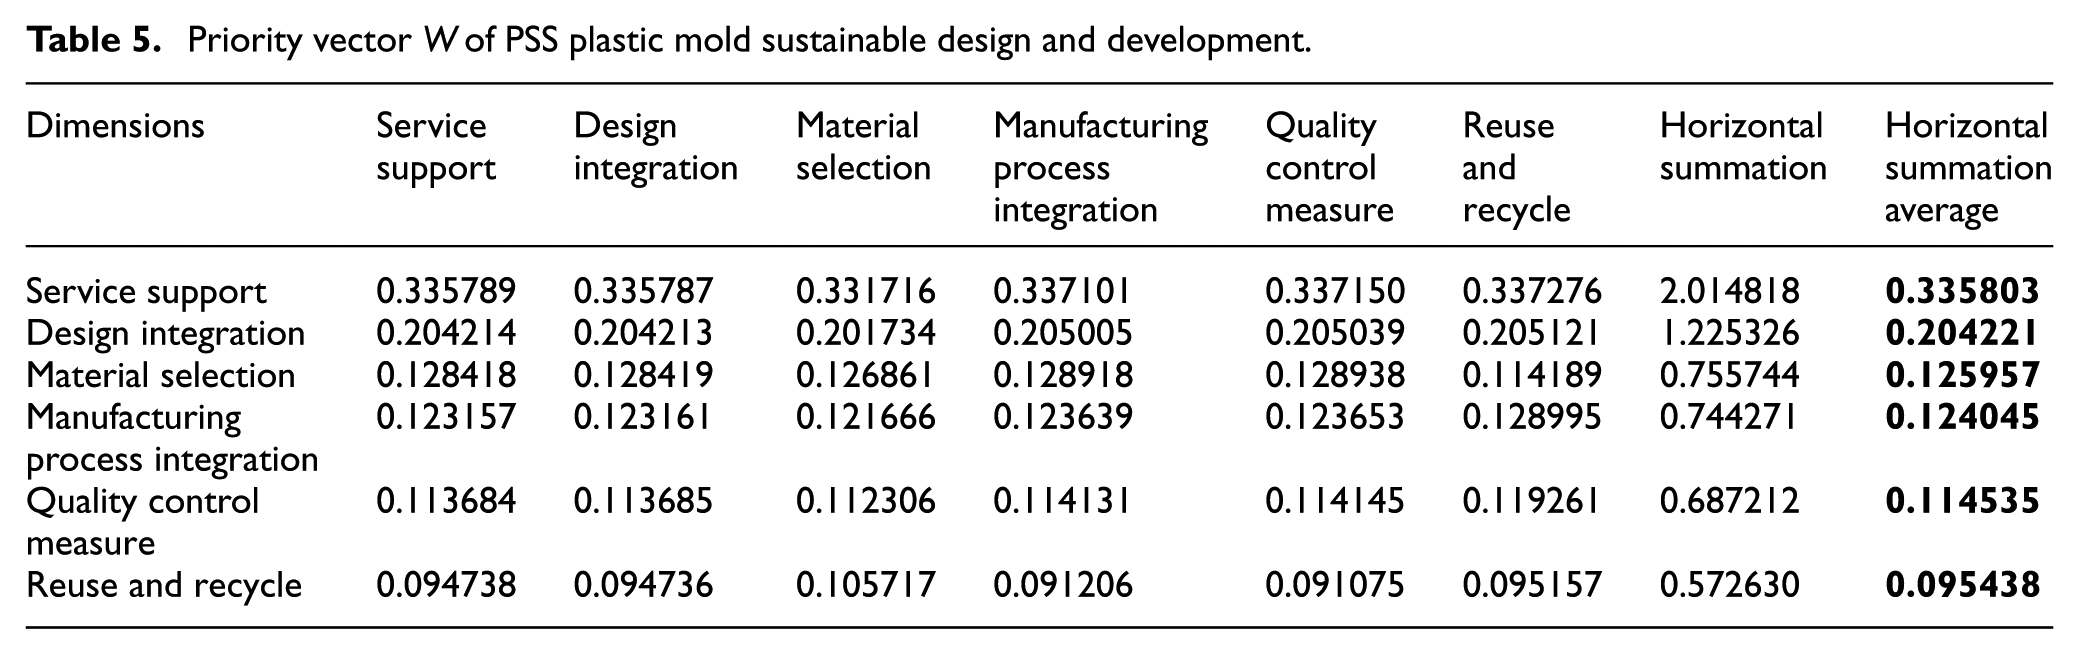
According to the figures obtained in Table 4, this study calculates the standardized figures through Excel. Upon plastic mold sustainable design and development in the PSS of Table 5 and priority vector W′, we acquire the horizontal sums and means, and thus, determine the evaluation ranking of the plastic mold sustainable design and development in a PSS. This study multiplies the mean of priority vector W′ of plastic mold sustainable design and development in the PSS of Table 5 by the corresponding goal values of the pairwise comparison matrix of plastic mold sustainable design and development in the PSS of Table 4, which results in the horizontal sums and priority vector W′ of Table 6.
Priority vector W′ of PSS plastic mold sustainable design and development.
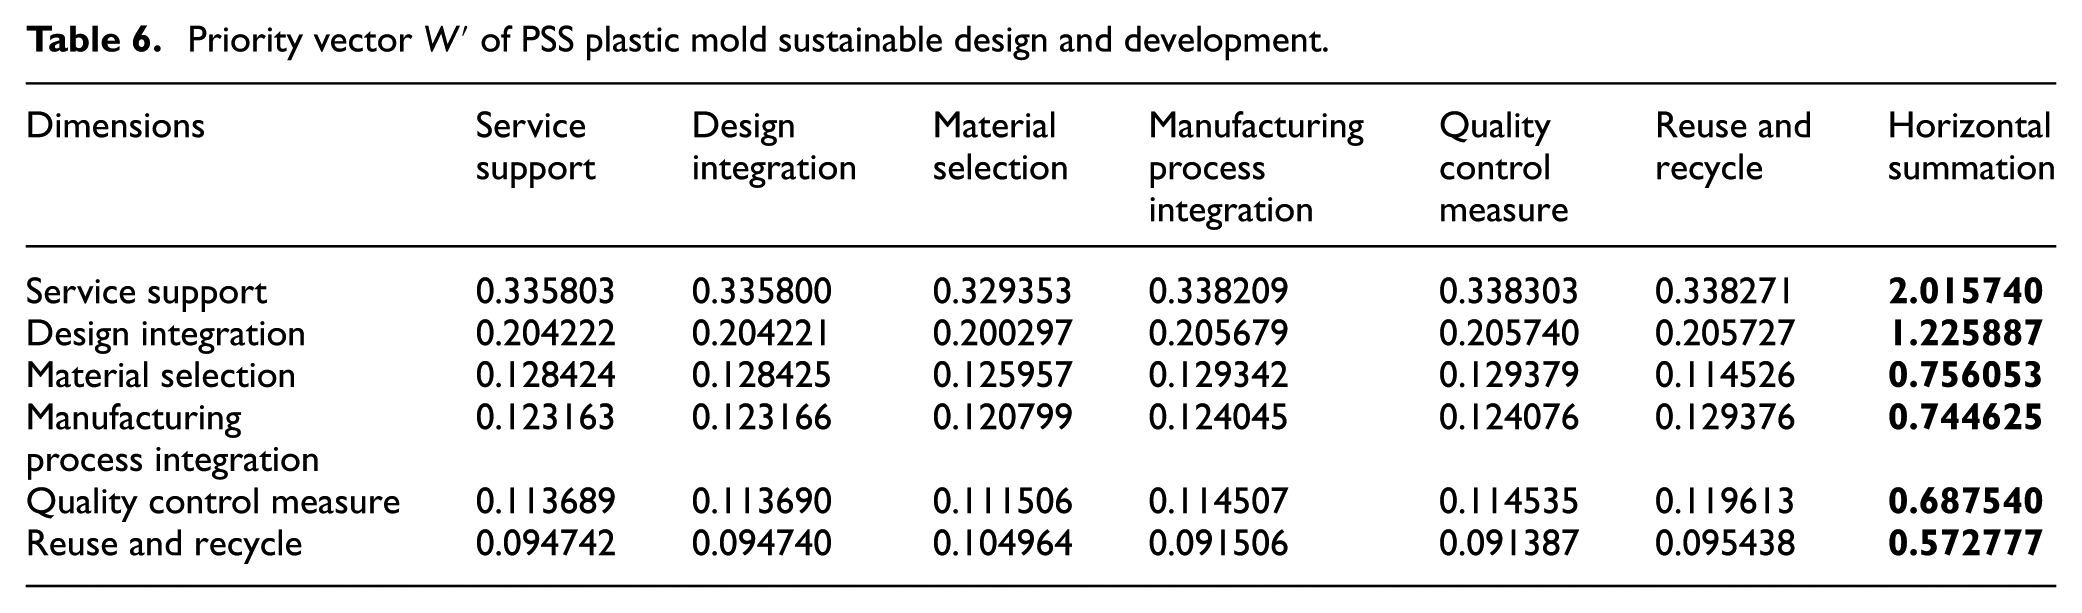
This study divides the horizontal sums of priority vector W′ of plastic mold sustainable design and development in the PSS of Table 6 by the mean of priority vector W′ of plastic mold sustainable design and development in PSS in Table 5 and obtains the maximum eigenvalue (λmax) of plastic mold sustainable design and development in the PSS of Table 7.
Maximum eigenvalue in PSS plastic mold sustainable design and development.
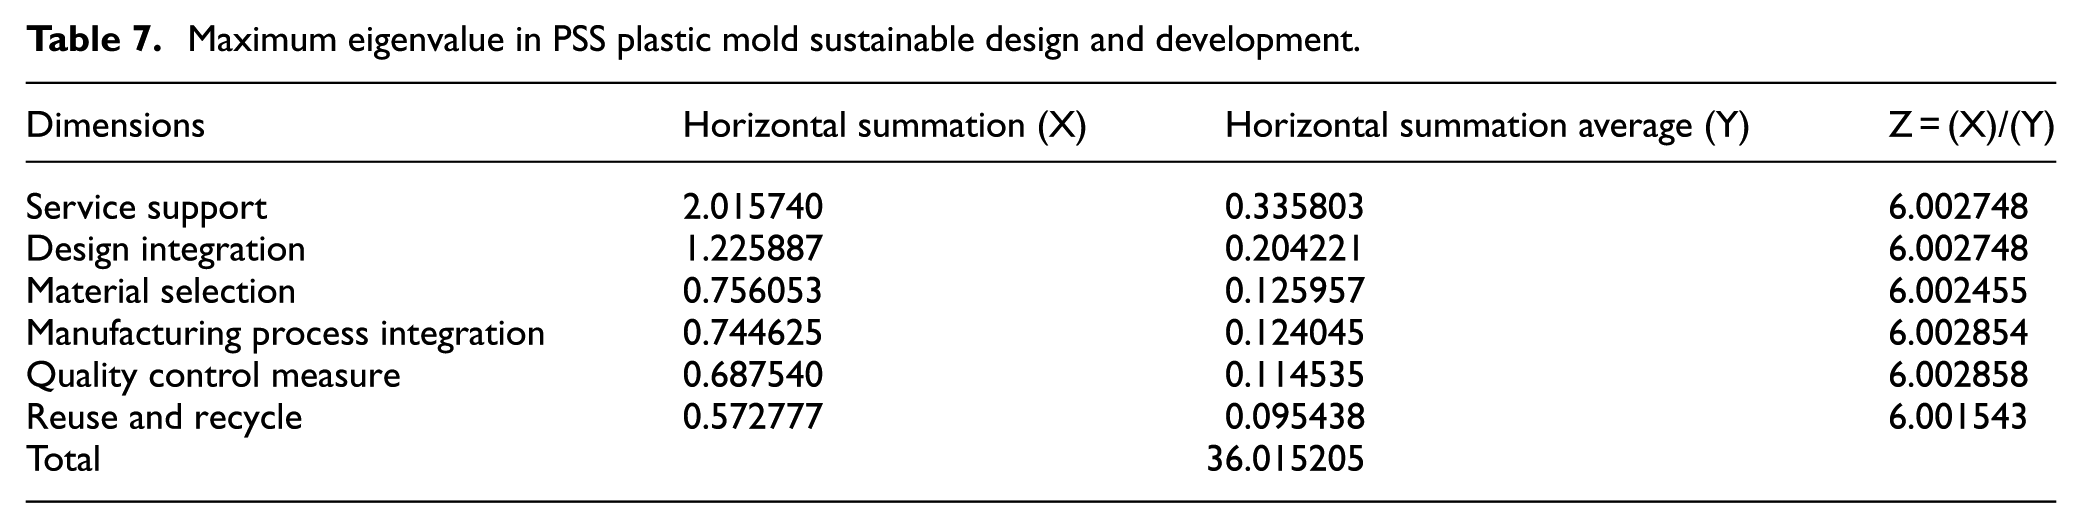
By Table 7, we acquire the maximum eigenvalues λmax = 1/6(6.002748 + 6.002748 + 6.002455 + 6.002854 + 6.002858 + 6.001543) = 6.002534. CI is CI = (λmax − n)/(n − 1) = (6.002534 − 6)/(6 − 1) = 0.000507. CR of plastic mold sustainable design and development in PSS and evaluation: when n = 6, the RIs are RI = 1.25, CR = CI/RI = 0.000507/1.25 = 0.000405. CI ≤ 0.1, CR ≤ 0.1, which meets the AHP suggestion of Saaty and satisfies matrix consistency.
Dimensions analysis of material selection
Regarding the values obtained in Table 8, this study calculates the standardized values by Microsoft Excel to acquire priority vector W′ in Table 9, where the mean is acquired by the horizontal sum.
Pairwise comparison matrix of service support.

Priority vector W of service support.
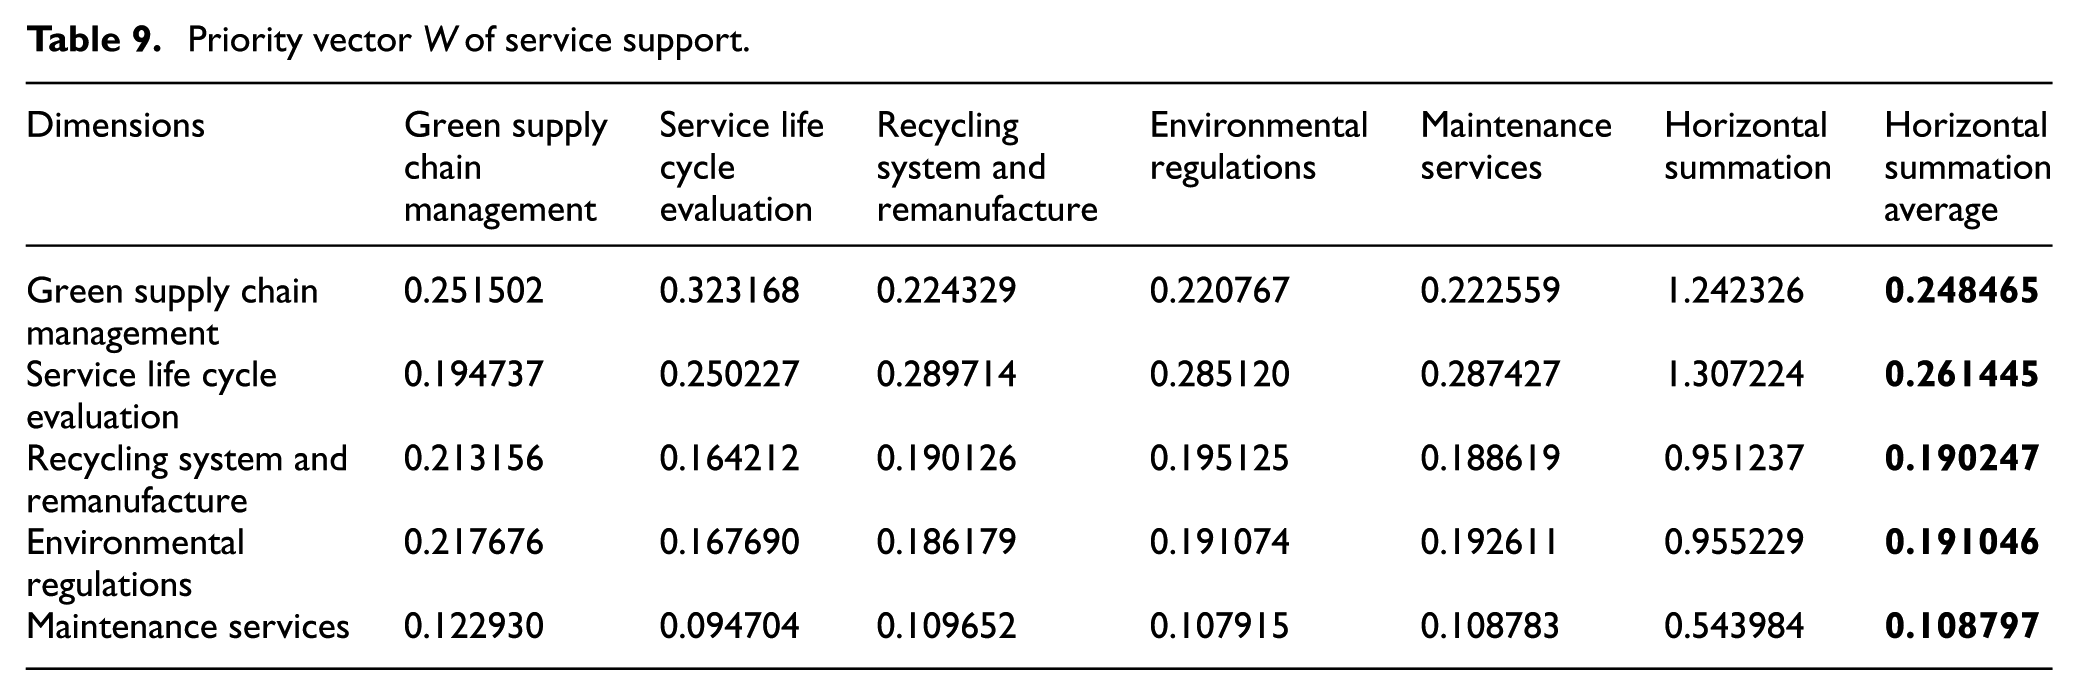
According to the figures obtained in Table 8, this study calculates the standardized figures through Excel. Upon the service support of Table 9 and priority vector W′, we acquire the horizontal sums and means, and thus, determine the ranking of the evaluation of plastic mold sustainable design and development in a PSS. This study multiplies the mean of priority vector W′ of plastic mold sustainable design and development in the PSS of Table 9 by the corresponding goal values of the pairwise comparison matrix of plastic mold sustainable design and development in the PSS of Table 8, which results in the horizontal sums and priority vector W′ of Table 10.
Priority vector W′ of service support.

This study divides the horizontal sums of priority vector W′ of service support of Table 10 by the mean of priority vector W′ of plastic mold sustainable design and development in PSS in Table 9 and obtains the maximum eigenvalue (λmax) of plastic mold sustainable design and development in the PSS of Table 11.
Maximum eigenvalue in service support.

By Table 11, we acquire the maximum eigenvalues λmax = 1/5(5.046647 + 5.034601 + 5.025780 + 5.026195 + 5.026005) = 5.031846. CI is CI = (λmax − n)/(n − 1) = 5.031846 − 5)/(5 − 1) = 0.007961. CR of plastic mold sustainable design and development in PSS and evaluation: when n = 5, the RIs are RI = 1.11, CR = CI/RI = 0.007961/1.11 = 0.007172. CI ≤ 0.1, CR ≤ 0.1, which meets the AHP suggestion of Saaty and satisfies matrix consistency.
Dimensions analysis of service support
Regarding the values obtained in Table 12, this study calculates the standardized values by Microsoft Excel to acquire priority vector W′ in Table 13, where the mean is acquired by the horizontal sum.
Pairwise comparison matrix of design integration.

Priority vector W of design integration.

According to the figures obtained in Table 12, this study calculates the standardized figures through Excel. Upon design integration of Table 13 and priority vector W′, we acquire the horizontal sums and means, and thus, determine the ranking of the evaluation of plastic mold sustainable design and development in a PSS. This study multiplies the mean of priority vector W′ of plastic mold sustainable design and development in the PSS of Table 13 by the corresponding goal values of the pairwise comparison matrix of plastic mold sustainable design and development in the PSS of Table 12, which results in the horizontal sums and priority vector W′ of Table 14.
Priority vector W′ of design integration.

This study divides the horizontal sums of priority vector W′ of design integration of Table 14 by the mean of priority vector W′ of plastic mold sustainable design and development in PSS in Table 13 and obtains the maximum eigenvalue (λmax) of plastic mold sustainable design and development in the PSS of Table 15.
Maximum eigenvalue in design integration.
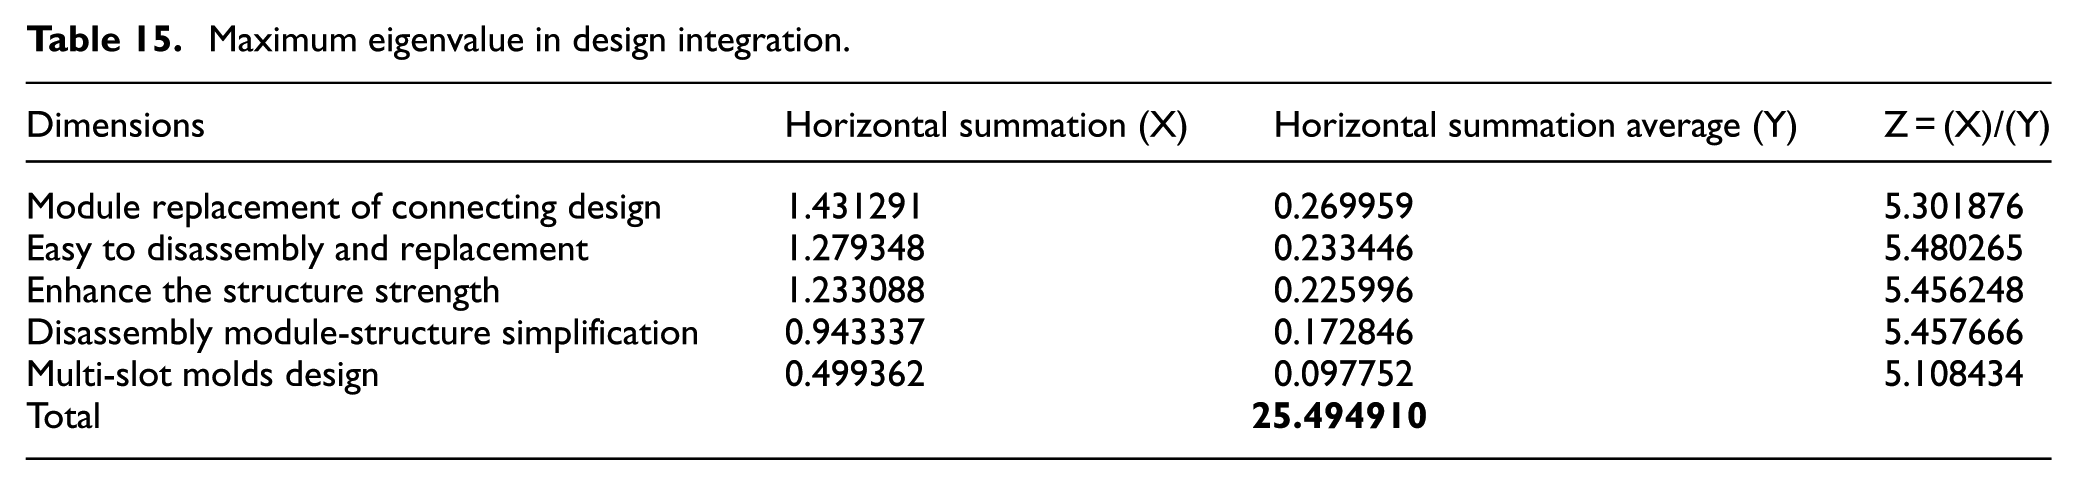
By Table 15, we acquire the maximum eigenvalues λmax = 1/5(5.301876 + 5.480265 + 5.456248 + 5.457666 + 5.108434) = 5.360898. CI is CI = (λmax − n)/(n − 1) = (5.360898 − 5)/(5 − 1) = 0.090224. CR of plastic mold sustainable design and development in PSS and evaluation: when n = 5, the RIs are RI = 1.11, CR = CI/RI = 0.090224/1.11 = 0.081283. CI ≤ 0.1, CR ≤ 0.1, which meets the AHP suggestion of Saaty and satisfies matrix consistency.
Dimensions analysis of material selection
Regarding the values obtained in Table 16, this study calculates the standardized values by Microsoft Excel to acquire priority vector W′ in Table 17, where the mean is acquired by the horizontal sum.
Pairwise comparison matrix of material selection.

Priority vector W of material selection.

According to the figures obtained in Table 16, this study calculates the standardized figures through Excel. Upon material selection of Table 17 and priority vector W′, we acquire the horizontal sums and means, and thus, determine the ranking of the evaluation of plastic mold sustainable design and development in a PSS. This study multiplies the mean of priority vector W′ of plastic mold sustainable design and development in the PSS of Table 17 by the corresponding goal values of the pairwise comparison matrix of plastic mold sustainable design and development in the PSS of Table 16, which results in the horizontal sums and priority vector W′ of Table 18.
Priority vector W′ of material selection.
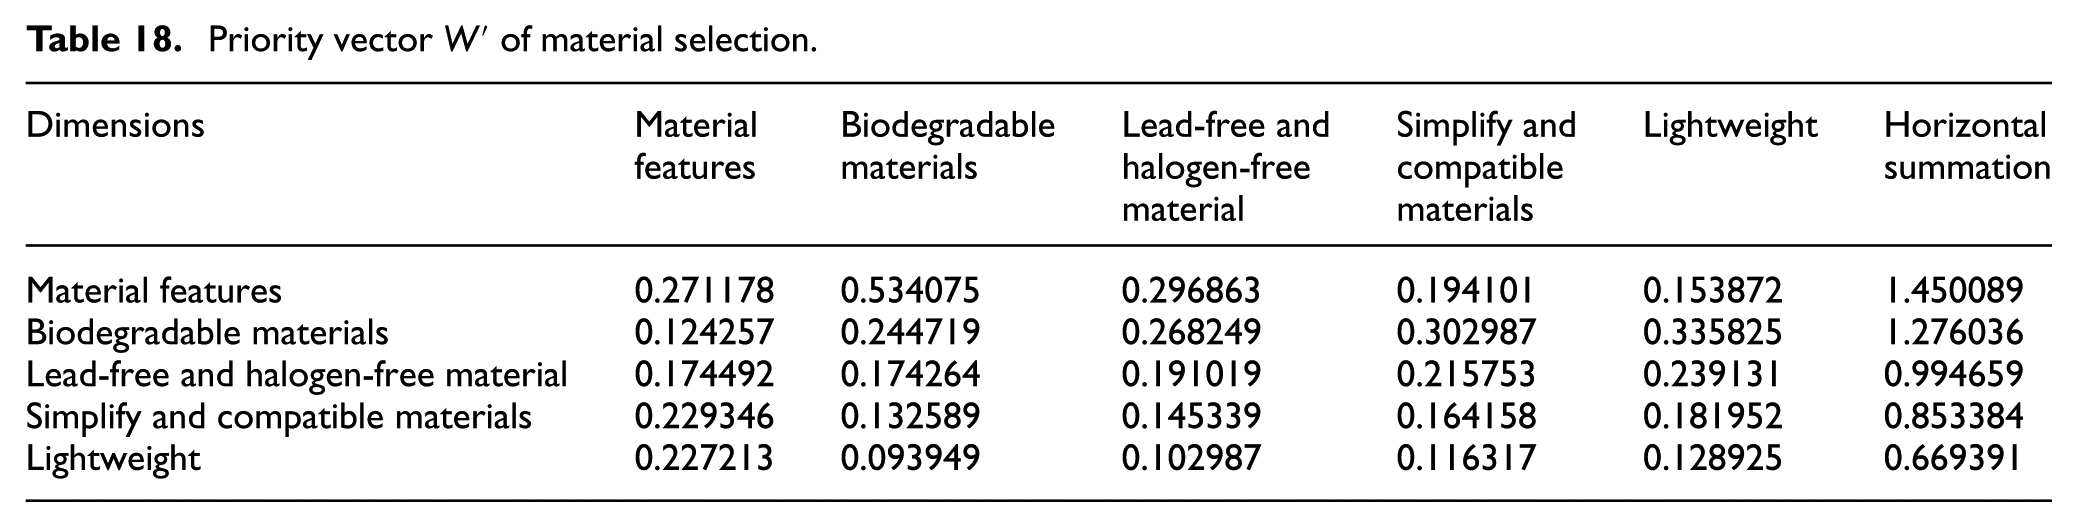
This study divides the horizontal sums of priority vector W′ of material selection of Table 18 by the mean of priority vector W′ of plastic mold sustainable design and development in PSS in Table 17 and obtains the maximum eigenvalue (λmax) of plastic mold sustainable design and development in the PSS of Table 19.
Maximum eigenvalue in material selection.

By Table 19, we acquire the maximum eigenvalues λmax = 1/5(5.347366 + 5.214291 + 5.207110 + 5.198547 + 5.192082) = 5.231879. CI is CI = (λmax − n)/(n − 1) = (5.231879 − 5)/(5 − 1) = 0.057970. CR of material selection and evaluation: when n = 5, the RIs are RI = 1.11, CR = CI/RI = 0.057970/1.11 = 0.052225. CI ≤ 0.1, CR ≤ 0.1, which meets the AHP suggestion of Saaty and satisfies matrix consistency.
Dimensions analysis of manufacturing process (Level II)
Regarding the values obtained in Table 20, this study calculates the standardized values by Microsoft Excel to acquire priority vector W′ in Table 21, where the mean is acquired by the horizontal sum.
Pairwise comparison matrix of manufacturing process.

Priority vector W of manufacturing process.
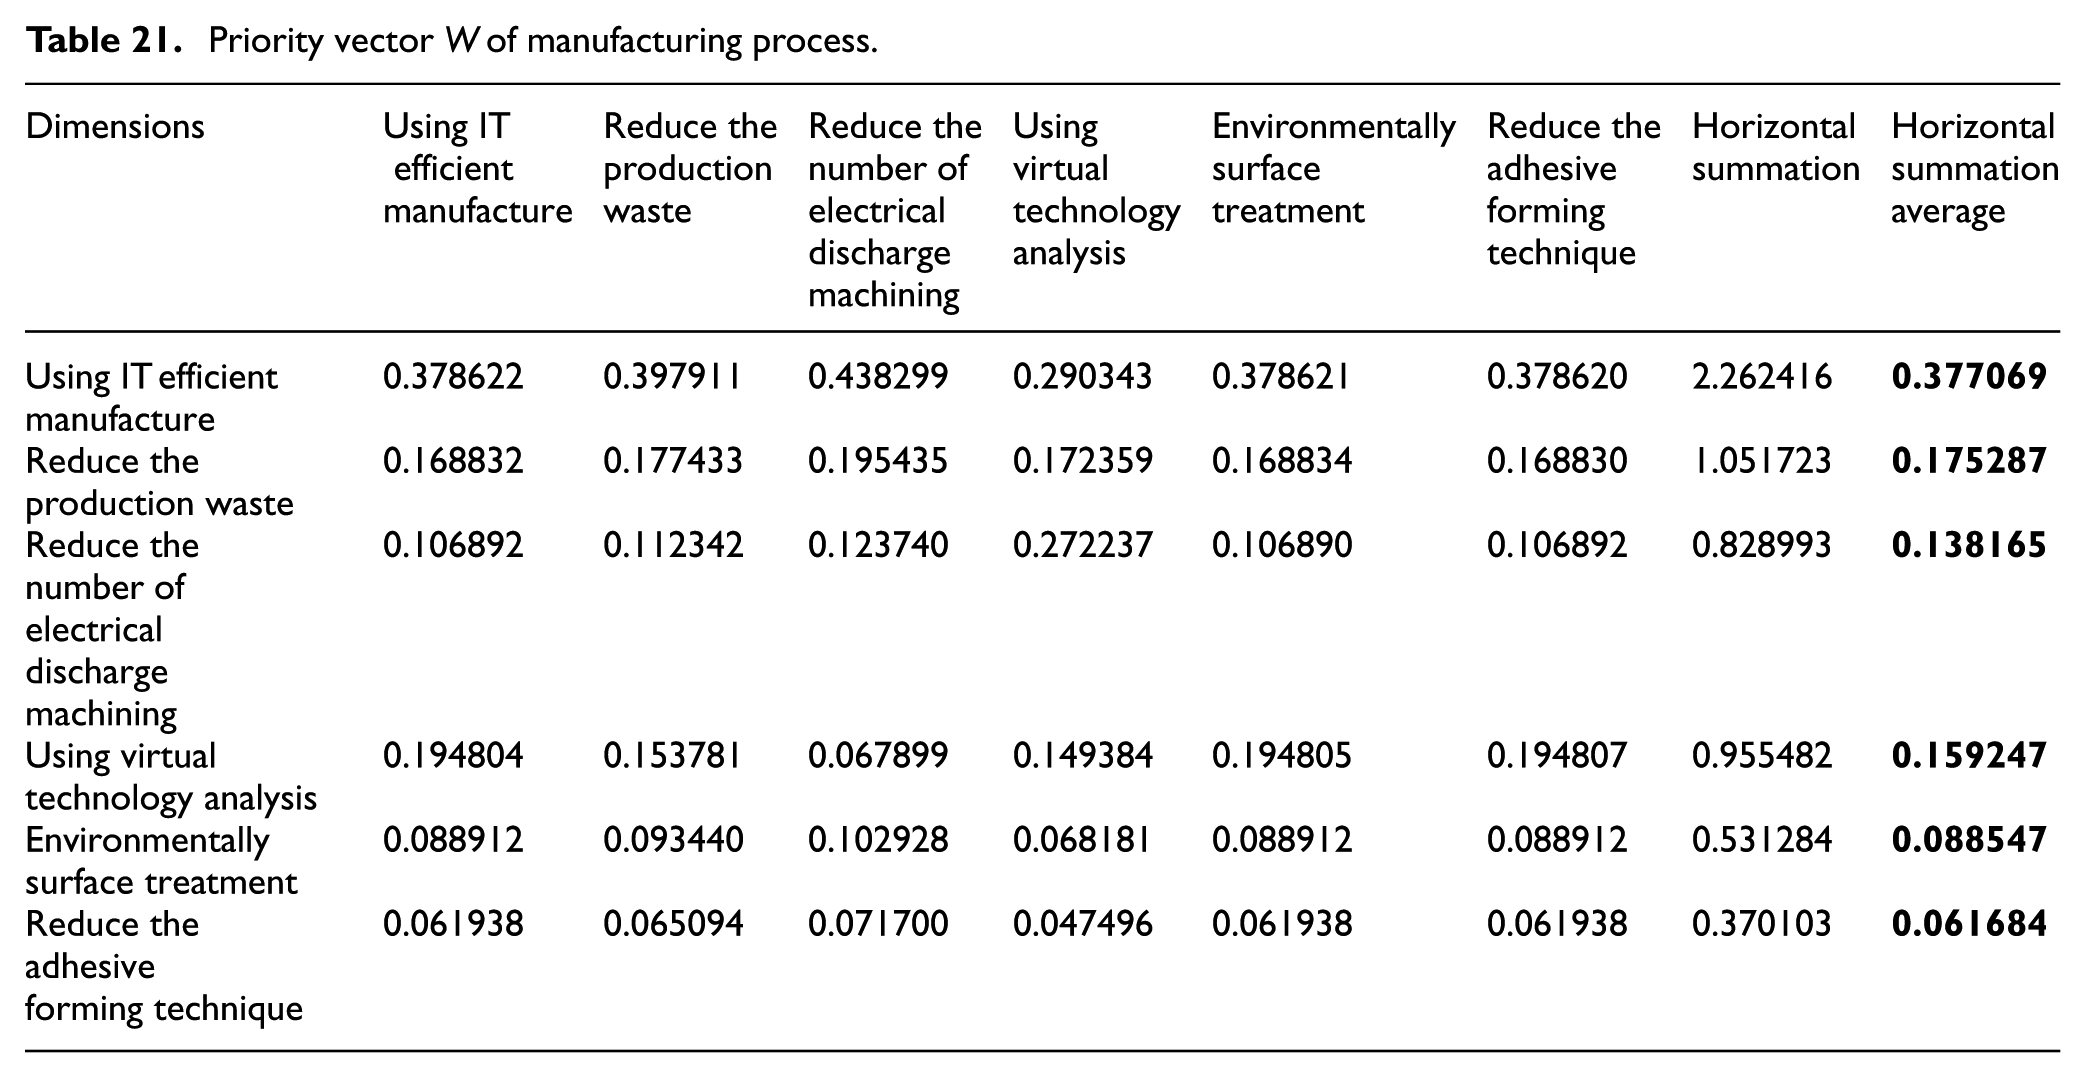
According to the figures obtained in Table 20, this study calculates the standardized figures through Excel. Upon the manufacturing process of Table 21 and priority vector W′, we acquire the horizontal sums and means, and thus, determine the ranking of the evaluation of manufacturing process. This study multiplies the mean of priority vector W′ of the manufacturing process of Table 21 by the corresponding goal values of the pairwise comparison matrix of manufacturing process of Table 20, which results in the horizontal sums and priority vector W′ of Table 22.
Priority vector W′ of manufacturing process.

This study divides the horizontal sums of priority vector W′ of manufacturing process of Table 22 by the mean of priority vector W′ of the manufacturing process in Table 21 and obtains the maximum eigenvalue (λmax) of the manufacturing process of Table 23.
Maximum eigenvalue in manufacturing process.

By Table 23, we acquire the maximum eigenvalues λmax = 1/6(6.161239 + 6.170815 + 6.215153 + 6.084919 + 6.161241 + 6.161237) = 6.159101. CI is CI = (λmax − n)/(n − 1) = (6.159101 − 6)/(6 − 1) = 0.03182. CR of manufacturing process and evaluation: when n = 6, the RIs are RI = 1.25, CR = CI/RI = 0.03182/1.25 = 0.025456. CI ≤ 0.1, CR ≤ 0.1, which meets the AHP suggestion of Saaty and satisfies matrix consistency.
Dimensions analysis of quality control (Level II)
Regarding the values obtained in Table 24, this study calculates the standardized values by Microsoft Excel to acquire priority vector W′ in Table 25, where the mean is acquired by the horizontal sum.
Pairwise comparison matrix of quality control.
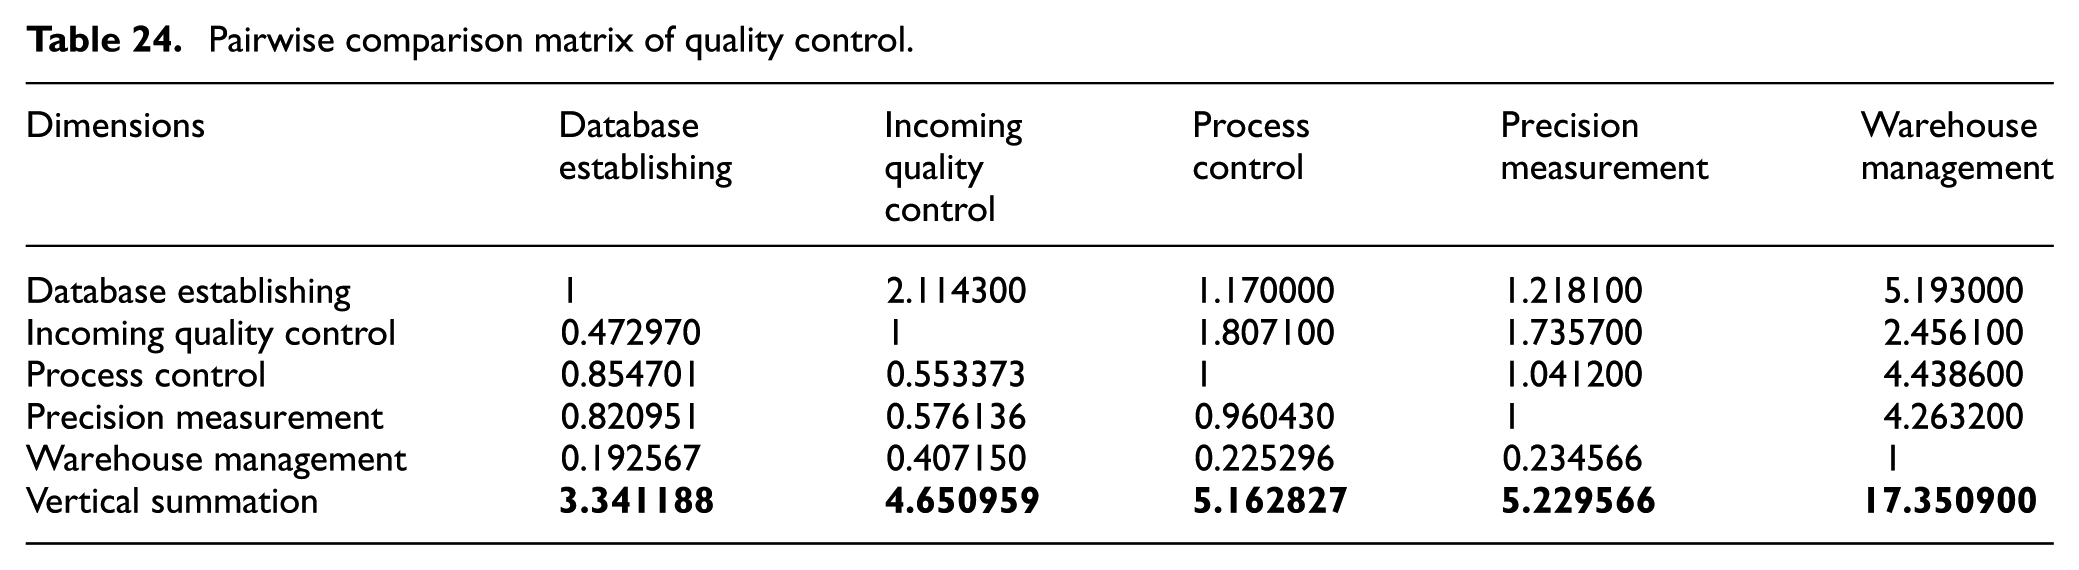
Priority vector W of quality control.

According to the figures obtained in Table 24, this study calculates the standardized figures through Excel. Upon quality control of Table 25 and priority vector W′, we acquire the horizontal sums and means, and thus, determine the ranking of the evaluation of quality control. This study multiplies the mean of priority vector W′ of quality control of Table 25 by the corresponding goal values of the pairwise comparison matrix of quality control of Table 24, which results in the horizontal sums and priority vector W′ of Table 26.
Priority vector W′ of quality control.
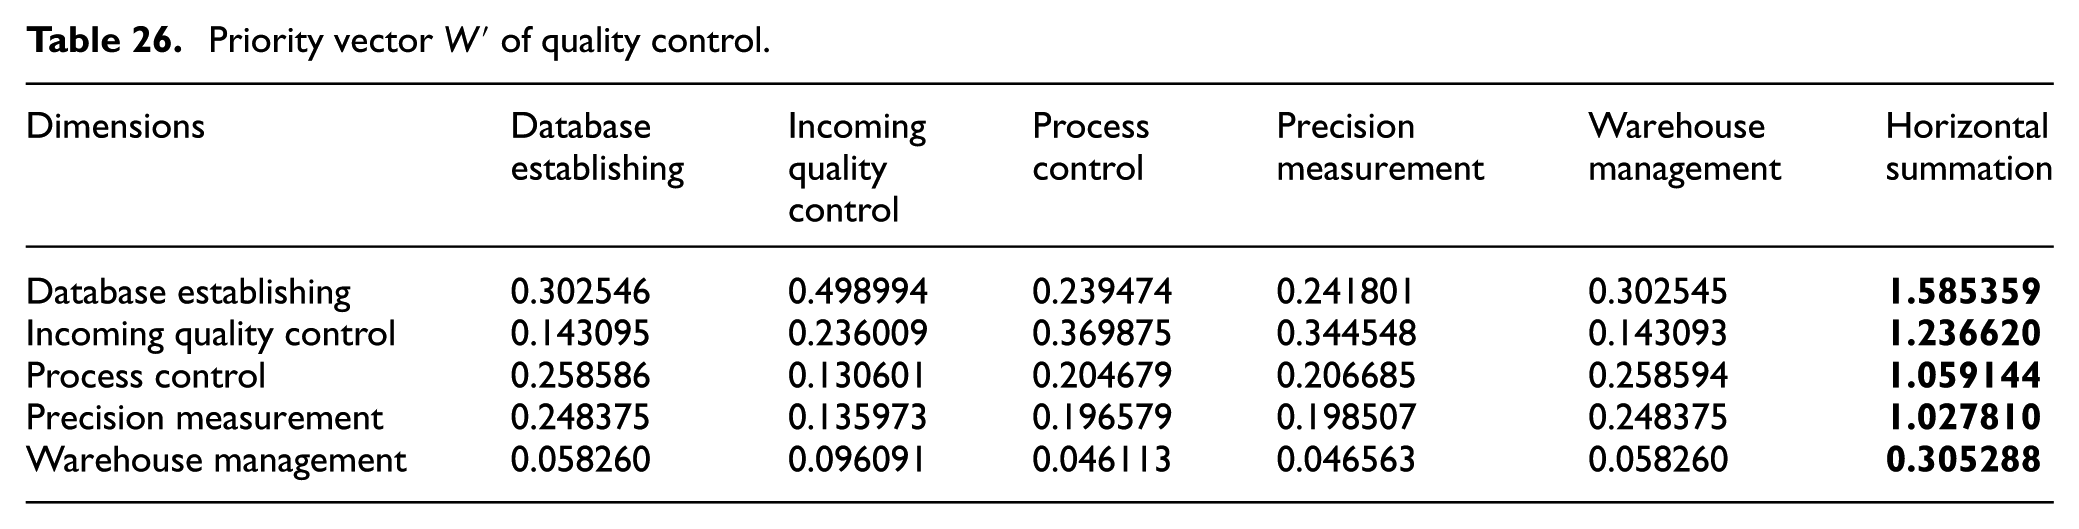
This study divides the horizontal sums of priority vector W′ of quality control of Table 26 by the mean of priority vector W′ of quality control in Table 25 and obtains the maximum eigenvalue (λmax) of quality control of Table 27.
Maximum eigenvalue in quality control.

By Table 27, we acquire the maximum eigenvalues λmax=1/5(5.240069+5.239717+5.174673+5.177703 + 5.240069) = 5.214446. CI is CI = (λmax − n)/(n − 1) = (5.214446 − 5)/(5 − 1) = 0.053612. CR of quality control and evaluation: when n = 5, the RIs are RI = 1.11, CR = CI/RI = 0.053612/1.11 = 0.048299. CI ≤ 0.1, CR ≤ 0.1, which meets the AHP suggestion of Saaty and satisfies matrix consistency.
Dimensions analysis of recycling and reuse (Level II)
Regarding the values obtained in Table 28, this study calculates the standardized values by Microsoft Excel to acquire priority vector W′ in Table 29, where the mean is acquired by the horizontal sum.
Priority vector W of recycling and reusing.

Priority Vector W′ of recycling and reusing.

According to the figures obtained in Table 28, this study calculates the standardized figures through Excel. Upon recycling and reuse of Table 29 and priority vector W′, we acquire the horizontal sums and means, and thus, determine the ranking of the evaluation of recycling and reuse. This study multiplies the mean of priority vector W′ of recycling and reuse of Table 29 by the corresponding goal values of the pairwise comparison matrix of recycling and reuse of Table 28, which results in the horizontal sums and priority vector W′ of Table 30.
Priority vector W′ of recycling and reusing.

This study divides the horizontal sums of priority vector W′ of recycling and reuse of Table 30 by the mean of priority vector W′ of recycling and reuse in Table 29 and obtains the maximum eigenvalue (λmax) of recycling and reuse of Table 31.
Maximized eigenvalue of recycling and disassembly.

By Table 31, we acquire the maximum eigenvalues λmax = 1/4(4.194446 + 4.078727 + 4.071807 + 4.061680 = 4.101665. CI is CI = (λmax − n)/(n − 1) = (4.101665 − 4)/(4 − 1) = 0.033888. CR of recycling and reuse and evaluation: when n = 4, the RIs are RI = 0.89, CR = CI/RI = 0.033888/0.89 = 0.038077. CI ≤ 0.1, CR ≤ 0.1, which meets the AHP suggestion of Saaty and satisfies matrix consistency.
Mold sustainable design factors in a PSS introduced in plastic mold development
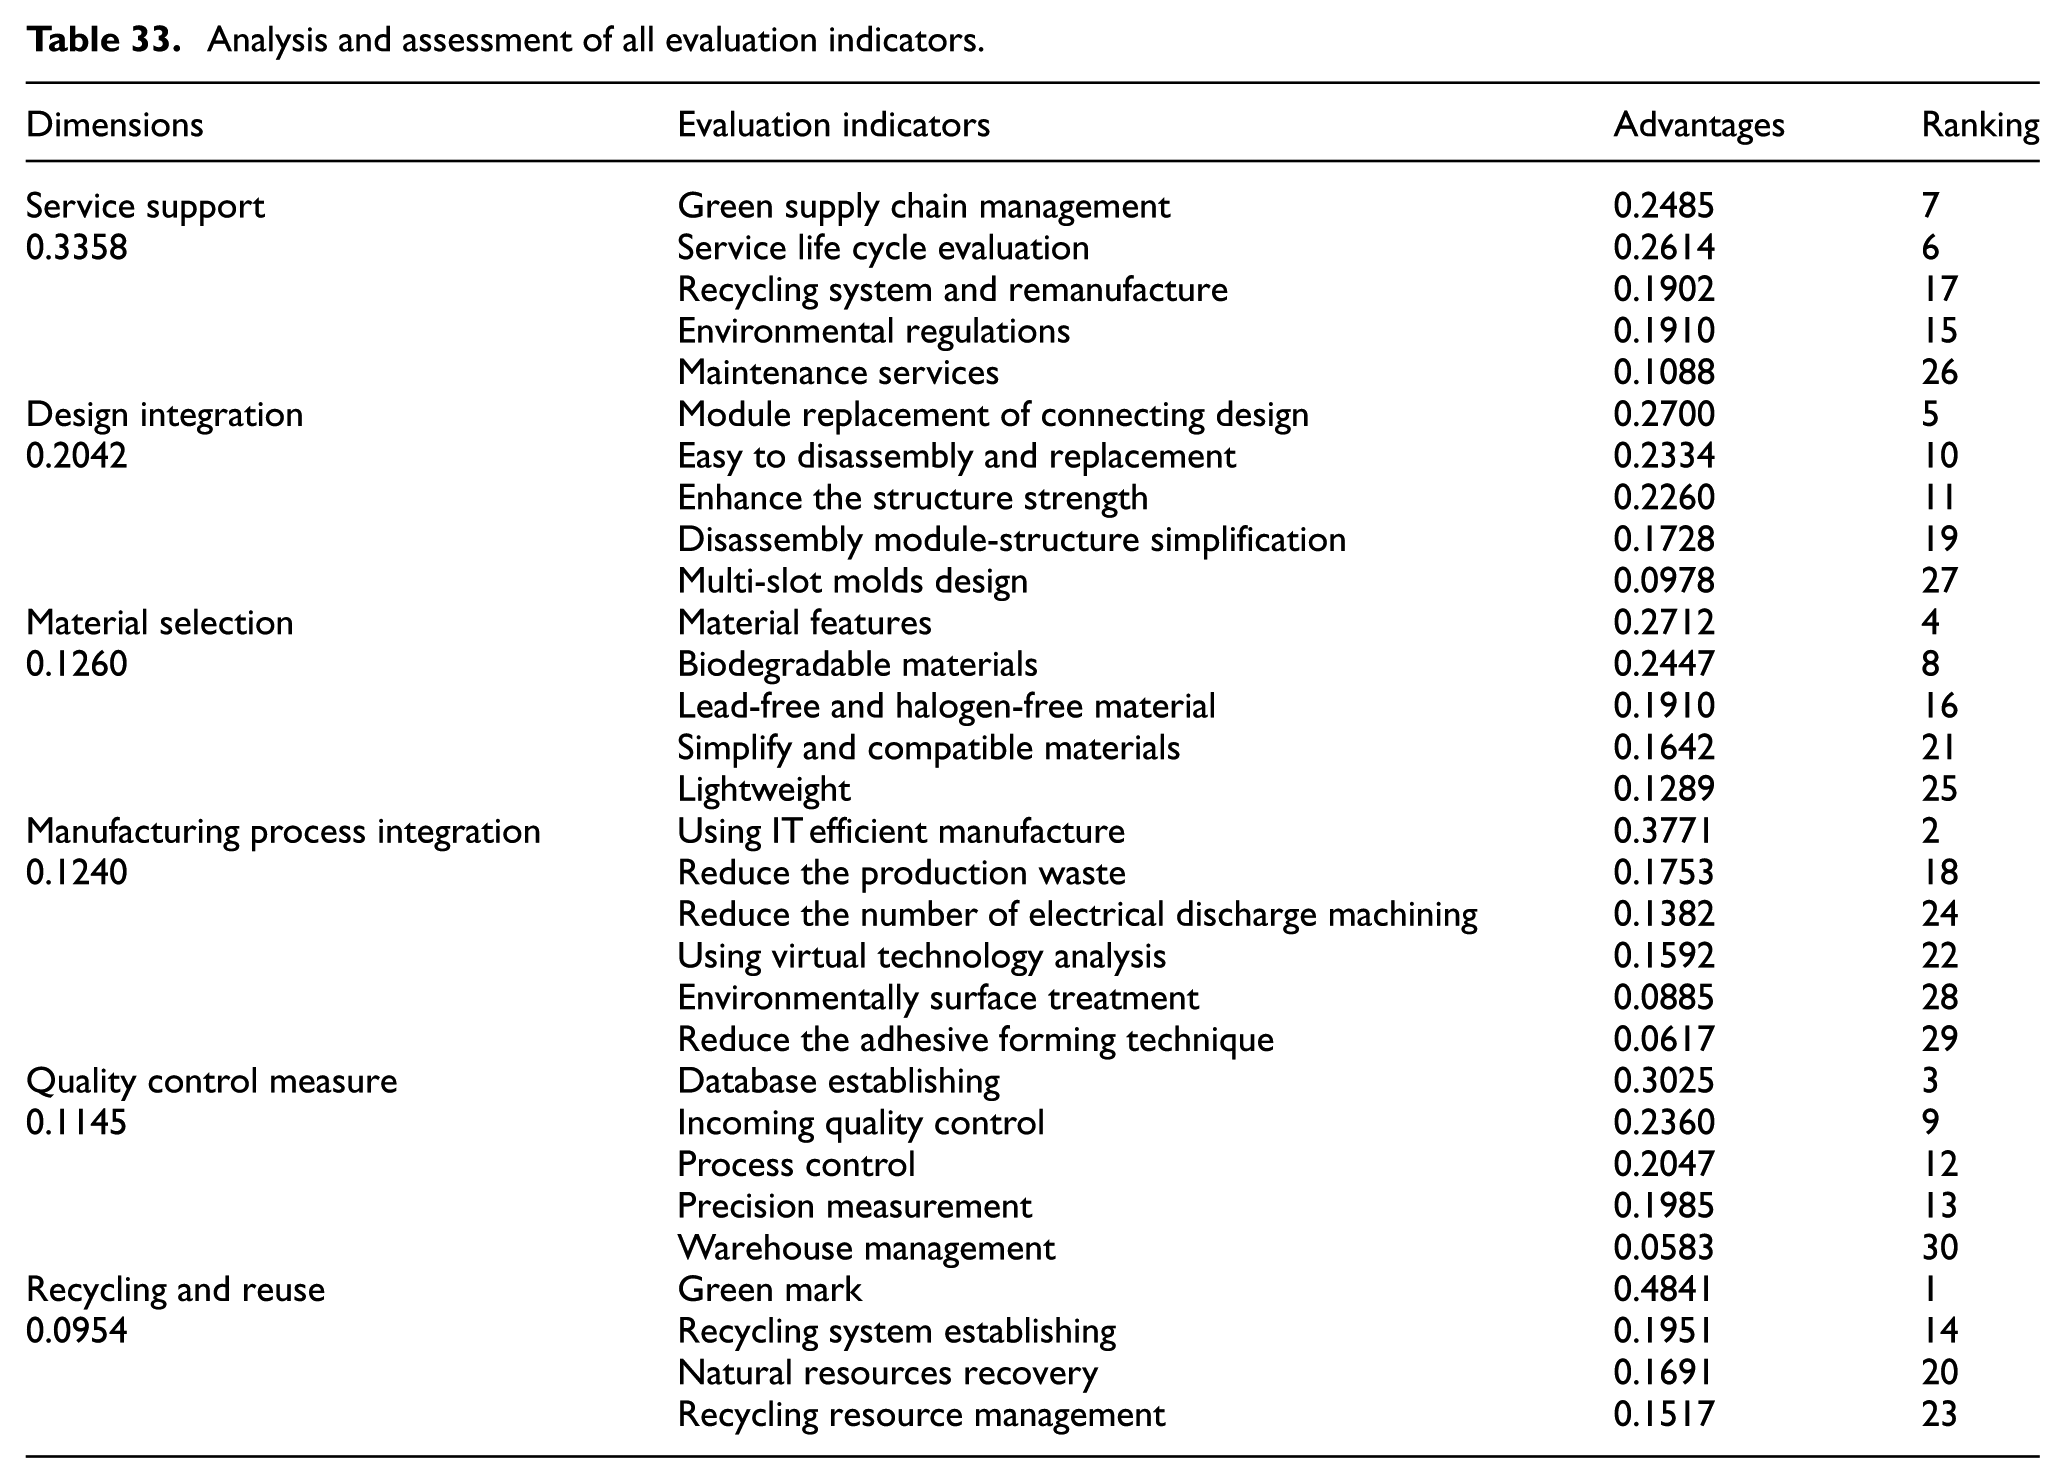
The findings of this study regarding the single-goal dimension analysis of plastic mold sustainable design and development in a PSS are shown in Table 32. Upon the analytical result, this study reorganizes the analytical units of all indices and conducts analysis of all indices, as shown in Table 33.
The single-goal dimension analysis of plastic mold sustainable design and development in a product service system.

CR: consistency ratio.
Analysis and assessment of all evaluation indicators.
Based on the previous figures, this study introduces the mold sustainable design factors in a PSS of traditional plastic mold development (see Figure 4), in order to establish a flow chart of plastic mold sustainable design and development in a PSS (see Figure 5).

Development procedure of traditional plastic mold.

Flow chart of sustainable design and development of plastic mold under product service system.
The flow chart of plastic mold sustainable design and development in a PSS is based on the ranking of the figures, as analyzed in the previous two sections. Plastic mold sustainable development and evaluation in a PSS is the first level, as shown by the green background. The plastic mold sustainable design and development model in a PSS is the second level, as shown by the gray background, which refers to the decision-making factors, including six categories: service support, design integration, material selection, manufacturing process integration, quality control, and recycling and reuse. This study obtains ranking according to the weighted figures of the weighted matrix in the previous two sections, eliminates the factors with insignificant product service decision-making elements, and treats the ranking of significant factors in the process as the third level.
Decision-making is based on the application of the perspective of a PSS. This study mainly explores decision-making regarding plastic mold development in a PSS, in order to avoid any impact on the environment, and thus, enhances enterprise environmental responsibility, lowers resource costs, and extends the sustainable operations of enterprises and mold life cycle. As the different ranking levels are associated, through vertical system ranking and extension of the steps, this study develops a circular system to lead to effective service for plastic mold applications.
Based on standard mold development, customers must first provide a draft or sample, then the company designs the mold concept, offers the price, and proposes the conditions and concerns of the molding. According to the customers’ responses, the manufacturer develops customers’ basic molding information and scheduling. After discussing mold concept and images, mold designers examine the appearance according to the image of the product and then design the mold. Once the customer validates the design, the designers start molding by constructing a working mold diagram and conducting mold analysis. Mold manufacturing includes pole design, editing the mold manufacturing program (computer numerical control (CNC), wire cutting program), pole manufacturing program (electrical discharge machining (EDM) wire cutting program), and component manufacturing. After mold testing, the mold action is examined by mold closing and mold layout, and the result of the mold trial is recorded in a report, which is viewed as the criterion for future production. The sample of the mold trial is then delivered to the customer.
However, in the sustainable design decision-making factors of a PSS, there are six elements of the plastic mold process that influence each other. There is also a vertical relationship among the green strategy elements of the factors. In addition, as this study is concerned about the reduction of materials in a PSS, it develops life cycle rankings for molds and designs the principles of the different phases of plastic molding. Hence, the services of processing, recycling, and reusing are included in the life cycle of the mold, because when recycling and reuse are considered in plastic mold development, service factors will be studied. Upon service, mold companies can establish a new business model through partnership.
Conclusion
The main purpose of this study was to explore the concept of product servitization in the plastic mold design and development process, which would benefit corporations in their development of products. By clearly prioritizing the processes and management of plastic molds to understand every stage of the green strategy, and change the traditional development process, corporations can reduce their waste of resources and lower their costs, while simultaneously enhancing their corporate social responsibility to establish new competitive advantages. This study provides enterprises with a method to implement a goods and services system that can design products, provide production support services, and distribute the processes to achieve the goal of dematerialization.
The literature review shows that understanding product servitization could support the service processes of product dematerialization. In the development process of plastic products, the plastic mold is a key factor that affects the performance of the final product.
In terms of the mold production cycle, in order to realize the concept of service-supporting dematerialization, materials of molds and shaped materials should be recycled by special personnel from special recycling firms. In this way, zero-discarded regeneration technology can be formed. In addition, distributors, manufacturers, and suppliers cannot reach consensus on recycling or reproducing; thus, the majority of distributors are reluctant to recycle and reproduce products. Therefore, the concept of recycling and reproducing should be vigorously advocated.
Molds are the best tools of standardized production. Nevertheless, due to the fierce competition in global markets and the reduction of product life cycles, all R&D and design projects should complete the development of products within a limited period. The domestic information industry and traditional manufacturing industry have the tendency to integrate toward the downstream gradually, and they will replace companies that are solely dependent on manufacturing molds, which will enhance the competitiveness and confidentiality of product development. In the future, our focuses will be how to propose the most effective vertical integration strategy using limited resources, and how to minimize the uncertain risks of development projects. Therefore, future studies can explore mold integration issues and “industrial cluster” in a deeper manner.
Hence, if the product development processes of molds, under the premise of environmental sustainability, use green design principles and strategies to integrate environmental considerations for all of stages of the production cycle, it could immediately confront the possible problems to the environment and further reduce the influence of product life cycle on the environment. It can be seen that the plastic molds have requirements and factors related to the environment.
In addition, when companies bear greater responsibility for the environment, product servitization provides new points of view and will allow companies to become more competitive and innovative producers. Therefore, the plastic industry must enhance green techniques and further focus on the whole life cycle, from design to manufacturing, in order to reduce their influence on the environment and adapt to national law. At the same time, it can enhance the value of the entire plastic mold industry in the market.
Footnotes
Academic Editor: Stephen D Prior
Declaration of conflicting interests
The author(s) declared no potential conflicts of interest with respect to the research, authorship, and/or publication of this article.
Funding
The author(s) received no financial support for the research, authorship, and/or publication of this article.