
Abstract
The volute is an essential element in the centrifugal machines. Improving its performance is an effective way to improve the total performance of the turbine. The purpose of this study is to replace the accelerating and guiding nozzle vanes by exploring different design possibilities on the cross-sectional area convergence of the volute, since a decreasing area is then associated with expansion in the subsonic regime. The work is extended to a mixed inflow turbine using the new volute cross sections under pulsating regimes for turbocharging. The numerical simulation results show larger accelerations
Introduction
The use of radial or mixed turbines in low-power installations is an essential element in industrial gas turbine applications, and they are typically marked by their high expansion levels, reduced cost, the easier way to be manufactured, and also good performances over a wide operation range; since they are much less bulky to integrate as an auxiliary unit, the turbochargers is an essential part within the internal combustion engines, and it has an important effect which is directly related on the engine performances. The mixed inflow turbine are suitable for many applications where compact power sources are required with higher boost pressure, they represent a suitable choice for the internal combustion engine turbocharging. The rotor sensitivity to the fluid flow uniformity in terms of thermodynamic parameters, speed, and to the optimum absolute angle of attack has given rise to more considerations to the spiral casing of the mixed inflow turbine. The turbine with inlet nozzle set usually achieves higher peak efficiency than one with a nozzleless casing, but the latter is better equipped to cope with off-design considerations which are very specific to pulsating flow. As the fluid flow acceleration before entering the rotor is of prime importance in the energy transformation to mechanical shaft work, one replace the nozzle set by a converging geometrical volute cross-sectional area. This investigation is undertaken in order to find the most suitable shape to accomplish this, keeping the same magnitude of the cross-sectional area of the volute.
The measurements made by MacGregor et al., 1 at the volute exit, shown that an acceleration of the fluid flow reduces losses and the flow distributions are rather uniform, and these measurements have also shown that the tangential component of the velocity is almost axially uniform and the radial component is being slightly varied at the tongue region. However, Kreuz-Ihli et al. 2 deduced experimentally that the circumferential velocity component within the volute is slightly dependent on the axial direction. In just upstream to the rotor inlet, the circumferential velocity of the flow is almost equal to the speed of the blade tip. The axial component of the velocity decreases with the distance from the hub. For the purpose to keep the volute inlet conditions and precisely in the tongue region which is the development of the turbulent flow and radial variation of the angular momentum more compatible and appropriate with the conditions required at volute exit, Chapple et al. 3 defined the curvature of the pipe at volute inlet for the angle range between 85° and 120° relative to the rotor axis. They also noted that the creation of non-uniform flow downstream from the volute through the rotor blades channels can produce some vibrations and causes the destruction of the machine. Other experimental investigations have been shown that the free vortex distribution in the volute is not maintained until azimuth angle 360°, especially when the azimuth angle is larger than 270°, when the fluid is guided by the outer wall of the volute casing.1,4 Benisek and Spraker 5 used the laser Doppler velocimetry (LDV) for monitoring the flow at the outlet of two vaneless volutes with different geometry with average area–radius ratios (A/r) equal to 35 and 53 mm, respectively. These measurement properties and flow directions show more variation in incidence angle for the smaller volute size. They added that the absence of the nozzles space does not influence significantly the turbine efficiency. Scrimshaw and Williams 6 found from the tests applied on three asymmetrical volutes of similar shape and different size that the average total pressure losses associated to the stator increases with the reduction in the overall volute size.
Hashemi et al. 7 conducted a study on a radial blades cascade, and their results in images showed just at leading edge the formation of the Horseshoe vortices, with a flow angle variation along the circumferential direction. They also noticed the appearance of these vortices which appear larger in size if the variation in incidence angle was important. Eroglu and Tabakoff 8 noted in their experimental measurements on the flow field upstream, throughout, and downstream of the nozzle vanes within a radial turbine using an LDV system that the velocity contours upstream of the leading edge is reasonably uniform and at the same time are not symmetrical between the two walls; according to them, this is due to the geometrical effect of the volute. At the exit area and downstream of the trailing edge, both researchers noticed that it is difficult to distinguish between the free stream and the region swept by the wake, with a large disturbance in the velocity distribution mainly due to the high level of turbulence and sudden mixture. A series of several radial turbine volutes with and without stator blades were experimentally tested by Spence et al., 9 and all the three vaneless stators are designed from the free vortex model presented by Chapple et al. In each case and relative to the turbine fitted with guide vanes, the vaneless turbine stator showed its performance with an increase in the measured efficiency up to 4.5%.
Simpson et al. 10 described a prediction of the performances using a numerical simulation code, and they identified the losses generated within the various stators tested with the validation of the obtained results by an experimental comparison; among their achievements is the accurate prediction of the mass flow rate for the vaneless turbines compared to the vaned turbines, However when they presented the curves of the isentropic efficiency. They noted that the calculations performed by the numerical simulation code are generally acceptable in their evolution rather than their absolute values. They also presented a comparison of the different values of the static pressure at rotor inlet for the two turbine configurations with and without nozzle vanes. The curves established in function of azimuth angle showed 13 successive peaks which represent in fact the jets and the wakes resulting from 13 stator blades installed upstream of the rotor. At the end, they derived a conclusion to reinforce the idea of adopting more vaneless volute designs that can give us a higher performance and more consistency in the rotor inlet.
Putra and Joos 11 used both numerical and experimental approaches for studying the flow through a radial turbine blade passage. Measurements using the laser two-focus (L2F) were performed in the middle and in other location inside the stator vanes, and the obtained results are compared by numerical predictions using the Reynolds stress model (RSM) and the standard model (k–ε). A good argument was noticed between the RSM and the experimental measurements of flow angle and its distribution at exit area; however, the (k–ε) model provided almost two-dimensional results. The use of the RSM showed the presence of many weak vortex than those encountered in an axial cascade which are derived from uncambered vanes. An additional vortex known as inflow vortex is observed, which is the product of the asymmetric shape of the cross-sectional area of the volute.
Bhinder 12 in his article on the flow within the vaneless volute of a radial turbine revealed from a more detailed analytical study that the linear relationship between the cross-sectional area and its mean radius as well as function of azimuth angle satisfies to the condition of constant mass flow per unit radial area pet unit time. He also noted that the change in flow angle in the exit area of the volute causes a non-uniform distribution at rotor inlet; and on the basis of the introduced equations used in the design of vaneless volute, the author showed that this variation can be avoided and the angle remains constant if the cross-sectional area varies linearly with its mean radius through the azimuth angle, and in the same context, he attempted to plot curves of area–radius ratio (A/r) based on azimuth angle variation for three different volute configurations. The results obtained are contradictory to the theory constructed from the equations and assumptions previously established, and the plotted curves are almost linear which implies a certain large variation in the outlet flow angle.
In the same way, Gu et al. 13 attempted to find a non-linear relationship between the area–radius ratio (A/r) and azimuth angle using two different approaches, and in the first approach, the fluid is assumed incompressible, in which they neglected its compressibility. However, the second method of the compressible approach includes all geometric and aerodynamic parameters with the introduction of the additional equation of perfect gasses. The equations determined based on the hypothesis and assumptions from both approaches allow to classify in a table the ratio of A/r values found in both compressible and incompressible cases based on the Mach number at volute outlet. The values calculated by these researchers have shown that the difference becomes larger according to the increase in the exit Mach number. They indicated the effect of having the larger area–radius ratio on exit flow, for which they give their explanation regarding to the increase in the ratio of A/r accompanied by some decrease in the value of the mean radius (r), and this provides a larger angular momentum, but a higher exit flow angle values with a deviation away from the expected path. So, the theoretical analysis has proven on somehow that the sizing based on the incompressible approach gives a slightly credible result if the application concerns a radial turbine volute which operates with a compressible gas.
Luddecke et al. 14 give another argument about the design and overall size of the volute in comparison with that of the rotor defined by the ratio (A/r). They estimate that the increase in this ratio (A/r) penalizes on one hand the performances of the automotive turbocharger which necessarily operates in a pulsed environment, in which one can expect a more kinetic energy losses of the exhaust gas, mainly due to a significant volume of the volute that indeed occupies a large proportion in the total volume of the exhaust pipe. So, according to them, the use of a volute with the smallest possible volume in automotive applications is the better choice since these types of scrolls exploit efficiently the kinetic energy of pulsed gas despite their operation in terms of incorrect incidence and of unfavorable flow angle for low speed ratios. 14
The main purpose of using an automotive engine turbocharger is to extract the maximum power by exploiting the energy contained in the gas exhaust duct providing well from the continuous opening and closing of the exhaust valves. In this context, Chen et al. 15 showed using the theoretical analysis that the potential isentropic energy is more significant for the unsteady flow case than in the steady flow one, with the use of the same cycle mean pressure ratio. Several studies of numerical calculations have been carried out about the behavior of the mixed-flow turbine under periodic and pulsatile flow conditions. Using a one-dimensional unsteady method applied to the four different cases, the numerical calculations conducted by Chen et al. 15 shown their limits, especially during the representation of the numerical results concerning the variation in the instantaneous mass flow rate and the power values, and they noticed an amplification of the fluctuations in the characteristic curves particularly in the low-frequency case.
Abidat et al. 16 presented a method for predicting the performances of mixed-flow turbines with a single admission entry under unsteady flow conditions, this method consists on one hand to assume the volute volume as a curved pipe, and on the other hand to remain the rotor speed unchanged during the unsteady pulsed flow conditions, when Runge–Kutta four steps scheme and second order in time is used in order to get much more explicit calculations, their results show an out-of-phase between the mass flow rate and total-to-static pressure ratio, this out-of-phase difference continues to decrease with the decrease of the frequency, until to have the corresponding values with the quasi-steady state. In parallel, they add a study about the influence of the amplitude and the frequency of the pulses on the average characteristics within the turbine; this last step shown that the effect of the pulse frequency on the instantaneous mass flow rate is completely negligible, although the influence of the amplitude on the average value of the instantaneous power is slightly more significant.
This study focuses on changing the cross-sectional area of mixed inflow turbine volutes for the purpose to increase their performances and their operating range. Two numerical simulation cases are studied: first is a steady-state method used to analyze the flow inside the four configurations of volute, and the second is the unsteady pulsed method applied with the interaction between the volute and the rotor.
Geometry of the volute
The geometrical computing of the volutes depends on the type of fluid; when the volutes designed with the incompressible approach are used in compressible flows, a better result of a free vortex distribution is not resulted. 13 However, several experimental studies such as that of Eroglu and Tabakoff 8 give another argument when they revealed using the LDV measurements a similar exit flow angle values for two different mass flow rates. Also, Binder et al. 17 confirmed this trend using a directional probe with five holes disposed downstream of the volute exit; in this point of view, they noticed that the flow angle at the exit area is not very sensitive to the variation in mass flow rate.
The provided design is particularly based on the one-dimensional procedure described by Whitfield and Baines
18
and Tabakoff et al.
19
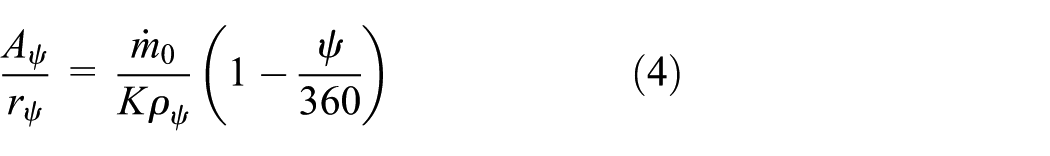
They relate to the determination of the area
The mass flow rate

With
Equation (1) can be written as

The free vortex law which was used to calculate the tangential component

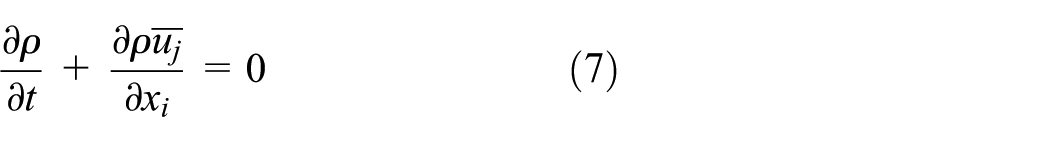
Using the mass conservation equation,
If the fluid compressibility is neglected, the ratio
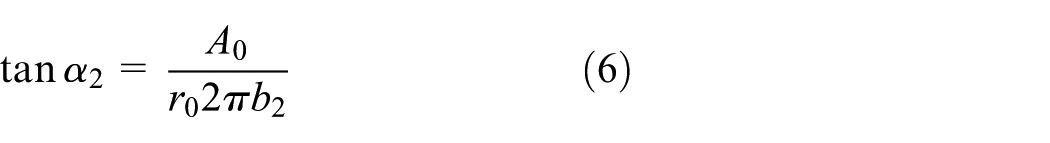
One can express the volute exit angle
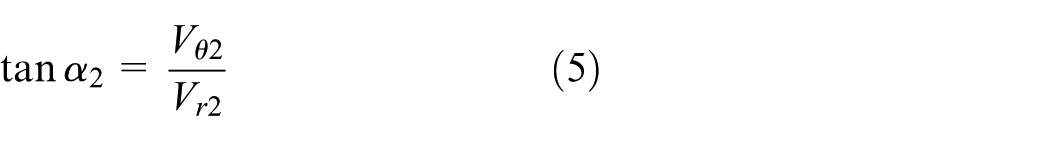
By replacing velocity by their expressions from the equation of continuity and the free vortex law, one obtains
The cross-sectional form for each vaneless volute
The given geometrical shape of the asymmetric volute in Figure 4 transforms portion of the available potential energy of the gas into kinetic energy; this geometrical configuration is a result of specific combination between two different forms, the convergence and the spiral; this arrangement allows to create more acceleration of fluid particles in both tangential and radial directions.
In order to maintain the optimal power, without using the aerodynamic nozzle vanes, the different dimensions of the flow cross section are varied, with the same appropriate transversal area and shape of the old volute and taking into account the turbocharger size and its location. Adaptation of such cross section is primarily governed by the choice of the geometrical shape which exhibits more acceleration with the minimum loss. To make this change, the need to test other configurations in the aim to estimate their influences on the performance of the mixed-flow turbine is necessary.
Based on the same flow cross-sectional area, the volute C as seen in Figure 1 represents a longitudinal extension in the axial direction with increasing the ratio of convergence in radial direction
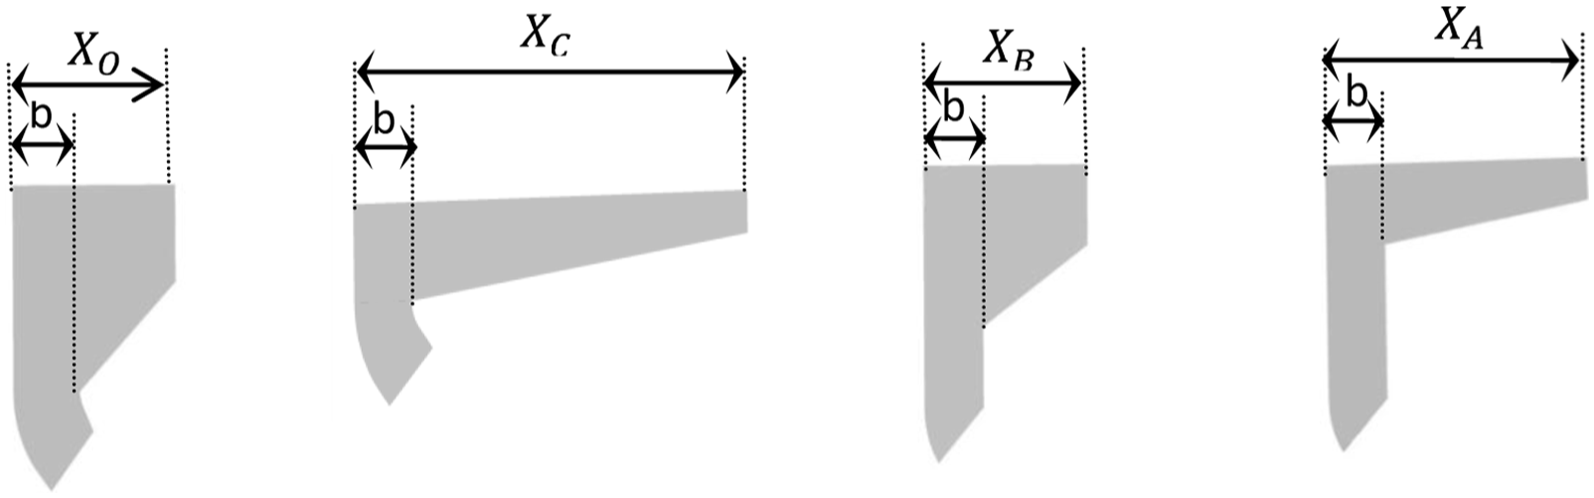
The cross-sectional shape of each configuration from the left to the right: old volute and volutes C, B, and A, respectively.
The variation in the area–radius ratio with azimuth angle
In order to match the mixed inflow turbine rotor with the discontinuous variation of a pulsed flow, it is necessary either to adjust the flow direction by integrating the variable guide vanes upstream of the rotor or to vary the flow regime using a vaneless volute casing with a variable inlet area–radius ratio

Theoretical prediction of the exit flow angle versus inlet area–radius ratio for the old volute and volutes A, B, and C plotted with the solid circle (red), solid down triangle (blue), solid up triangle down triangle (green), and solid square (black) points, respectively.
The evolution of the function that relates the ratio of the cross-sectional area of each volute with different vaneless space and its mean radius (A/r) along the azimuth angle is shown in Figure 3. The reduction in the area–radius ratio (A/r) according to the azimuth angle for the three configurations (A, B, and the older volute) is almost linear contrary to the drawn curve of the volute C which corresponds to a non-linear evolution, with more confidence to have a better stability and uniformity of exit flow angle compared to the other configurations.

Variation in A/r versus azimuth angle for each vaneless volute (old volute and volutes A, B, and C) plotted with the open circle (red), open up triangle (blue), open down triangle (green), and solid square (black) curves, respectively.
Turbulent flow model
In the turbulent flow cases, the direct solution of the Navier–Stokes equation would be very costly. To take account of the turbulent flow, a statistical analysis of these equations is performed. This decomposition is introduced into the Navier–Stokes equations, which are then averaged. In the averaged equations appear an additional terms that must be modeled. For this purpose, the Boussinesq approximation is used in aim to closing the system by introducing the additional assumptions and equations


The molecular and turbulent Prandtl numbers can be undertaken constant (for example with air:
In this case, the k–ε of Launder and Spalding is chosen
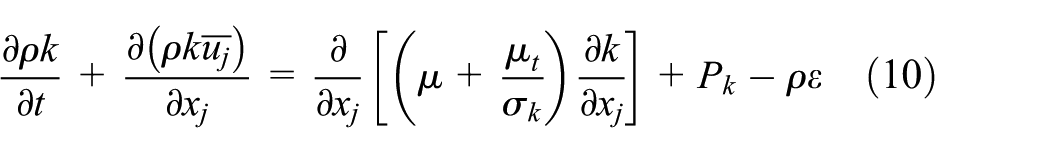

with
For more precision, it is interested to test other performance model as the RSM, and this model differs from the previous one—the transport equation of Reynolds stresses is resolved as the mean field equations

Numerical method
The numerical methods used to simulate turbulent flows are currently based on the finite volume method, which is applied to an unstructured mesh with tetrahedron form using ANSYS ICEM, and this form is the computational domain for a given geometry which must be created first.
The field of tetra mesh is refined differently from the various regions; for example, the resolution of the mesh in the near wall region must be refined enough to reduce the change in variables from one cell to another. In the finite volume method, the conservation laws of mass, momentum, and energy are expressed locally by their integral form. With the help of the divergence theorem of Gauss, partial differential equations are integrated through a fixed control volume, fluxes terms are then evaluated at the interfaces between the finite volumes, and the use of numerical fluxes function permits to approximate this fluxes at the interfaces. The big problem of cloture is based on the relation between the variable in integration points and the variable nodes, and in CFX, the high-resolution advection scheme is implemented using another correction than employed in the first-order scheme (upwind scheme); this code uses a single cell, the velocity and pressure of which are stored in the same position.
Mesh generation
In order to keep a minimum number of nodes without much more influences on the performance of a turbulence model and on the resolution of the boundary layer, one should be sure to keep the first node of the mesh from the wall in the log-law layer, and it is therefore necessary to increase the number of elements in the boundary layer near the wall. Outside of this boundary layer, the number of elements can be reduced, and the problem in this way converges with a fewer iterations and the computation time will be reduced.
The elements used to discretize the computational domain are prisms near the wall and tetrahedrons far out the wall, considering that this distribution varies from one area to another according to the size or the volume concerned; however, the complexity of these regions has an important priority when the grid resolution must be much more refined in order to capture the maximum information. In this work, the total volume of the turbine is divided between the stationary vaneless volute and the rotating rotor. Table 1 shows the evolution of the static pressure at the volute outlet of the four vaneless volutes; for each volute, three different meshes are used to estimate their influences on final results. The non-uniform grid 1 is applied for the four volute configurations in order to provide a high precision about the analysis of internal flow structure; however, this resolution requires a significant solver time and powerful material support, the reason for which the uniform grid is indeed used to study the different performance prediction in steady and non-steady conditions. However, the volume of the rotational rotor contains a much higher density (2,525,795 elements with uniform grid resolution) due to the complexity of the flow within the rotor and around the aerodynamic blades.
Average static pressure at exit surface of the four vaneless volutes.

Numerical simulation
The structure of the flow within the turbomachines is three-dimensional; the numerical solution, for example, is a set of programs exploited to simulate a physical sequence in order to get the closer results relative to the real process; these three-dimensional models require a considerable time and also a powerful computer characterized by their efficient processors which are able to managing hundreds of formulas. This study is in the context to introduce some variations about the volute geometry of the mixed-flow turbine in terms of their performances, and the use of the three-dimensional simulation is an important step for the preliminary estimate of performances obtained under steady and unsteady flow conditions (Figure 4).

Mixed-flow turbine mesh.
The numerical study has several objectives, which are given as follows:
To study the structure and phenomenology of fluid flow within the four asymmetric volute configurations tested under steady conditions.
To analyze the internal flow parameters showing the behavior of fluid particles at a mean streamline.
To compare the numerical and the theoretical values of the absolute flow angle at exit of the four volute configurations.
To define the circumferential interval for an irregular variation in the exit flow angle.
To establish the unsteady performances of these configurations with a rotor stator interaction.
The actual work was divided into two parts: the first part is devoted to simulate the four configurations volute tested under steady flow conditions without the presence of the rotor; however, to illustrate the characteristic curves of mass flow rate during the pulsating mode operation, the second part is focused on the interaction between the four volute configurations (old volute and volutes A, B, and C) with the same rotor.
The steady-state boundary conditions
Before starting the simulation, the determination of boundary conditions which can be imposed on the computing domain is an important step, and the total pressure of the inlet gas, its total temperature, the condition considered to be fixed on the smooth walls, the adiabatic evolution, and the static pressure at the outlet are all imposed depending well on the studied problem. For the turbulence model in ANSYS CFX, a two-eq13 model has been used; the Reynolds-averaged Navier–Stokes (RANS) system can be solved for other variables such as velocity components, the pressure, density, temperature, and the
Numerical results and discussion
A series of experimental measurements were achieved by Abidat 20 on a mixed-flow turbine (Table 2), which constitutes a rotor that was characterized by a constant angle of 20° at the inlet and a blade length of 40 mm toward the axial direction. This turbine was tested by other group of researchers such as Arcoumanis et al. 21 and Chen et al. 15 Using these experimental test data, a numerical analysis in the stationary case is performed by means of computer simulation using CFX software that was designed for this purpose.
Turbine geometry.

The internal flow analysis
The pressure contours of Figure 5 situated at a longitudinal section and an axial distance Z = 15 mm indicate that the static pressure is expanded in radial direction toward smaller and smaller values in most peripheral regions, apart the particularity of the tongue region, where it can be shown a strong pressure gradient, and this gradient affects instantaneously the rest of thermodynamic parameters, as well as the structure of the free vortex flow. In the converging part of the inner volute wall of the cross-sectional area as sketched in right-hand side of Figure 5, it can be noticed that the pressure has high values compared to the other regions in axial direction, and this is an indirect effect of a blocked fluid flow against the secondary flow. The presence of the bending duct can also be termed as a part of an undesirable effect noted for the mixed-flow turbine volutes especially when the asymmetric flow section is combined with. This action causes also a significant decrease in velocity toward the radial direction.

Contour of static pressure in the longitudinal surface (Z = 15 mm) and in the inlet cross-sectional area of the old volute at
With the use of the numerical simulation code, which allows to study the detailed flow structure through a perpendicular passage to the tangential direction within the volute, and in the purpose to have more explanations about the phenomena governing the flow patterns upstream of the rotor, one attempts to present several series of cross-sectional area from the four vaneless volute configurations located at four different azimuth angles (0°, 90°, 180°, and 270°) as shown in Figure 6 while maintaining a certain degree of accuracy concerning the scale and the proportions presented about the flow cross section that converges gradually from the inlet of the spiral pipe until the exit cross section under the tongue. The sections are located at 0° just after the volute tongue where one can see the influence of the wake produced from the tongue region that separates and delimits the vortex structure between the volute and the vaneless space. In vaneless stator space, a significant area is occupied by a strong recirculation that seems different for each geometry, which is previously defined according to their integrated volume. It may be simple to observe a large recirculation zone for both the configurations fitted with a complete volume stator (old volute and volute C). One can also distinguish the number and different size of the vortices found in this first cross section for the four vaneless volutes according to the influence of the appropriate configuration and the proposed dimensions. The volute configurations with their flattened and extended cross sections toward the axial direction (volutes A and C) contain a large vortices that occupy a significant portion in the extended convergence region; furthermore, the volute A extended in radial direction with a reduction in overall volume and also contains a significant vortex that occupies the inferior portion of the cross-sectional area. At 90°, the undesired influence of the wake region produced from the tongue observed upstream of the vaneless space, and also, the presence of a recirculation zone just before the exit area is almost vanished in most configurations. In parallel, the shape of vortices is modified, and their sizes have been changed considerably from one section to another. The additional vortices are observed in the top region of the old volute cross section at 180° where the passage vortices interact with the smaller corner vortices, and this effect is not evident for the rest of the configurations. For the angles equal to 270°, the cross-sectional area decreases and the passage vortices occupy much the transversal surface. The constant presence of these vortices causes significant loss in the center passage within the volute.
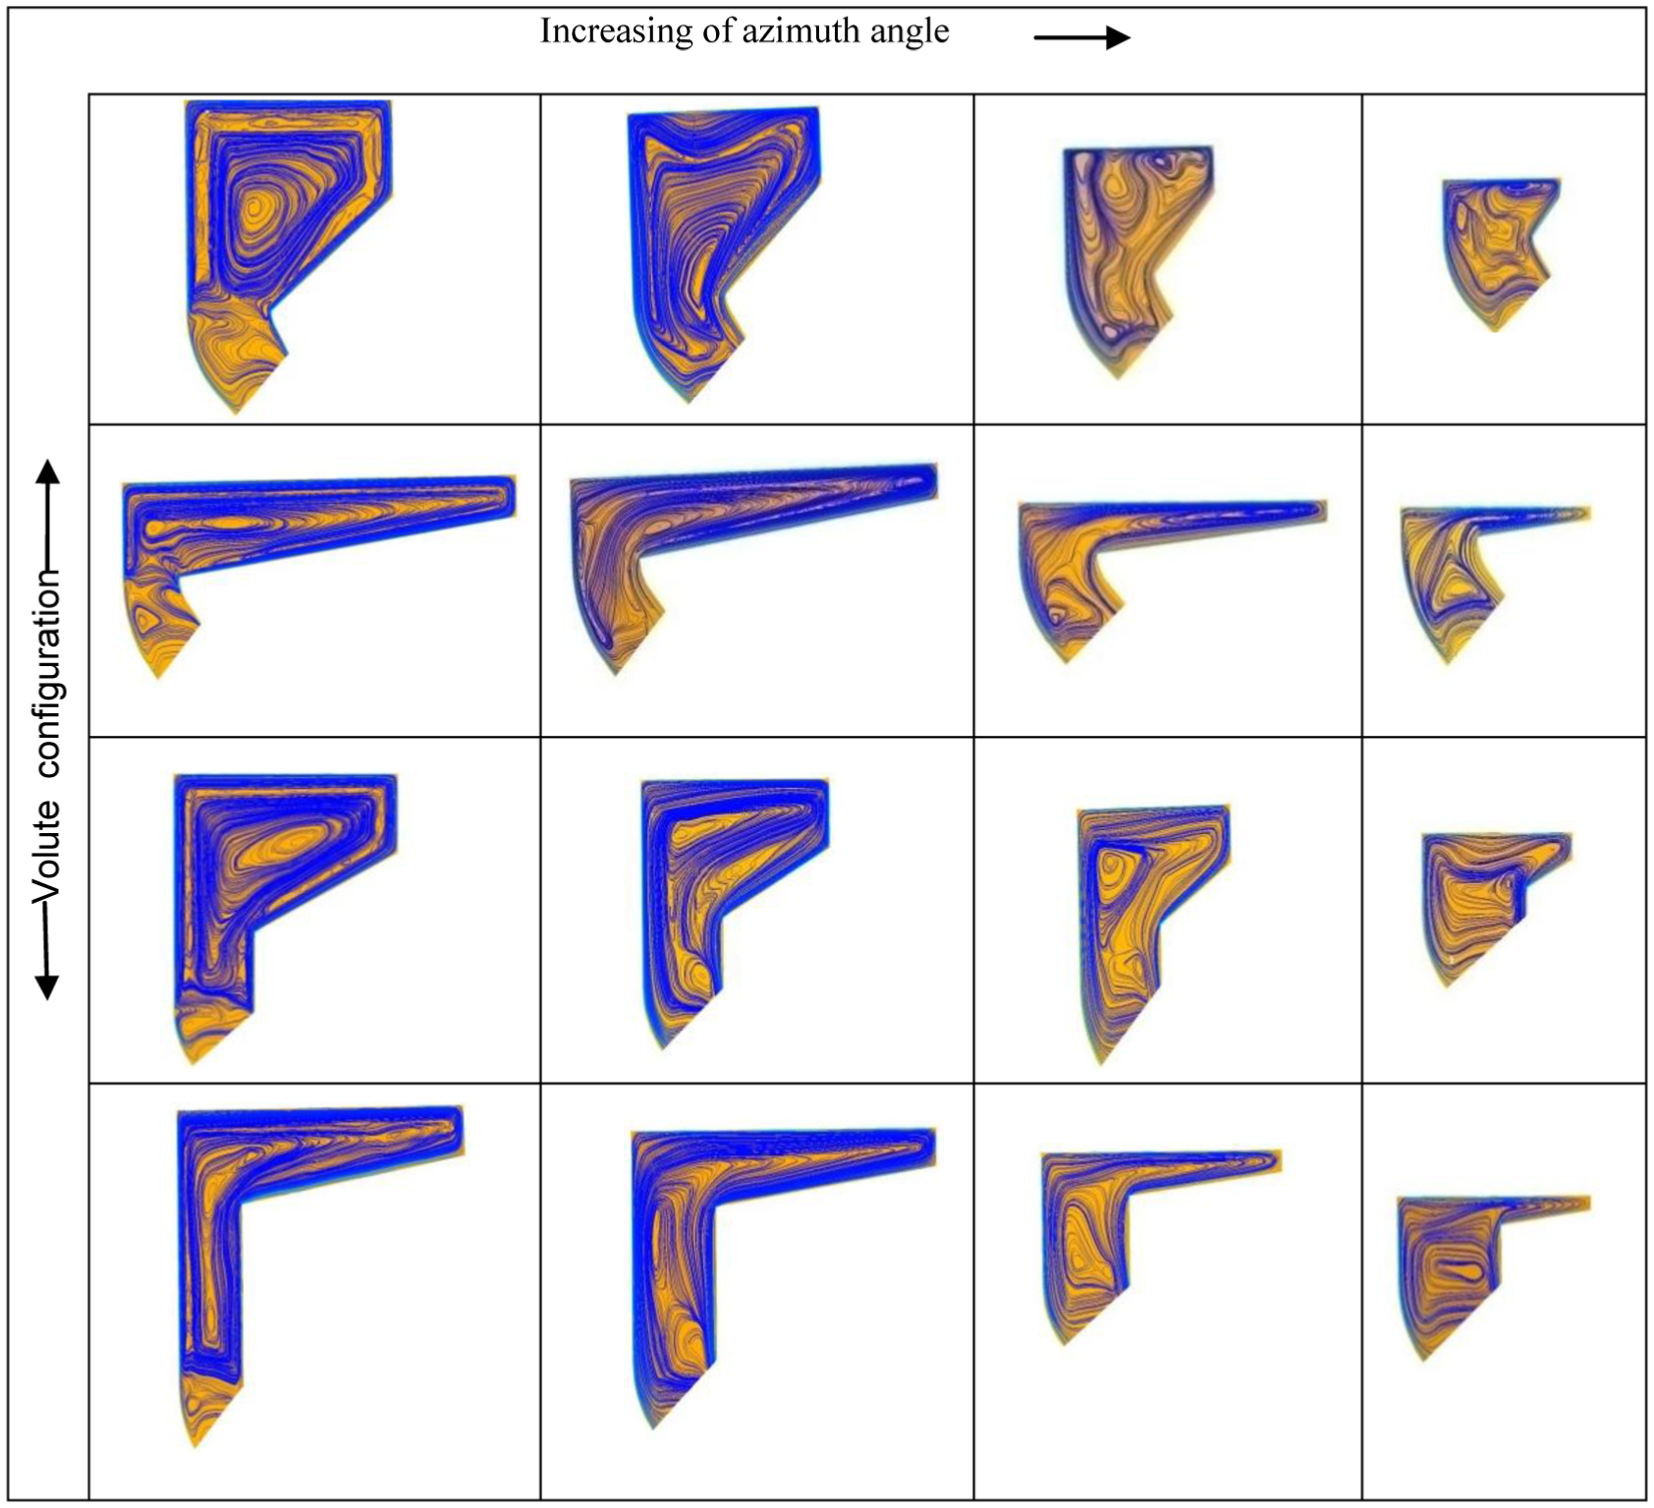
The secondary flow in the cross sections of the four volute configurations at
The fluid flow behavior within the old volute and the other configurations according to the mean streamline
The influence of the convergence with its spiral shape and covered distance on the velocity field is visible in Figure 7; each volute has their characteristics that can give us an insight on the most suitable configuration with the primary perspectives. The acceleration toward the transonic region at the exit area of the volute A is most significant; this increases the expansion ratio by reducing the undesirable effect of the boundary layer thickness. Figure 8 shows that the tangential acceleration of the fluid particles is much higher than the radial acceleration; this observation is propagated throughout the full path within the four volute configurations (old volute and volutes A, B, and C). In the bending duct, a reduction in the radial velocity at the mean radius range r∈ [0.04–0.06] (m) can be noticed, which is compensated by an increase in the tangential velocity, and this is probably due to the strong change in flow direction that has supported toward a bending exit; hence, the flow angle is locally deviated upstream of the exit surface. One can also notice that the shape of the volute A can provide us better acceleration and new characteristics, the advantage for which this form is qualified to be the most flexible on such properties, according to its flat shape and its reduced overall size in comparison with the other geometries.

The variations according to the mean streamline of the Mach number, static pressure, and loss coefficient into the four configurations of the volute shape using two turbulence models: the old volute (k–ε), volute A (k–ε and RSM), volute B (k–ε and RSM), and volute C (k–ε and RSM) are plotted with the solid (black), dash (red), dot (green), dash–dot (blue), dash–dot–dot (gray), short-dash dash (magenta), and short-dot (orange) curves.

The variations according to the mean streamline of tangential and radial velocities and the flow angle into the four configurations of the volute shape using two turbulence models: the old volute (k–ε), volute A (k–ε and RSM), volute B (k–ε and RSM), and volute C (k–ε and RSM) are plotted with the solid (black), dash (red), dot (green), dash–dot (blue), dash–dot–dot (gray), short- (magenta), and short-dot (orange) curves.
In these steady-state simulations, the use of two turbulence models shows the difference observed in the representation of various results. The Mach number and the static pressure distributions along the mean streamline are in good agreement between the two models with a slight difference; this difference becomes more significant when one represents the distribution of tangential and radial velocity as well as the flow angle precisely in the nozzleless duct. The RSM seems to be more accurate and shows a clear sign of precisions and of robustness in comparison with the
Comparison of the four volutes at mean exit area
The development of the boundary layer thickness along the flow direction and the reduction observed in the passage section under the tongue contribute to the flow acceleration in both tangential and radial directions, and this situation allows the creation of a strong wake downstream of the tongue in the volute and at the same time produces a non-uniform acceleration to the outlet in radial direction as shown in Figure 9.

The variation in the Mach number and the static pressure at exit surface into the four configurations of the volute shape using two turbulence models: the old volute (k–ε), volute A (k–ε and RSM), volute B (k–ε and RSM), and volute C (k–ε and RSM) are plotted with the solid (black), dash (red), dot (green), dash-dot (blue), dash-dot-dot (gray), short-dash (magenta), and short-dot (orange) curves.
Also, the geometrical shape of the cross-sectional area and their dimensions play a very important role in the acceleration of fluid flow, but the wide pressure difference occurring between the main flow stream and the recirculation flow amplifies further the wake generated downstream of the tongue region for the four different volute configurations.
The strong intensity of the wake generated also participates on the flow angle deviation after the tongue region; this explains the non-uniformity of flow angle in the mean exit area of the volutes A, B, and slightly with the old volute, in comparison with the volute C which maintained a better uniformity along the circumferential direction. Furthermore, the results obtained from Figure 10 shows a large difference between the simulation results and the analytical values determined from equation (6), and this is probably due to the use of the incompressible approach for dimensioning the vaneless volute. The significant variation in the absolute flow angle values according to the azimuth direction can explain the influence of the overall stator volume as well explicate the linear evolution impact of the previously calculated area–radius ratio (A/r) as shown in Figure 3, and this variation increases with the decrease in the overall volume of the appropriate volute, which provides additional argument about the theoretical results found previously in section 3.1. For the same size and volume (volutes A and B), it can be seen that this variation is slightly regular at exit area of the volute B compared to the volute A; despite the reduced maximum values of absolute flow angle observed at exit area of the volute A, this result is reported to the larger pressure ratio produced by the high expansion occurring within the volute A, thus this configuration has more pressure difference at tongue region which can generate an important strong secondary flow and a considerable zone affected by the wake structure.

The variation in the flow angle at exit surface into the four configurations of the volute shape using the RSM models: the old volute, volute A, volute B, and volute C are plotted with the solid (black), dash (red), dot (green), and dash-dot (blue) curves, respectively.
Rotor–stator interaction
The transition models and the relation between the different movements defined the calculation procedure and the physical behavior of fluid particles through the connecting interface. In this rotor–stator interaction as shown in Figure 4, the general connection interface was used, which is a necessary option in the case when one need to carry out the change of reference frame. The multiple reference frame (MRF) technique is used to take into account the relative movement of the rotational domains, and in CFX, this functionality is based on studies and programs devoted to the rotor–stator interaction. For the rotational domains, there are three types of rotor–stator interaction models; in that case, one have chosen the ‘Frozen rotor’ interface, and in this model, the reference frame technique and/or the pitch varies without the relative deviation of the components across the separating interface.
Unsteady flow simulation
The lack of any effect of the pulsed flow conditions indeed leads to the unfinished prediction of the overall turbocharger performances. The identification of the unsteady pulsations within the mixed inflow turbine, the analysis, or even the description of their influences on the performance require the use of a more appropriate numerical model; several numerical schemes have been developed and applied to this type of regime, according to their complexity. A second-order Euler back scheme is used to discretize the unsteady transition term with a higher precision.
In order to simulate numerically the pulsating flow through a turbomachinery, it is necessary to impose the various hypotheses and the different boundary conditions of the physical domain; in the case of a pulsed subsonic flow at inlet, the instantaneous conditions for the total to static pressure ratio is applied using experimental data obtained from the work done by Chen et al.; they fixed the total temperature and the rotational speed of the rotor for each time step, while at the outlet the atmospheric pressure can be assumed constant during the pulse cycle (refer to Figure 11).

The instantaneous total to static pressure ratio at 50% speed for two frequencies of 40 and 60 Hz are plotted with solid (black) and dash (red), respectively.
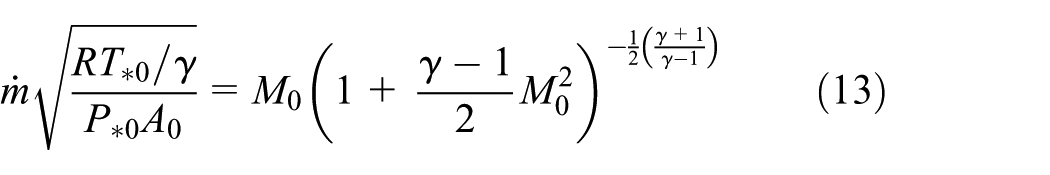
When describing the different performances, and in order to represent the various characteristic curves, it is necessary in this case to use the dimensionless formulations of aerodynamic and thermodynamic quantities, such as the reduced mass flow rate and the pressure ratio that are defined using the following definitions
Reduced mass flow rate
Pressure ratio

Unsteady state results
In order to predict by small uncertainties the unsteady flow performances of the mixed rotor (Table 2) with each volute configurations, and at the same time to give the operational conditions, some simplifications are introduced; for example, it has been assumed that the dimensions of the geometrical form of the inlet duct remained constant, by neglecting the convergence of this canal. The significant volume of the volute requires to take into account the different assumptions about the unsteady effects. However, the filling time through the inter-blade passages within the rotor is very small, and in this situation, the quasi-steady model is specially used. 14
The characteristic results obtained from the unsteady three-dimensional simulation involve the determination of the different values of mass flow rate and pressure ratio in each boundary at the inlet and at the outlet of the turbine for each time step. The variation in the characteristic loops depends on the imposed signal of the pulse pressure wave and the geometrical shape of the turbine components (pipes, volute, rotor) as well as the rotational speed of the rotor; the consequent variations in these influences in a pulsed operation are different, and the goal of such study is to identify separately these various effects using the three-dimensional simulation.
The continuous filling and emptying of the tested volume form a loop curve, indicating the turbine capacity for two used frequencies 40 and 60 Hz, in these curves as shown in Figure 12. The mass flow rate and the expansion ratio follow the evolution of the quasi-steady curve, and the filling capacity varies according to the geometrical shape of the used volute (old volute, volute A, volute B, and volute C), and this property is governed by the overall volume of the pipe (volute with total or reduced nozzleless space).

Mass flow parameter versus pressure ratio at 40 Hz (left curves) and 60 Hz (right curves) with a comparison between the steady-state test data 14 and unsteady state simulation obtained for four configurations (old volute and volutes A, B, and C) at 50% speed are plotted with the dash-dot-dot (Magenta), solid (black), dot (red), dash (green), and dash-dot (blue) curves.
The swallowing capacity of the new configurations has increased compared to the old volute when the values of the mass flow parameter are increased for the same pressure ratio; and this shows the possibility of reaching a higher expansion ratio for a lower mass flow rate. Additionally, the mass flow parameter curves became slightly more flat once the values of pressure ratio are higher enough, and this suggests a significant blockage effect, indicating that the whole capacity of the volume is entirely occupied and the mass flow rate is accumulated within the volute. Near the two operating range limits, it can be noticed that the two curves of filling and emptying are partially combined into a single curve; for low-pressure ratios, the effect of filling and emptying is the main cause; however, when the pressure ratio is high enough, the important role of the blockage contributes well to this effect. Under the pulsed condition case, the interaction effects by combining the rotor and the stator parts are shown on each plot of the simulation results that was indeed observed by the differences between the unsteady performance curves of the three configurations. It is also noticed that during such conditions, the intensity of these fluctuations will define the level of unsteadiness within the tested turbine for both frequencies.
Conclusion
The main objective of this work is to find the most suitable volute cross-sectional geometry of mixed-flow turbines, allowing to achieve a more accelerating flow at exit surface and thus have the maximum mass flow rate, with the higher generated power; in this way, the new modifications of the convergence and the different dimensions are defined and introduced by saving the same old volute cross-sectional area.
The simulated tests lead us to bring out the different observations according to the understanding of the flow structure and enable to compare the results that have been found with the new forms and the results that were observed for the older form. The numerical internal flow analysis showed the number and size of each vortex present within the four vaneless volutes captured at four cross-sectional areas. It has been found that a radial or axial extension of different dimensions can be occupied by one or more vortices depending on the configuration and the adopted flow conditions and that the overall volume plays an important role in decreasing the number of vortices through the flow passage.
The reduction in the cross-sectional area under the tongue will contribute in one hand to the acceleration of a part of the flow re-injected into the volute inlet and on the other hand to accelerate and direct the flow ejected toward the outlet area, and this allows to generate the wake and losses downstream of the volute; therefore, a deviation from the main path and the main streamlines furthermore increases the pressure ratio that will also contribute to increase the wake influence on turbine performances.
The better performances have been occurred with the flat volute A and slightly with the volute B, which achieve a significant Mach number values at exit area and then reach the highest swallowing capacity at non-steady-state case. In comparison with the other configurations, the expansion ratio achieved by these two geometries creates a large wake region generated downstream of the tongue, which has an undesirable effect on the uniformity of the exit flow angle.
The characteristic curves corresponding to the pulse operation mode take a shape of the closed loop, and the size of this loop and their variation are based on the pressure wave signal at the inlet, and the frequency of the total volume of volute plays the most crucial role. By analyzing the different results, it can be seen that the evolution of characteristic curves of the mass flow rate do not contain significant fluctuations, while a continuous filling and emptying process is maintained.
Footnotes
Appendix 1
Academic Editor: Ming-Jyh Chern
Declaration of conflicting interests
The author(s) declared no potential conflicts of interest with respect to the research, authorship, and/or publication of this article.
Funding
The author(s) received no financial support for the research, authorship, and/or publication of this article.