
Abstract
This article proposes a machine learning–based travel mode detection method using urban residents’ travel routes as the data source, collected via smartphone global positioning system modules. A data-driven machine learning strategy was chosen in the model construction. This study performed data cleaning and mining on over 4400 pieces of urban resident travel records containing several millions of global positioning system tracking points. Series of characteristic values of speed, travel distance, and direction are calculated, which reflect the travel mode of smartphone holders. In travel mode identification, first, the transition regions of travel segments of different travel modes are effectively distinguished; then, continuous tracking points for single-mode travel are connected into single-mode travel segments. The travel mode of the surveyed subjects is identified based on the calculated features of average speed, average acceleration, and average change of direction within each single-mode segment. The random forest method is chosen as the basis model to classify travel mode. Three-quarters of the travel records were used to construct the random forest classifier, and the detection accuracy of the established model for the remaining ¼ of the travel record reached 94.4%. The proposed method uses massive smartphone global positioning system tracking points as the basis; the detection results are consistent with manually collected prompted recall survey records.
Keywords
Introduction
The popularity of smartphones laid the foundation for the development of cell phone global positioning system (GPS) traveling surveys. By utilizing cell phone GPS for travel surveys, huge amounts of travel data can be obtained that realistically reflect people’s increasingly complex travel patterns and satisfy the demands of complex models in the big data era. Compared with traditional travel surveys, with or without computer assistance, GPS-collected data are more complete and comprehensive, with low misreporting and false-reporting rates,1–7 and they can, to a great extent, lower the burden on the survey subject and survey cost.1,8–14 Many achievements have been made using GPS tracking data thus far. However, because of the limitations of earlier GPS devices, the sample size is usually small, and the sample density is usually sparse. 15
In 2004, Asakura and Hato 16 first used cell phone positioning functions to collect individual travel path data, obtained high-quality positioning data, and proved the feasibility of using smartphones for travel surveying. Thereafter, further studies were conducted, represented by Naphade, Douma, Gonzalez, and Stenneth in the United States and by Nitsche and Bierlaire in Europe, and the smartphone-based travel survey method became more mature.10,17–19 WiFi, Global System for Mobile (GSM), and accelerometer data collected by other cell phone sensors are also broadly used.20,21 L Shen and PR Stopher analyzed the impact on trip-end identification of different GPS signal sampling intervals and signal disappearance times. The results indicated that the accuracy of trip-end identification was highest when the GPS signal sampling interval was 5 s and the signal dwell time was 60 s. 22 H Safi et al. used a smartphone application, Atlas, for travel surveying and compared the survey process and results against online travel surveying and handheld GPS travel surveying. They discovered that smartphone-based travel surveying places the least burden on the survey subjects, the quality of the survey data is better, and the survey completion rate is higher. 23
The GPS devices, including GPS modules of smartphones, can only record a series GPS positioning points during the travel, and other meaningful information such as trip ends, travel modes, and purposes cannot be obtained directly from the GPS data.24,25 To obtain the above information, prompted recall (PR) survey is usually conducted. However, the smartphone-based GPS data can easily collect thousands of or even more trips data in a very short period, while the manual PR survey cannot fully cover the more and more GPS data.
Thus, identifying travel modes solely from the large-scale GPS data becomes essential technique in current travel behavior studies. After data cleaning and primary analysis such as trip-end identification, 26 most of previous studies set certain conditions and rules to identify the travel modes. These rules and conditions are usually based on transportation surveys accumulated in the past and are closely related to geographic location, local city road conditions, transportation regulations, and resident living habits for the obtained data, in other words, subjectivity and arbitrariness. Lacking of universality, these rule-based methods are difficult to be applied to other research or practice scenarios.
To resolve the abovementioned problems, this article proposes a new data-driven method for travel mode detection. Specifically, the travel mode detection contains five major steps: (1) features of GPS points such as speed, acceleration, and direction are calculated; (2) PR survey data are input as a reference into the machine learning model to train the classifier, enabling it to recognize the transition points between different travel modes; (3) the continuous GPS tracking points are divided into single-mode travel segments; 26 (4) features of the single-mode travel segments are calculated; and (5) a travel mode classifier is constructed from training samples. The proposed method can reduce subjectivity interference as much as possible and summarize/reflect the intrinsic features of the massive data. This article uses the random forest model as a basis classifier. 27 The model is a data-driven and non-parameterized method that has good robustness, avoids over-fitting, and satisfies the accuracy and performance requirements of this study. The method relies more on the knowledge mined from the data, rather than on traditional experiences, which is consistent with the trends of the big data era. 28
Data description
Data collection and format
In this study, the GPS travel survey data are collected in Shanghai, China from 2014 to 2015. The tracking data are recorded by GPS modules in volunteers’ smartphones. In preparation, all the volunteers are requested to fill in a short questionnaire, which includes some questions about their socio-economic information. The GPS tracking is started before the volunteers leaving home in the morning and ended after the volunteers finally arrives at home. In this way, all the GPS tracking points of volunteers within the whole day are collected. After one day’s data collection of a volunteer, an interview on the telephone is conducted by trained interviewers to verify the derived travel information of the day. Each volunteer is requested to take part in the survey for at least 5 days.
Continuous GPS tracking data of smartphone holders is recorded based on self-developed Android/iOS smartphone GPS software (Figure 1). A Web-based survey platform is designed to store GPS data and collect static data such as the socio-economic attributes, demographic features, and recurring locations of the surveyed subjects.

GPS positioning software for different smartphone operating systems: (a) a screenshot of the android application and (b) a screenshot of the iOS application.
The tracking collection software installed on the smartphones of the survey subjects collects GPS tracking information including user ID number, positioning time, latitude, longitude, and altitude. The user ID number is the serial number of the smartphone owner corresponding to the relevant sampling tracking points, and positioning time/coordinates is the time and spatial coordinates of a GPS tracking point, which are the basic information in GPS data collection.
This study recruited 459 volunteers by online and on-site methods and collected a total of over 17 million pieces of GPS tracking data for 3766 total days. Among the volunteers, 360 provided socio-economic information. A total of 318 volunteers participated in the PR survey. 29 As an important supplement to the GPS tracking data automatically collected via smartphone software, the PR survey data, including starting/ending time, starting/ending point, travel mode, and travel purpose, were manually verified based on the GPS tracking data. Since in this study, the PR survey records is used as the ground truth in model training, the manual curation is able to correct misreporting and false-reporting by the surveyed subjects.
A total of 288 volunteers both provided their family socio-economic attributes and participated in the PR survey. The PR survey of these volunteers recorded a total of 14,702 “travel/activities,” where travel refers to when a surveyed subject is in a mobile state, and the corresponding tracking points are called “mobile points”; activity refers to when a surveyed subject is in a state of working or resting, and the corresponding tracking points are called “stationary points.”
Data cleaning
In the continuous process of collecting position information on the surveyed subjects based on the GPS model installed in smartphones, the following factors might induce interruption or error in the GPS collection process and generate invalid data records: unstable GPS signal, surveyed subjects entering no-signal or weak-signal regions (such as underground), and low phone power or high load. Thus, the raw data must undergo a cleaning process to filter out incomplete and erroneous data records before the GPS tracking data can be used for any study.1,2,26,29,30
Based on the actual condition of the GPS tracking data collection and raw data analysis, combined with the practical requirements of the travel mode detection, this article cleaned the raw data by deleting the following: (1) GPS tracking points of the surveyed subjects not in a traveling state; (2) GPS tracking points missing spatio-temporal positioning information; (3) GPS tracking points with no or incomplete PR survey record information; (4) GPS tracking points that were not located in the area of Shanghai, China; (5) GPS tracking points with an instantaneous speed that is not consistent with common sense; (6) GPS tracking points in low sampling rate regions; and (7) GPS tracking points corresponding to a traveling period shorter than 240 s.
The valid data after cleaning include 271 surveyed subjects, a total of 1630 days (average of 5.8 days per person), and a total of 3593 travels (average of 2.2 travels per day). These travels include 4454 single-mode travel segments. There are in total 2,617,789 tracking points; each single-mode travel segment contains an average of 588 tracking points, and the average travel time is 1421 s. These single-mode travel segments include six travel modes, namely, walk, bicycle, e-bicycle, car, bus, and subway. The number of segments, average number of tracking points, and average travel duration for each mode are listed in Table 1.
Basic information on travel mode data.

Methodology
Basic strategy
This article treats the PR-surveyed travel information as manually verified reliable results, but not as the starting point of data analysis. The raw GPS tracking data do not contain the starting and ending point information of each travel or information on the transition between different travel modes. 30 Thus, travel mode detection includes two main parts: single-mode travel segmentation and travel mode identification.
As shown in Figure 2, this article first calculates 24 traveling tracking point features from the cleaned data, including collection time, coordinates of collected tracking points, instantaneous speed, and instantaneous acceleration. For every tracking point, this article calculates the spatio-temporal relationship among the few tracking points before and after the point in the temporal sequence to assess whether the features of these tracking points are similar. A machine learning model is used to identify the tracking points with large differences in features from the points before and after them as transition points between different travel modes.
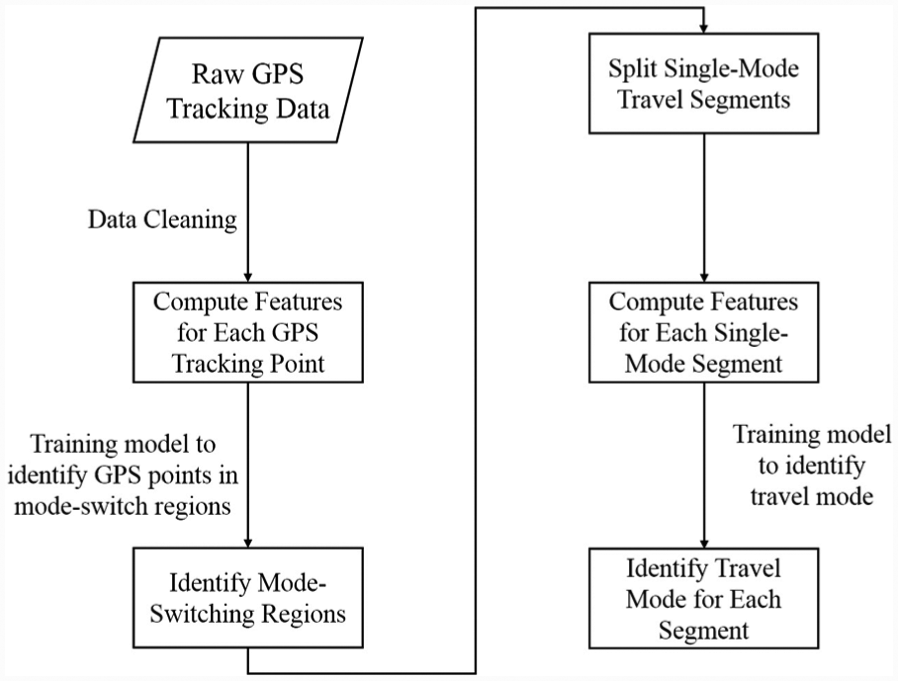
Global strategies.
After the identification of transition points between travel modes, the continuous GPS tracking data can be divided into different single-mode travel segments. The features such as the speed, acceleration, direction, and activity range of the surveyed subjects in each single-mode travel segment were calculated to re-train the machine learning model and recognize each travel mode.
Every single-mode travel segment is subdivided; this article treats the first and last 10 tracking points as the travel mode transition region and treats other points as non-transition regions, together forming the training sample set. In the travel mode identification stage, ¾ of the single-mode travel segments are used as the training sample set and the other ¼ as the testing sample set.
Feature selection and calculation
In a field-oriented application of machine learning method, feature selection is more important than specific model choice or some slight model improvements, because the selected features must reflect the essential laws of the field.
In this study, the proposed travel mode identification method tries to avoid setting subjective rules and conditions that could interfere with the results. However, this avoidance does not mean the negation of common sense, experience, and basic traffic theories. On the contrary, the machine learning model–based identification method fuses common sense, experience, and basic traffic theories in the construction process of the classifier more objectively and scientifically. The trained machine learning model not only can reflect properties and information mined from the training sample data but also is consistent with common sense, experience, and traffic research results to date, as well as basic traffic theories and knowledge. During this process, the contribution of common sense, experience, current research results, and basic traffic theories to the construction of the model is mainly concentrated in the aspects of feature selection and calculation. The rationality of feature selection and feature calculation efficiency determines the accuracy and performance of the model.
The information of the average speed, average acceleration, direction, and tracking-point congregation degree of a surveyed subject for a segment of continuous tracking points represents the movement state of the surveyed subject in the corresponding tracking region, providing important features for judging the travel mode. 26 In this study, the search for different single-mode travel segmentation points requires judging whether the segments before and after a candidate tracking point in a temporal sequence belong to different travel modes; this judgment also relies on the abovementioned features.
The GPS tracking data record is a series of time–space coordinates of the surveyed subjects; every record only includes the tracking point attributer’s coordinates at that particular moment. The features of the surveyed subject in any single-mode travel segment must be calculated from the time and coordinate information of every point in the segment. Among these features, the five basic features of distance between two tracking points, time difference, direction, speed, and acceleration are the foundation of each single-mode travel segment feature, and the calculation method is as follows.
Let Ti be the sampling time of tracking point pi in the single-mode travel segment, Ei be the longitude of pi, and Ni be the latitude of pi. Let R be the radius of the earth, R = 6,371,000 m; the above are known data.
Then, denote the distance between tracking points pi and pj as di,j, in units of meters 31

in which φ1 = (90°−Ni)·π/180°, φ2 = (90°−Nj)·π/180°, and Δλ = (Ej−Ei)·π/180°.
Denote the time difference between tracking points pi and pj as ti,j, in units of seconds

Denote the instantaneous speed of tracking points pi as vi, in units of meters per second

Denote the direction between pi and pj as the acute angle formed with the north/south direction, Ai,j, in units of degrees 31

in which φ1 = (90°−Ni)· π/180°, φ2 = (90°−Nj)· π/180°, and Δλ = (Ej−Ei)·π/180°.
Denote the direction between pi and pj as the angle formed with the north direction,

when Ei = Ej and Ni = Nj, the surveyed subject is not moved, let
Denote the acceleration of tracking point pi as ai, in units of meters per second squared

Based on the above basic features and according to the requirements of different travel modes, this article uses five sets of 24 features to depict the different travel modes of the surveyed subjects in single-mode travel segments. These features include the following: (1) the speed distribution features, (2) the global and extreme value features, (3) the acceleration distribution features, (4) the stoppage features, and (5) the direction changing features of the travel segment.
The first set of features consists of speed-related features, which is the most obvious feature for distinguishing travel mode. In practice, this study uses 95% quantile speed in the travel segment instead of the global maximum instantaneous speed, which helps to reduce the impact of data error on the classification accuracy. Average speed, speed standard deviation, and each speed quantile reflect the speed distribution of a surveyed subject in each travel segment, including 95%, 75%, 50%, and 25% quantile speeds.
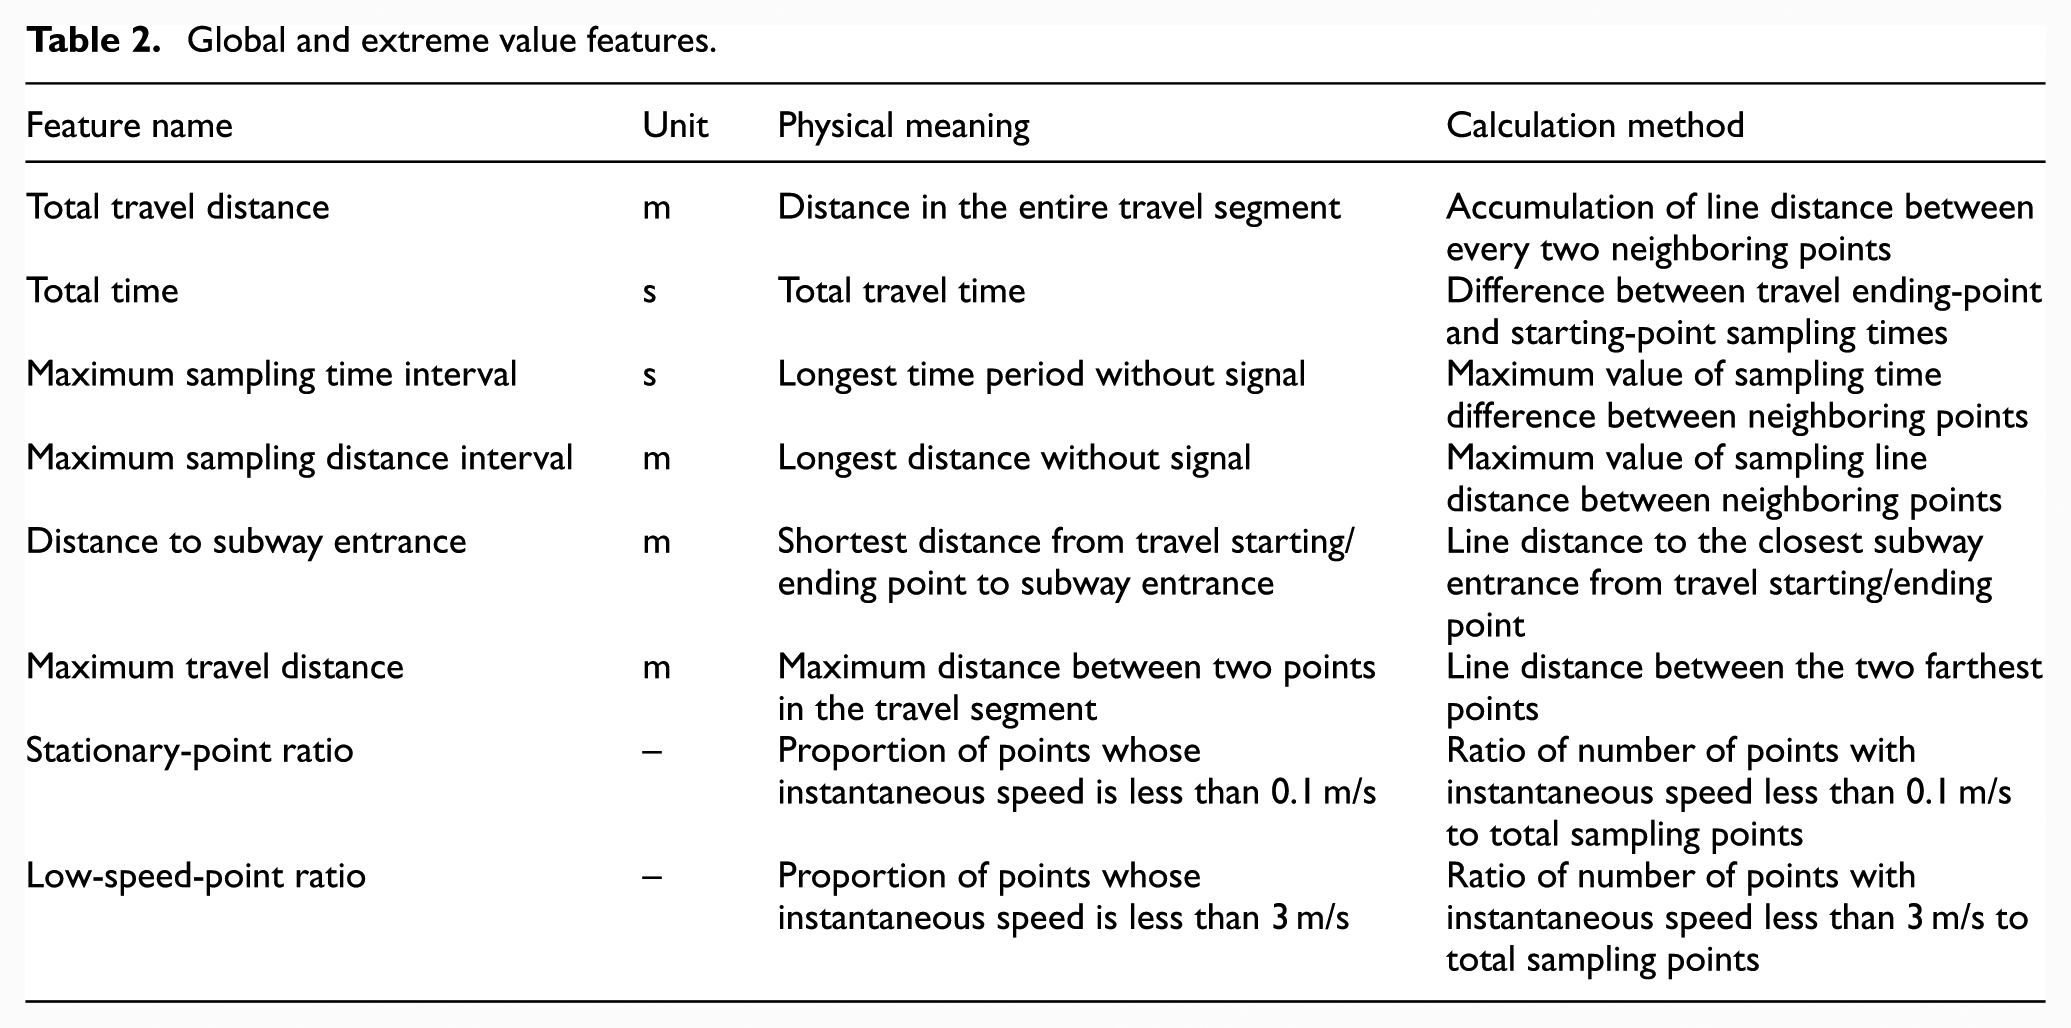
The second set of features consists of global and extreme value features. These features reflect the temporal and spatial sampling distribution of the GPS tracking points in the entire travel segment. Among these features, the maximum sampling time interval and distance usually reflect the signal-loss properties of subway travel or the urban canyon zone. The stopping point ratio can reflect the time proportion the surveyed subject spends in a stationary state. The low speed ratio reflects the time proportion of the surveyed subject in a low-speed state during the travel segment. The maximum travel distance reflects the activity area of the surveyed subject during the travel segment. Table 2 lists the meaning and calculation method of each feature in the global and extreme value feature set.
Global and extreme value features.
The third set of features used in this article consists of acceleration-related features, including average acceleration and acceleration at the 95%, 75%, and 50% quantile points. Acceleration features reflect the degree of change in instantaneous speed, which can effectively distinguish a tracking point state in an automobile travel region from a non-automobile travel region. This ability is especially useful in a traffic jam situation, where the surveyed subject would have a low speed and time spent stopped in a relatively small region. From the perspectives of average speed, low-speed-point ratio, and total travel distance, a traffic jam is difficult to distinguish from a walking travel region, but the acceleration features of starting and stopping an automobile can indicate the difference quite well. Moreover, this article only considers the absolute value of acceleration in practice, that is, it does not consider the difference between acceleration and deceleration, only the magnitude of acceleration/deceleration.
The fourth set of features comprises the stoppage features. Regardless of traveling in automobile or non-automobile mode, urban travelers will inevitably encounter situations of random stoppage such as being stuck in a traffic jam, waiting for traffic-light signals at intersections, or waiting at bus stops. Different travel modes typically have different stoppage frequencies and durations. This article uses the statistics of the occurrence frequency of different stoppage durations as the stoppage features of a travel segment, including number of stoppages within 0–5, 5–15, 15–30, 30–60, and above 60 s, per kilometer. These stoppages describe the frequency of short, medium, and long stops in a single-mode travel segment. The total numbers of them are obtained from the statistics of the stoppage time in the travel segment and then divide by the travel distance of the segment for normalization.
The fifth set of features in this article, the direction change features, only considers the features of average direction change in the travel segment to reflect how often the direction changed in the travel segment of the surveyed subject. Generally, changes of direction in walking or bicycling are more random and frequent, while automobile travel must follow routes, and the average direction change is smaller. To obtain the average direction change feature, the instantaneous directions formed by neighboring tracking points are calculated first using equations (4) and (5). The differences between directions of a neighboring pair of points are the direction change. Then, we take the average value of the direction change in the entire segment.
To sum up, although there is no explicit rule applied in the modeling process, a total of 24 features covered the speed distribution features, the global and extreme value features, the acceleration distribution features, the stoppage features, and the direction changing features of a travel segment will be integrated in the constructed model by training. Thus, the data-driven method is not only consistent with common sense, experience, current research results, and basic traffic theories but also more powerful, more comprehensive than the existing rule-based methods.
Selection and application of classifier
Although in this article, we focus on the global strategy to develop the machine learning-based framework for travel mode identification, and do not intend to discuss classifier selection in detail. The random forest 27 model is a data-driven, non-parametric classification method, with very few parameters necessarily to be assumed based on prior experience. The model obtained from training has good interpretability, which is consistent with the purpose of this article in discovering the travel features and modes of residents based on massive GPS tracking data.
Besides, this article calculates five sets of 24 features for each single-mode travel segment as the input to the classifier to obtain the six classification results of walk, bicycle, e-bicycle, car, bus, and subway travel. There remain a few data points containing errors after the data cleaning. Due to the limitations of the PR survey, there are also some erroneous registered records in the training sample set. Moreover, to describe the speed/acceleration distribution in the travel segment, this article used multiple speed/acceleration quantile points simultaneously as sample features; obviously, the selected features show a certain correlation. The random forest method can also well address the above sample noise, incorrect registration and feature correlation problems, which are very difficult to be solved by the rule-based methods.
The random forest method was proposed by Breiman et al. 32 in 2001 and is an integrated learning model using a decision tree as the basic classifier. The integrated learning strategy of random forest is to select a random training sample for each decision tree, giving the method a good tolerance for abnormal values and noise. It can effectively resolve the problem of over-fitting and is insensitive to data error and classification registration error. Through random selection of the feature set, the random forest method is also insensitive to the correlation between features.
In a nutshell, comparing to other machine learning methods, such as linear discrimination method, Bayesian methods, simple decision tree, artificial neural network (ANN), or support vector machine (SVM), the random forest model is able to solve non-linear problem, requires few prior knowledge, is insensitive to noise, abnormal values, and correlated features, and is well interpretable. These advantages make the random forest model very suitable for our study. Besides, the parallel computation can be easily applied to the random forest model, which make it provides a better performance than other methods.
Results and discussion
Single-mode travel segmentation results
The samples in this article contain 3593 travels, of which 687 are multi-mode travels, including 1548 single-mode travel segments. Every multi-mode travel contains two-to-five single-mode travel segments; the remaining 2906 travels are single-mode travels.
This study uses travel transition points containing the travel mode registered in the PR survey and a few neighboring tracking points as positive training samples (transition points) and uses a few random tracking points far from the transition point in each single-mode segment as negative samples (non-transition points) to train the random forest model. Then, this study uses the trained model to recognize transition points for travel modes and divide single-mode travel segments.
The proposed method can correctly recognize 97.9% of the travel mode transition points (sensitivity). Due to the continuity of GPS tracking points, the region near a travel mode transition point can be recognized as transition point in practice. Among all travel mode transition points recognized by the proposed method, 73.2% are located within 15 s of the transition point registered in the PR survey, while 85.3% are within 30 s. In further experiments, we tried to reduce the area of the recognized travel mode transition region and to decrease the false-positive rate. When the travel mode transition region recognized by the random forest model was modified to 60% around the center, over 90% of recognized travel mode transition points were within 30 s of PR survey–registered transition points. However, only 88.3% of the (PR survey–registered) travel mode transition points could be correctly recognized.
The single-mode travel boundary registered in the PR survey might not be completely accurate; thus, this study not only selected accurate single-mode travel segment boundaries as the positive training sample but also allowed certain errors in assessing detection accuracy. First, the transition of the travel mode of surveyed objects is a process; in the follow-up telephone interview, the surveyed subject could identify any tracking point between “arrived at platform” and “got on the bus” as the travel mode transition point. Second, the surveyed subject might not be able to accurately remember the time he or she got on the bus to the second. In other words, generally speaking, we can view the PR survey registration as accurate; but in practice, the transition point registered in the PR survey along with a few neighboring tracking points could all possibly be the actual travel mode transition point.
Travel mode detection results
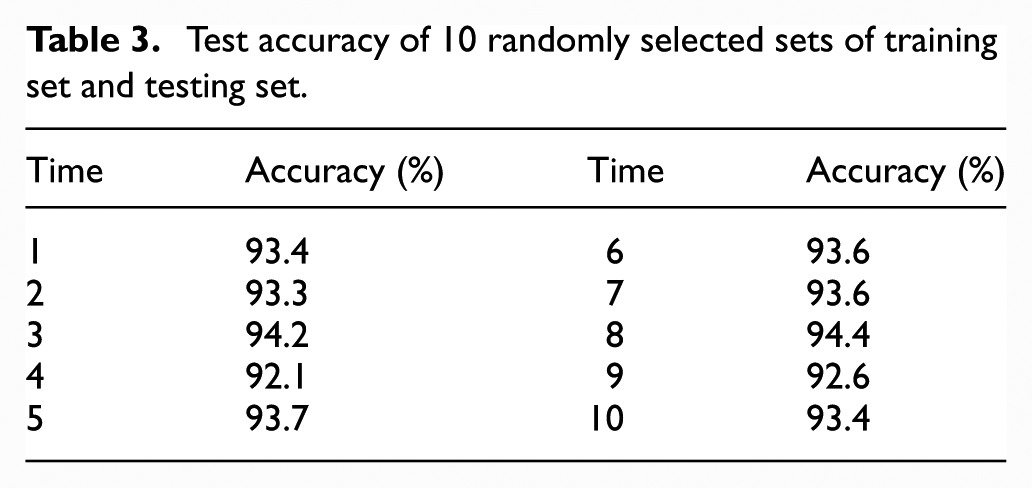
This study randomly selected ¾ (3340) of the single-mode travel segments as the random forest model training sample set, and the other ¼ (1114) were used as the testing set. As shown in Table 3, this study randomly selected the training set and testing set 10 times according to the above method. The detection accuracy of the trained random forest model for the testing set can exceed 92%, with the highest reaching 94.4%.
Test accuracy of 10 randomly selected sets of training set and testing set.
This study uses the 10th detection result for further analysis. Figure 3 shows the confusion matrix of the travel mode detection results. Due to the obvious distinction in speed and maximum time interval features, the detection accuracies of subway and walking travel are the highest, reaching 98.3% and 97.8%, respectively. The car travel mode and bus travel mode remain easily confused; the detection accuracies of the two are 90.2% and 84.4%, respectively. Approximately 8.3% of car travel was identified as bus travel, and approximately 11.1% of bus travel was recognized as car travel. At the same time, 9.3% of e-bicycle (four instances) travel was wrongly recognized as bus travel. This type of erroneous detection usually occurs in a single-mode travel segment with a high low-speed-point ratio and a high stoppage frequency; it is speculated that the travel may have occurred during the high-traffic period and along routes with traffic jams, leading to indistinguishable features.

Confusion matrix of travel mode detection results.
Detection results and contribution of each feature set
This study used five sets of 24 features in total as the input to construct the travel mode detection model based on the random forest method. To examine the detection results of each feature set, this study first used an individual feature set to identify the travel mode. In identifying the state of each individual tracking point, the best results are from set 2 (global and extreme value features) and set 1 (speed distribution features); the detection accuracy from both groups reached approximately 87%. Set 4 (stoppage features) can achieve 72% accuracy in travel mode detection. The individual detection abilities of set 3 (acceleration distribution features) and set 5 (direction change features) are quite low, but the detection accuracy in terms of the six travel mode classification can still reach 58.4% and 52.4%, respectively. The above results proved that the five sets of 24 features selected in this study can all effectively recognize different travel mode to a certain degree.
To further examine the role of each feature set in travel mode detection when they are simultaneously entered into the model, this study uses the mean decrease in the Gini coefficient in the random forest model to assess the contribution of each feature set in the model construction. The mean decrease in the Gini coefficient is used to calculate the influence of each feature on the heterogeneity of the observed values of every node in a decision tree through calculation of the Gini coefficient and thus to compare the importance of the features. In the training process, when using a feature to group the node data, a larger decrease in the heterogeneity of the observed values means a better result of that feature in distinguishing sample classification, indicating that the feature is more important.
Figure 4 shows the contribution rates of each feature set in the model construction, calculated according to the mean decrease in the Gini coefficient. Among all feature sets, the speed distribution feature set has the largest contribution, followed by the global and extreme value feature sets as well as the stoppage feature set. The contribution of the acceleration distribution feature to the model construction is relatively low, and the contribution of the direction change feature is even lower. The results in Figure 4 are basically consistent with the results from using an individual feature set to recognize the states of tracking points. This finding proves that each feature set contributed to model construction and increased the accuracy of travel mode detection to a certain degree; among all feature sets, the speed distribution set and global/extreme feature set contributions are the highest.

Contribution of each feature set to travel mode detection.
Conclusion
This study used massive GPS tracking data to examine and achieve a random forest–based travel mode detection method, obtained as high as 94.4% overall detection accuracy, and conducted an in-depth discussion of feature selection. The main conclusions are as follows.
Based on the analysis of the data collection process and the raw data, this article proposes seven data cleaning rules: the massive smartphone GPS tracking data were cleaned according to the research requirements of travel mode detection.
This study takes the random forest model as the core and proposes a data-driven method for travel mode detection. Based on existing study results and the literature, this study proposed five sets of 24 identification features for travel mode detection, assessed the individual performance of each feature set in travel mode identification, and assessed the contribution ratio of each feature set in the construction process of the random forest-based model. Among all feature sets, the contribution of the speed distribution feature set is the highest, followed by the global and extreme value set, stoppage set, acceleration set, and, finally, direction change set. However, lacking of any set of features will lead to an accuracy reduction, which indicates all sets of features do contribute to the travel mode identification.
This study used the machine learning model to identify travel modes. The results indicate that the big data–based model construction not only achieved a detection accuracy up to 94.4% but also maintained basic stability in multiple random selections of training and testing sets. This finding indicates that the proposed method has good consistency among different travels and different surveyed subjects. Compared with traditional rule-based methods for travel mode detection, the proposed method is more objective, intuitive, and convenient. And in contrast to the rule-based methods previously used to identify travel mode, the random forest–based method requires no empirical classification criteria, but rather, the self-learning and construction of the model are data driven.
Smartphones become more and more prevalent in recent years, enabling large-scale transportation surveys based on GPS modules of smartphones. These surveys will produce huge amount of data. To apply these data in residents’ travel behavior studies, manual PR verification is no longer capable. Machine learning based methods which can automatically mine travel information such as travel mode solely from the GPS data are essential basis in future transportation research. This study creates a paradigm of the new methodology.
Footnotes
Academic Editor: Tao Feng
Declaration of conflicting interests
The author(s) declared no potential conflicts of interest with respect to the research, authorship, and/or publication of this article.
Funding
The author(s) disclosed receipt of the following financial support for the research, authorship, and/or publication of this article: This research was supported by National Natural Science Foundation of China (51278301, 51478266, and 51405075).