
Abstract
In this study, the theoretical and experimental study of a cross-flow heat exchanger is carried out based on the theory of porous media under low Reynolds number. The accuracy of the mathematical calculation model is verified by experiments. Pressure drop in air side and efficiency of heat exchanger are analyzed with mathematical models of various non-uniform air flows under low Reynolds number. The responses are found influences of air flow non-uniformity on pressure drop and efficiency of heat exchanger have certain rules. The difference in pressure drops between non-uniform air flows and evenly distributed air flows is linearly related to variance
Introduction
With the increasingly stringent vehicle-emission regulations and miniaturization and module of new engine design, the power density and energy efficiency of engines have changed. In addition, with large-scale promotion of new energy vehicles, such as bioenergy, electrification, and fuel cell, the cooling system for dynamic and control system of vehicle is required to be re-designed and validated.
Cross-flow heat exchangers, as the key components in cooling systems, are widely used in vehicles, such as radiator, intercooler, and condenser, owing to their traditional advantages, which contain compactness, lightness, high efficiency, and so on. 1
As the demand for reducing the size and weight of vehicles continues to grow, smaller and lighter cross-flow heat exchangers have been studied. Meanwhile, the more important is the need for further improving the air-side thermal and hydraulic performance, which are usually impacted by construction, material, inside, and outside fluid of heat exchange.
For improving the efficiency of heat exchanging, various different fin structures have been applied to heat exchangers. Many studies suggest that air-side resistance and heat transfer performance of heat exchanger are strongly influenced by fin structure, fin pitch, and number of tube rows. Dong 2 and Dong and Chen 3 studied in detail various types and sizes of cross-flow heat exchangers. And the experience formula for characteristics of pressure drop and heat transfer was given.
Besides these factors, air flow non-uniformity also can result in degradation of heat transfer and hydraulic performance. For the convenience in design of vehicle cooling system and theoretical calculation for heat exchange, it is often defaulted that outside air flow distribution is uniform and inside coolant is also uniformly distributed into all filled tubes. And in the design process of cooling system, the performance data of heat exchange is obtained in the laboratory condition, which usually can provide uniform distribution of air flow.
However, in practice, the uniform distribution of air flow is generally not realistic in actual conditions. There are several reasons that induce non-uniform distribution. One is the complex structure of engine compartment and the front grill of vehicle lead to non-uniform air resistance of cooling system and air condition system. The other significant cause is the axial fan, which is the major air flow source for forced convective heat transfer of cooling, is adjacent to heat exchanges. Thus, the non-uniform distribution of air flow is inevitable.
Comparing with the flow non-uniformity in the tubes,4–8 the researches about external air non-uniformity and its effect on thermal and hydraulic performance of heat exchanges were less investigated. Chiou9,10 developed a new mathematic model, which was used to evaluate heat transfer of condenser with flat tube and plain fin. In his study, it was found that heat transfer performance was seriously impacted by non-uniformity of air flow. His model was of larger value in design of heat exchangers. Berryman and Russell 11 studied the influence of non-uniformity of air flow on a cross-flow heat exchanger with forced convection. It was found that air flow would decrease by 10%–20% owing to the non-uniformity, which was caused by the fan. Rabas 12 set up an air flow non-uniformity model in an air-cooled cross-flow heat exchanger and investigated its effect on the complex heat transfer coefficient, which was proportional to 0.6 power of quantity of flow in his conclusion. Kærn et al.13,14 studied the non-uniformity of cold and hot fluid in evaporator with numerical method. And he found that air non-uniformity was the main effect on the deterioration of refrigerating capacity and coefficient of performance (COP), instead of refrigerant. Kærn et al. 14 carried out a research about the influence on the performance of heat exchangers under air flow misdistribution.
Some useful conclusions have been obtained in previous researches of flow non-uniformity effect on thermal-hydraulic performance in heat exchangers. However, it should be noticed that most of investigations only about the effect of non-uniformity inside flow in the tubes, such as the non-uniformity of incoming fluid velocity and temperature effect on thermal and hydraulic deterioration. Moreover, in aforementioned investigations, it also reflects that the air-side velocity distributions have respective features, which are affected by their own systems and structures. The objective of this study is to combine theory and experiment for investigation on the effect of various air flow non-uniformity. And for eliminating the influence of distribution patterns, it is tried to get the influence rule of the air non-uniformity effect on heat exchanger with variance
Mathematical model
Many studies suggest that air-side resistance and heat transfer performance of heat exchanger are strongly influenced by fin structure, fin pitch, and number of tube rows, which make it difficult to get accurate heat transfer area of heat exchanger.2,3,15,16 Whatever be the kind of heat exchanger, fin structures between tubes are designed to periodicity or symmetry. Hence, in many studies on fin of heat exchanger, it is only chosen partial fin structure as research model. But in order to simplify model, cross-flow heat exchanger is often simulated by means of a porous media model, especially involving a cooling system research.17–20
Owing to the study about air flow non-uniformity of cross-flow radiator, it is tried to avoid the ideas before to investigate the interior structure and material of radiator. Instead, the coefficient of heat transfer based on windward area of cross-flow heat exchanger is proposed. And this coefficient will be applicable to cross-flow heat exchanger with different fin structures. So in this mathematical model, heat exchanger with complicated fins is thought as the unknown internal structure porous media model, whose air resistance is uniformly distributed, and in which there are heat sources. The pressure drops and temperature rises when cool air goes through the heat exchanger. In this mathematical model, it is just considered the thermodynamic states of inlet and outlet flows rather than details of internal microcosmic flow and heat transfer in the study on heat exchanger.
Patankar and colleagues21,22 for the first time proposed radiator in vehicle as a porous medium model. Based on it, some necessary presumptions are proposed to simplify the mathematical model:
Air and coolant liquid in heat exchanger were proposed as incompressible fluid and no-phase transformation.
Air resistance of fin structure is uniformly distributed. And mass flows in tubes are uniformly distributed.
Neglecting the influence of the non-condensable gas in tubes on fluid flow and heat transfer.
The air velocity direction is only perpendicular to windward area of cross-flow heat exchanger and will not interact with other directions.
Neglecting thermal transmission effect between the adjacent micro-units in horizontal direction.
Evaluation of air flow non-uniformity
For evaluating the air flow distribution in the cross-flow heat exchanger, the windward is discrete to matrices order m by n as shown in Figure 1.
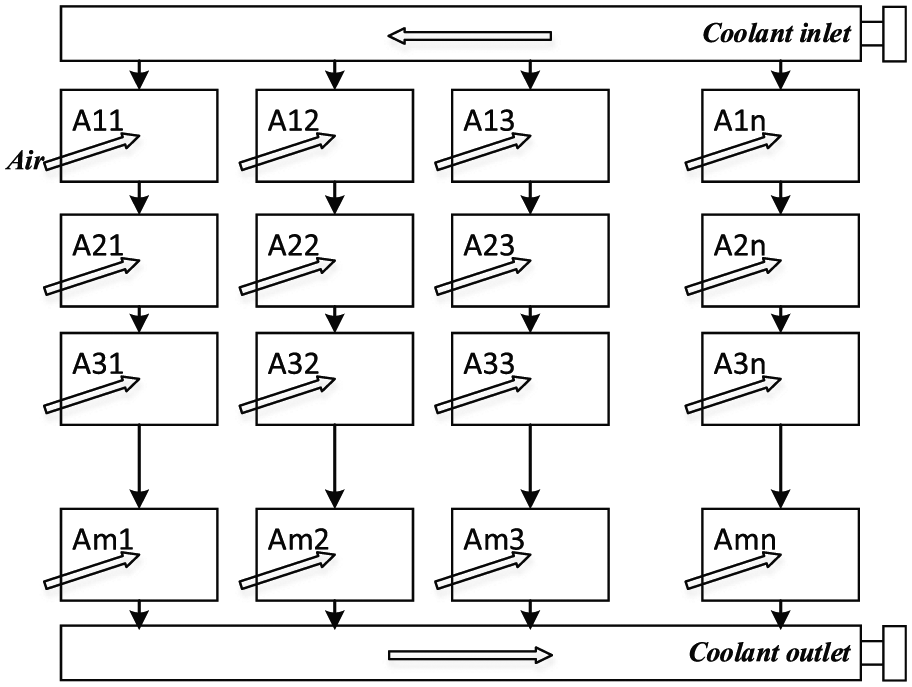
Discretization of windward.
In this model, every discrete element is regarded as a micro-radiator, in which, coolant inside tubes is considered as a one-dimensional (1D) flow. When the cool air flows through the element, pressure drop and heat transfer are carried out. The air velocity of micro–heat exchanger is the average velocity of element. And in the tubes, every discharged flow is regarded as the entrance flow of its next micro–heat exchanger.
Zhang et al.
8
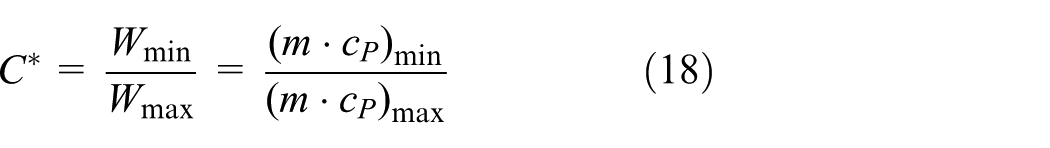
suggested four parameters to measure the non-uniformity. In this article, two parameters are chosen with care, because they are better indicators than the others. Absolute non-uniform coefficient


Permeability and inertial coefficient
Instead of complex time-averaged and volume-averaged flow-governing equations, Patankar and Spalding 21 proposed radiator in vehicle as a porous medium model. It was verified and validated this model was more accurately to reflect the hydraulic and thermal performance of air through the radiator. Since then, more studies17,19 applied this model in cross-flow radiators of vehicles, and the conclusions showed less errors with experiments.
To assess the extent of structure blockage and air flow through heat exchanger, the permeability and inertial coefficient were determined from pressure-drop experiment. According to Banerjee et al.,
23
when Re < 950, the flow law of gas in fiber is in accord with the Darcy–Forchheimer equation. The effective permeability,
In momentum equation of porous medium, the additional momentum source term consists of viscosity loss term and internal loss term, as shown in equation (3)

where the coefficients


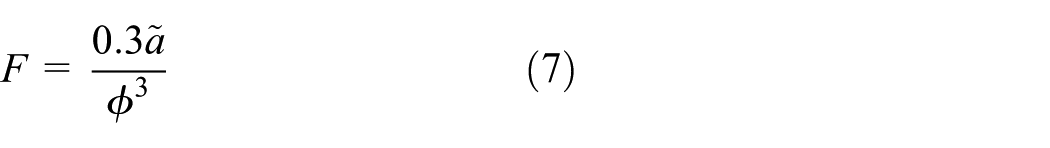
As the thickness,

In fact, many calculations adopted the pressure step model as equation (8). Then, the heat exchanger is considered to a black-box model, which avoids the influence of interior structure and material.
Resistance of air flow non-uniformity
In order to study the hydraulic performance of the cross-flow heat exchanger under non-uniform air, it is compared with the difference between uniform and non-uniform air. And according to Figure 1 and equation (8), the difference between uniform and non-uniform air-side average pressure drop is extrapolated versus velocities relationship as follows

where

According to equations (9) and (10)

The mathematical mean of
In fact, the difference in pressure drops between non-uniform and evenly distributed air,
To specially mention, in the derivation process of equations (3)–(11), it’s only assumed that air resistance of fin structure in heat exchanger is uniformly distributed, but no any limit about fin structure type and fluid type. Consequently, equation (11), which means the relationship between difference in pressure drops and standard deviation of discrete air velocities is linear, not only applies to louver fin heat exchangers but also applies to all kinds of uniform resistance porous media, which fit equation (8).
According to resistance energy consumption, the energy consumption of air flow against resistance could be expressed as equation (12)

Comparing equations (8) and (11), the difference in resistance energy consumption between non-uniform and uniform air flow distribution could be expressed as equation (13)

It is evident from equation (13) that the difference in resistance energy consumption between non-uniform and uniform air flow distribution is not linear to

Heat transfer of air flow non-uniformity
In usual heat exchanger calculation, effectiveness–number of transfer units (e-NTU) method is widely used. In this article, a discretized e-NTU method is applied for the calculation of non-uniform air flow. The heat exchanger is discretized as Figure 1. Based on the hydraulic and heat transfer performance test with uniform air flow, the discretized air flow distribution model and discretized heat exchanger model are built to study the effect of air flow non-uniformity on performance. The main idea of these models is considered every discretized unit as a micro–heat exchanger.
Base on Gnielinski,
25
for cross-flow heat exchanger, the
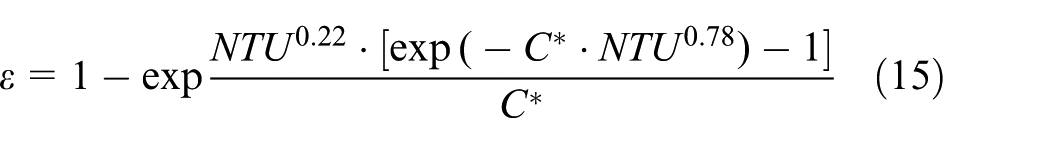
As the hydraulic performance, for studying the heat transfer performance under non-uniform air, it is compared with the difference between uniform and non-uniform air. And for studying the relationship among heat transfer effectiveness of heat exchanger
Experiment
Test facility
The test facility (Figures 2 and 3) consists of the air loop, coolant loop, and data acquisition (DAQ) system. The air loop includes an axial fan, which supplies air flow, and an adjustment grid, which keeps the air flow uniform in the wind tunnel. And the coolant loop includes heating unit, pump, and flow meter.

Test bed of the heat exchanger.

Test system.
The typical heat exchangers used in diesel cooling systems were used as test samples. Figure 4 shows the structures and the geometrical parameters of multi-louvered fin. These multi-louvered fins are beneficial to enhance turbulence and heat transfer, owing to the air boundary layer is cut by fins. Meanwhile, the heat transfer area is increased. The size of fin-tube test sample of radiator is 800 mm × 800 mm × 55 mm. As shown in Figure 4 and Table 1, the parameters of fin include width of fin, thickness of fin, length of fin, interval of fin, width of louver, and angle of louver. And all the parameters are actually measured.

Fin structure of test radiator.
Specification of the test: structural parameters.

In order to get pressure-drop distribution of radiator, the test system of air flow distribution is arranged in the front of and behind the test radiator as shown in Figures 3 and 5. For reducing the number of measure points, the pressure-measured holes are uniformly assigned in the test rob, which is installed on a slide block. The slide block could move along the pathway at a constant speed with a uniform servo motor. The pressure holes are connected to pressure sensors through the air tubes. The voltage signal of pressure sensor and the location signal of position sensor, which is installed on slide block, are passed to the DAQ card, which is connected to PC.

Flow field scanning system.
In experiment, the pressure field in front of and behind test radiator is scanned by pressure-measured holes on test robs, which are driven by a uniform servo motor and moving at a slow and constant speed. In PC, the location signal and pressure signals are recorded simultaneously. Thus, the matrices of air pressure field in front of and behind radiator could be obtained. The non-uniform air flow distribution and pressure of radiator drop after data processing. This experiment is not only appropriate for multi-louvered fin but also the same with the other kinds of fins, whose structures are uniform (Table 2).
Main input physical parameters and operational parameters.
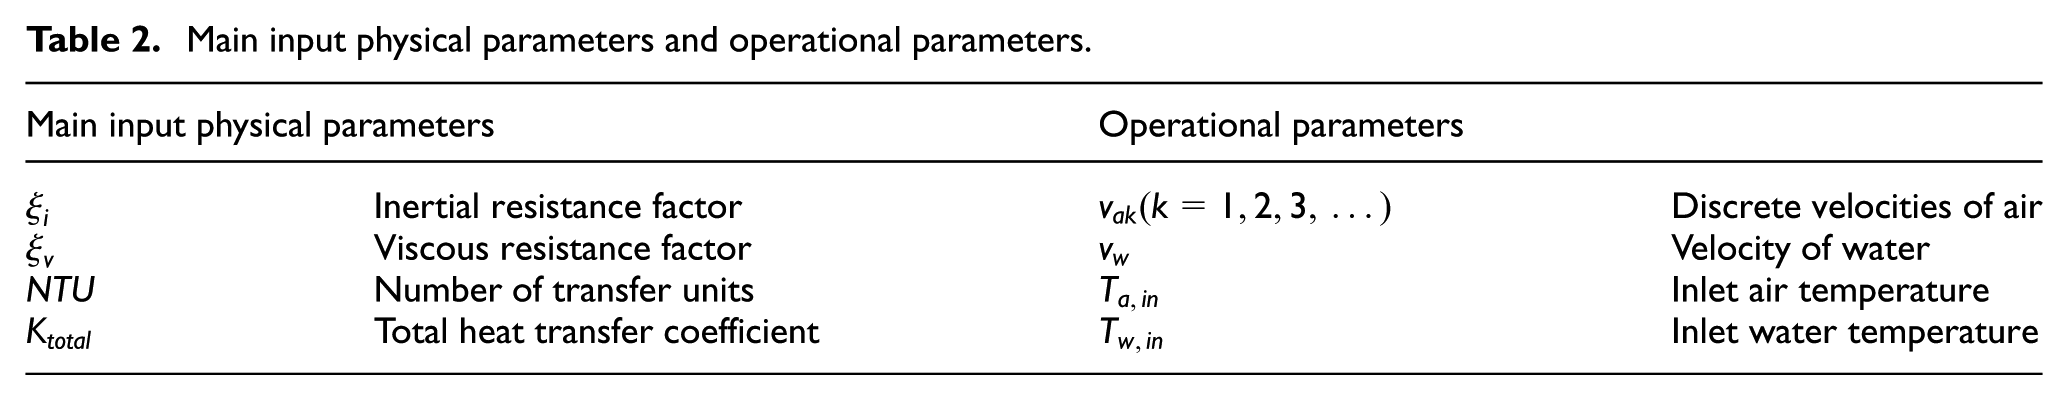
Figure 6 shows heat transfer performance of test radiator. In the experiment, inlet water temperature is 85°C, and cooling air temperature is 25°C. The heat transfer is changed with the velocities of water and cooling air without temperature being changed. Thus, the Ktotal×Atotal (KA; Atotal is the total heat transfer area) of heat exchanger could be determined if the velocities of water and cooling air are identified.
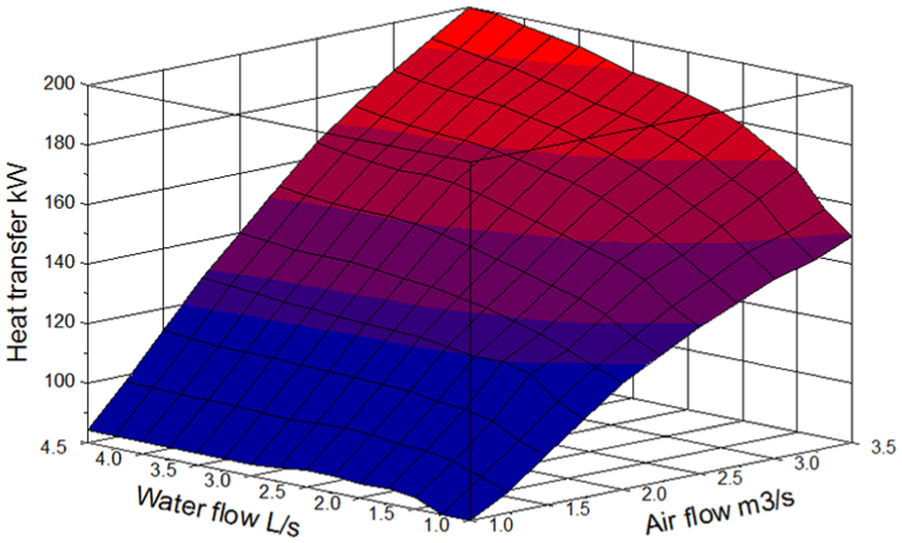
Heat transfer performance of test radiator.
Figure 7 shows the non-uniform air flow test system. Compared with Figure 8, the adjustment grid before the axis fan is moved, and the distance (L) between fan and heat exchanger is reduced to 20 cm for getting the non-uniform air flow in non-uniform air flow test system.

Non-uniform air flow test system.

Schematic flow diagram of experimental system.
Heat exchanger model for non-uniform air flow
It is hard to control the air flow distribution merely with experiment. Hence, a discretized mathematic model for heat transfer performance is established based on the experiments. And this model will help study the influence of different non-uniform air flow distributions on the hydraulic and heat transfer performance of heat exchanger.
In the mathematic model, heat transfer coefficient of every micro-unit is defined the same to the experiment. Because the temperatures of inlet water and cooling air are fixed on 25°C and 85°C, respectively, and for vehicle radiator, water temperature difference between inlet and outlet is small, no more than 10°C, and the influence of qualitative temperature to heat transfer coefficient is neglected in the model.
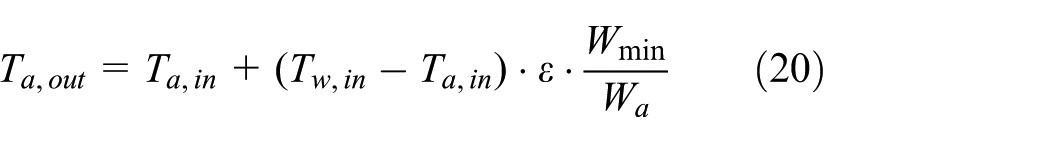
On the basis of NTU method, equations (15) and (17)–(21) are used in the heat transfer performance calculation of cross-flow heat exchanger. And according to these equations, the logic flowchart of mathematic model is shown in Figure 9


Logic flowchart for the experimental heat exchanger modeling.
The program in Figure 9 is compiled in MATLAB. First, according to the uniform air flow experiment, cubic spline curve of testing heat exchanger fitting of K, Va, and Vw is gotten. Second, discrete Va(m, n) and assumed uniform Vw are imported. On the basis of equations (15) and (17)–(21), heat transfer performance results of the cross-flow heat exchanger are obtained, including NTU, ε, and C. At last, the solution to the system of air outlet temperature, Ta,out(i, j) and water outlet temperature, Tw,out, are derived.
Uncertainty of experiment
Pressure sensors are used to measure the air pressure before and behind the test heat exchanger. The nominal precision of pressure sensors is 1%. The maximum error under the test condition is 0.9%, owing to the temperature drift noise. The maximum uncertainty in experimental results under test conditions for pressure sensors is

Water turbine flow meter is used to measure inner water flow rate of radiator. The nominal precision of turbine flow meter is 0.5%. Its maximum error under the test condition is 0.7% owing to the temperature drift noise. Thus, the maximum uncertainty in experimental results under test conditions for turbine flow meter is

Copper-constantan thermocouples are used to measure the water and air temperatures. The error caused by non-linearity of the thermocouple calibration curve is 0.2°C. The error caused by the temperature drift noise is 0.09°C. Thus, the maximum uncertainty in experimental results under test conditions for thermocouples is

Results and discussion
Results of experiment
Figure 10 shows the air flow velocity distribution matrix of radiator windward, which is scanned by the flow field scanning system, when the rotate speed of fan is 1000 r/min. And the X and Y axis represent the width and height of the testing heat exchanger, respectively. Then, the outlet water temperature
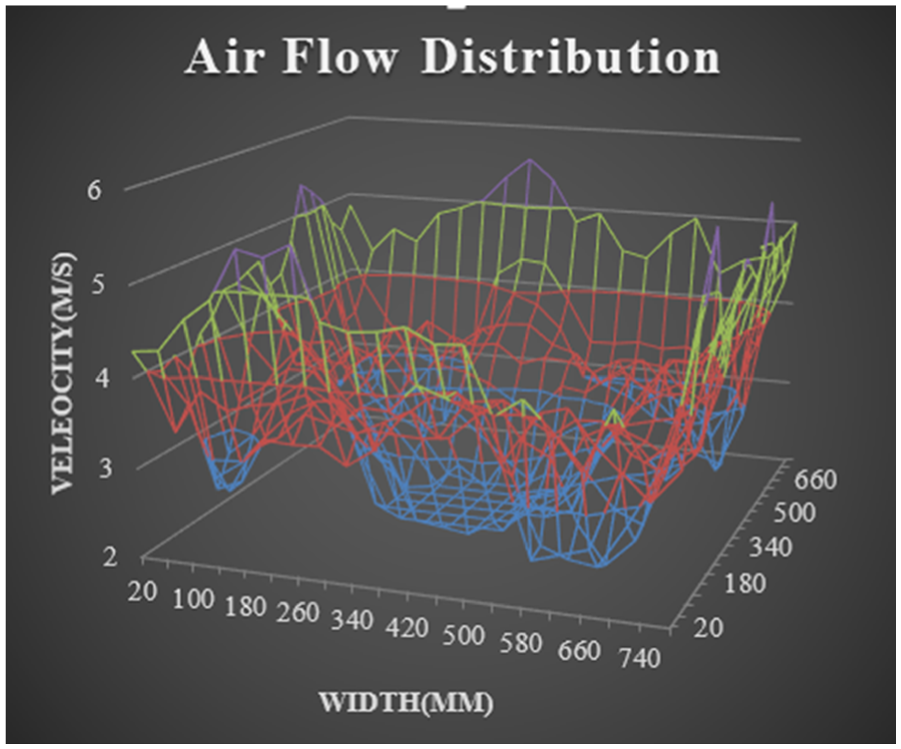
Air flow distribution.

Water temperatures of calculation and experiment.
The results in Figure 11 indicated that the error of outlet water temperatures between calculation and experiment is very small, and the computed data show good agreement with experiments, which demonstrates that it is feasible to simulate the heat transfer performance in non-uniform air flow distribution by the mathematic model.
Owing to the axial symmetry and periodic structures of fan and heat exchanger, the velocities in centerline (X axis) of the testing heat exchanger, which is scanned by pressure measuring holes, is filtered as shown in Figure 12. It depicts the air flow distributions in centerline of testing radiator, which show hump configurations, at different fan speeds. The two velocity peaks appear at ±0.3 m. As the fan speed increases, the peaks become larger, and the flow distribution patterns present obvious hierarchy structure, which is basically in accordance with the actual rules.

Air flow distributions at different speeds.
According to equations (1) and (2), the curves of absolute non-uniform coefficient,

Based on equation (9) and Figure 12, it is illustrated that theoretical and actual differences between uniform and non-uniform air-side average pressure drops,

Theoretical and actual differences between uniform and non-uniform pressure drops.
Figure 14 shows actual difference between uniform and non-uniform pressure drops mostly coincided with the theory, especially when
Matrix models of air flow
According to Figures 12 and 13, two weak aspects could be found out in experiments. First, with fan speed increasing, the value of
Therefore, porous medium and NTU models are used for further study based on the experiment. In Mao and Chen, 26 four matrix models are used to simulate air flow. Referencing those air flow models, uniform, linear, exponential, and sinusoidal distributions with the same air flow rate are adopted in this article, as shown in Figure 15.

Four matrix models with the same air flow rate.
Figure 15 illustrates four matrix distributions with the same flow rate and their average Reynolds number is 483.8. Main advantages of this method are that their average Reynolds number and
Influence on hydraulic performance
Figure 16 shows the difference in pressure drops between non-uniform and evenly distributed air with different distributions and the same average Reynolds number, which is 483, is changed with

Difference in pressure drops between non-uniform and evenly distributed air with different distributions and the same Reynolds number.

Difference in pressure drops between non-uniform and evenly distributed air with the same distribution and different Reynolds numbers.
It indicates the difference in average pressure drop between non-uniform and uniform air flow distribution is linear to the squared standard deviation of discrete air velocities, if the uniform resistance porous media is complied with Darcy’s law. And its linear coefficient is the inertial resistance factor,
In fact, the difference in pressure drops between non-uniform and evenly distributed air,

Resistance energy consumption,

Increasing rate of resistance energy consumption,
In heat exchanger–fan system, resistance of heat exchanger is the primary energy consumption, which is studied with different air flow rates and distributions, as shown in Figure 18. It indicates that resistance energy consumption is increased with increasing
For getting a more direct result,
The statistical data presents
Moreover, the value range of Re and
Influence on heat transfer
Non-uniformity of air flow not only has great influence on resistance but also has some impact on heat transfer performance. In order to study the relation of air distribution to heat transfer performance,
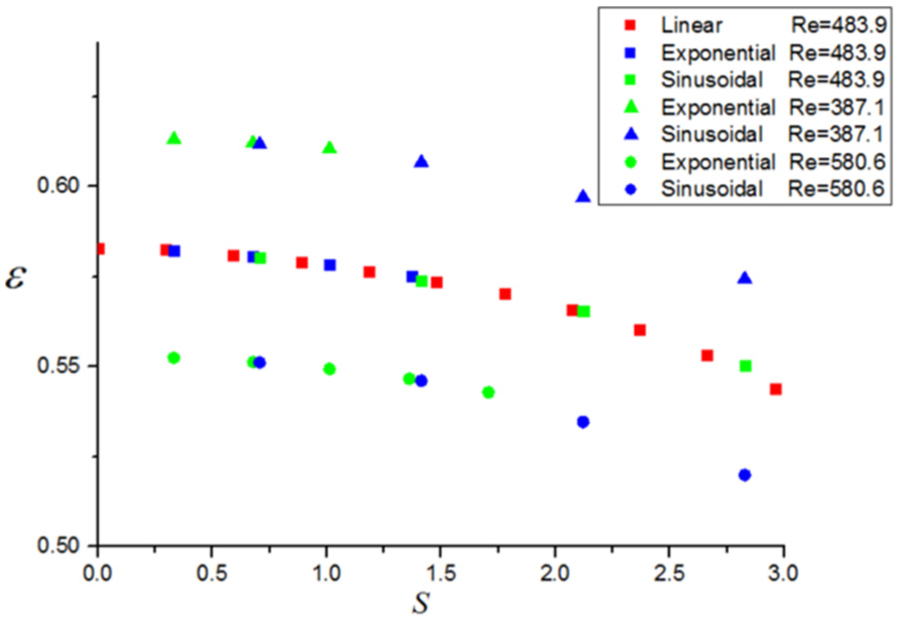
Heat transfer effectiveness,

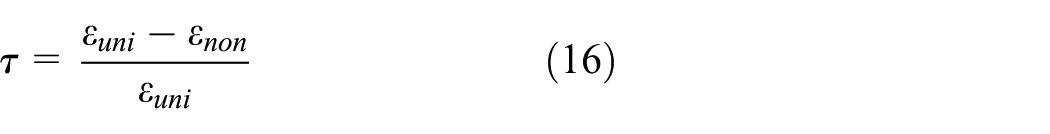
Reducing rate of heat transfer effectiveness,
Figure 20 shows that the heat transfer effectiveness is reduced with increasing
Figure 21 indicates that reducing rate of heat transfer effectiveness is increased with increasing
In fact, the heat transfer coefficient of heat exchanger is affected by the non-uniform air flow, as shown in Figure 6. Thus, the total heat transfer is reducing with the increasing non-uniformity in the same flow rate.
Conclusion
In this article, the air flow non-uniform distribution and its influence on the hydraulic and heat transfer performance of cross-flow heat exchanger under low Reynolds number with theoretical, experimental, and numerical methods are investigated. It is found that there are great impacts on performance with air flow non-uniformity. Key conclusions drawn are as follows:
In fan–heat exchanger structure, the air flow non-uniformity is mainly affected by fan speed. And in low Reynolds number, the direction perpendicular to windward in air side could be considered as a porous medium with internal heat source.
According to theory and experiments, the difference in average pressure drop between non-uniform and uniform air flow distribution is linear to the squared standard deviation of discrete air velocities under low Reynolds number, and it is independent of air flow distributions.
Resistance energy consumption is obviously affected by air flow rates and non-uniformity, instead of distribution forms. With the increasing
When
Heat transfer effectiveness is less affected than resistance energy consumption by air flow rates and non-uniformity. With the increasing
Footnotes
Appendix 1
Academic Editor: Hongwei Wu
Declaration of conflicting interests
The author(s) declared no potential conflicts of interest with respect to the research, authorship, and/or publication of this article.
Funding
The author(s) received no financial support for the research, authorship, and/or publication of this article.