
Abstract
This article proposes a tracing method to identify key geometric errors for a computer numerical control machine tool by cutting an S-shaped test piece. Adjacent part relationships and machine tool errors transform relationships are described by topology of the machining center. Global sensitivity analysis method based on quasi-Monte Carlo was used to analyze machining errors. Using this method, key geometric errors with significant influence on machining errors were obtained. Compensation of the key errors was used to experimentally improve machining errors for the S-shaped test piece. This method fundamentally determines the inherent connection and influence between geometric errors and machining errors. Key geometric errors that have great influence on machining errors can be determined quickly with this method. Thus, the proposed tracing method could provide effective guidance for the design and use of machine tools.
Introduction
High machining precision is critically important and has increased demand in recent years in aerospace, military, ships, cars, and other industries. Fabrication of high precision parts is heavily dependent of machining capabilities and capacity of the used tool. A variety of error sources related to the machine tool are responsible for machining errors. Therefore, to alleviate this problem, it is important to establish a mapping relationship between machine tool errors and machining errors. This would allow tracing machining errors caused by machine tool errors.
Geometric errors in machine tool parts contribute to spatial errors, which are a major factor affecting machining accuracy. 1 Considerable effort has been made by researchers to identify each geometric error by direct measurements on the machine. In 1982, Bryan 2 first reported the use of magnetic ball bars for measuring linear axis motion errors. Since then, various groups have applied this method to measure geometric errors of machines. Knapp and Matthias 3 proposed a circular test for identifying machine errors by measuring circular contour along different flat of machining space. This allowed identification of the main source of errors due to uncertainty of machine in three-dimensional space. Kakino et al. 4 carried out an in-depth study using the circular test with the aid of magnetic ball bars to obtain a relationship between machine motion errors and radial errors in polar plots. Tsutsumi and Saito 5 proposed an algorithm to identify eight specific geometric errors for a five-axis machine tool using the ball bar. Lei et al. 6 proposed a double ball bar test to measure rotary axes motion errors by simultaneously moving only two rotary axes while keeping all linear axes stationary. Ziegert and Mize 7 employed laser ball bars for measuring volumetric errors in a lathe. Mize and Ziegert 8 used the laser ball bar to measure all geometric errors for a three-axis machine in less than 30 min. Weikert 9 proposed a R-test measuring device for a five-axis machine tool, which has also been adopted by ISO 10791-6:2014. 10 This device can simultaneously detect displacement in three directions. As a result, this device provides more information in a single measurement. Ibaraki et al. 11 presented an efficient calibration method to identify location errors and position-dependent geometric errors for a five-axis machine using R-test. Fan et al. 12 described the use of a 6-degree-of-freedom measurement system based on the Doppler effect. This system had the capability to simultaneously measure all six motion errors of a linear stage. Knapp and Weikert 13 proposed a high-resolution system referred to as enhanced coordinate grid measurement based on Heidenhin grid encoder. This system, similar to the one described by Fan et al., allowed simultaneous measurements across 6 degrees of freedom for linear motion. They verified their test results using error compensation. Wang 14 presented a step-diagonal test method to identify geometric errors by measuring the diagonal of a processing space. Zhang et al. 15 proposed a method to determine straightness and angular errors for a linear. This method was based on the laser interferometry technique integrated with the shifting method. He et al. 16 presented a dual optical path measurement method to identify all six geometric errors associated with the rotational axis along the error-sensitive directions.
Non-cutting measurement methods do not reflect the influence of workpiece materials, temperature, tool performance, and cutting conditions. As a result, to accurately characterize the measurements, several studies have been reported in the literature, which are focused on cutting test to detect machine deviation for a specific workpiece. The NAS 979 test piece 17 proposed by NASA consists of a cone frustum, rhombus, taper, or other shapes. The NC-Gesellschaft (NCG) test piece 18 developed by European manufacturers blends various typical shapes together, such as conic, cylindrical boss, U-shaped surface, hemisphere surface, and developable ruled surface. A square-shaped step test piece 19 introduced by Kyoto University was machined at different index angles of the rotary axes. Relationship between machining errors for this test piece and geometric errors of a five-axis machine tool was formulated. A S-shaped test piece 20 invented by Chengdu Aircraft Industrial is a twisted equal thickness non-developable ruled surface. It contains characteristics such as opening and closing angle conversion and a thin-walled curve. These features result in higher linkage performance and surface machining performance for the five-axis machine. As a result of the improved machining performance, use of this test piece has increased popularity in the aviation industry. Nevertheless, there is a serious lack of quantitative data for machining results of an S-shaped test piece. The XHAV2430×80 five-axis gantry machining center (FAGMC) produced by Beijing No. 1 Machine Tool Plant has been used to cut the S-shaped titanium alloy specimens successfully. This is a major technical breakthrough in titanium alloy cutting using machines manufactured in China. 21 However, machining errors and defects in any specimen including the S-shaped titanium alloy specimens cannot be completely eliminated. To understand and determine source of errors in the machine piece, it is important to find the key cause that affects machining errors.
Methods to evaluate geometric accuracy of a machine can be broadly categorized into two types. The first method employs direct measurement on the machine, whereas the second method category assesses machine precision by testing machining errors of the workpiece. Direct measurement methods carry out direct measurements of machine tool errors but rely heavily on measurement capability of the equipment used and identification methods used are generally complex. To overcome these drawbacks, in this study, a measurement method, which is simple and can quickly analyze geometric errors of a machine tool, is proposed. Here, machine tool errors are evaluated by detecting machining errors of S-shaped pieces. Sensitivity analysis of the machine tool error model is mainly based on local sensitivity analysis (LSA).22–25 This method employs simple calculations, but has more steps related to the model analysis process. A significant limitation of LSA is that model sensitivity cannot be calculated for unknown nonlinear model input variables. Global sensitivity analysis (GSA) avoids this issue. 26
In this article, geometric errors are considered in the kinematic equations according to the topology of FAGMC. GSA based on quasi-Monte Carlo (QMC) is introduced to analyze kinematic equations, which is the machining error model (MEM) of the machine. This allows sensitive errors of MEM to be estimated. These sensitive errors are key parameters that affect machining errors of the machine. Experiments were carried out to validate results. The presented method has generalized applicability and allows quick trace main factors influencing machining errors.
Machining accuracy model of the machine center
Machine tool structure and generalized coordinates
Figure 1 shows the schematic of the FAGMC structure. It can be seen from the figure that FAGMC consists of a bed, worktable, saddle, spindle, and swing head. Here, multi-body system theory is used to show the topological relationships for the geometric structure of FAGMC, shown in Figure 2. There are two branches in Figure 2, that is, workpiece branch (B1-B2-Bw) and tool branch (B1-B3-B4-B5-B6-Bt). Then, kinematic equations are established in the form of homogeneous matrices.

Schematic of FAGMC structure.

Topology of FAGMC.
Suppose that the workpiece and tool are clamped without errors. Point O is origin of
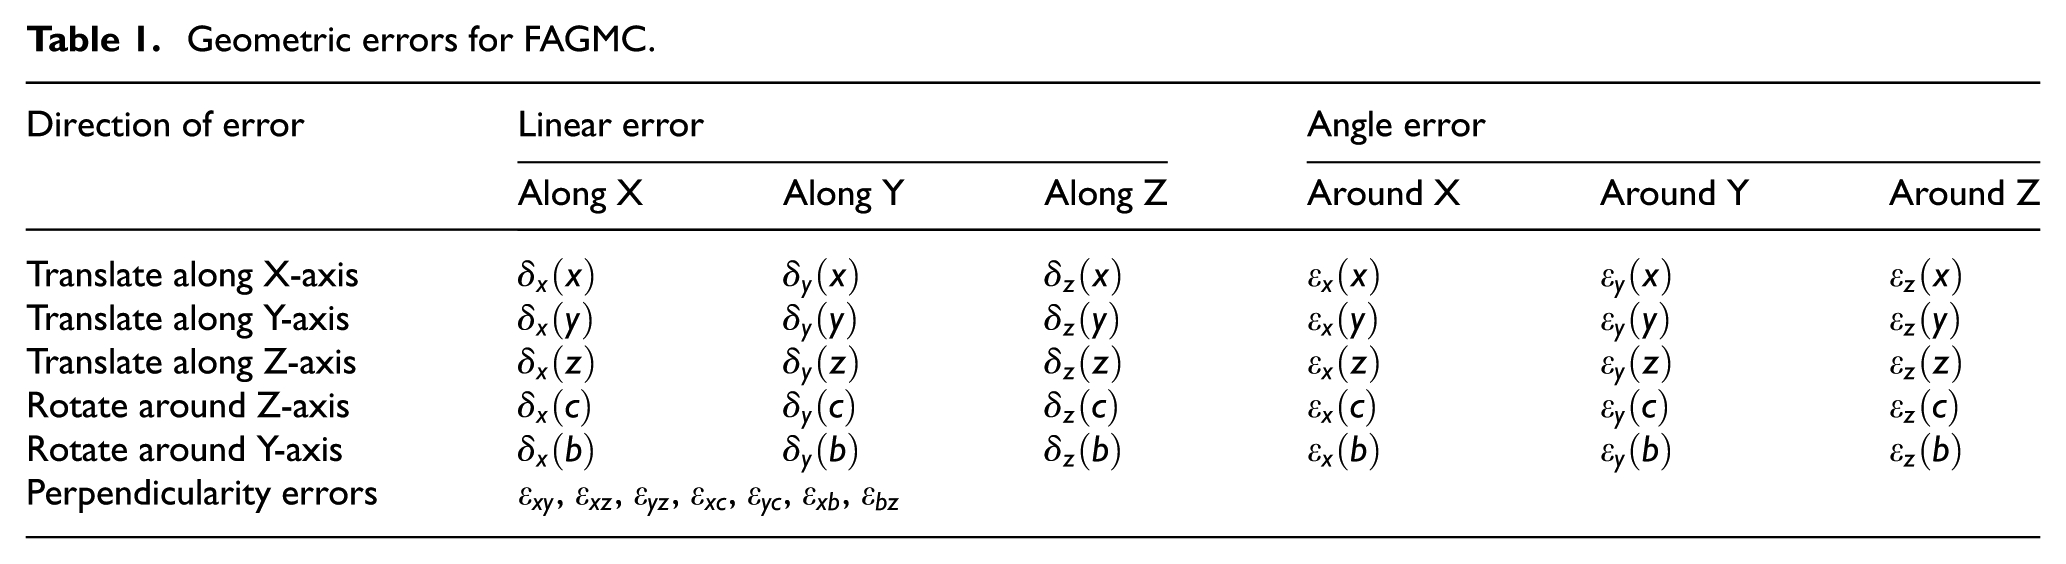
A machine tool part generates 6-degree-of-freedom errors in space. Therefore, a five-axis machine tool with five parts would generate 30 geometric errors. Additionally, there are three vertical errors between three translational axes, two parallelism error components between C and Z axes, and another two parallelism error components between B and Y axes. So, for a five-axis machine, a total of 37 geometric errors would be generated. These errors are listed in Table 1.
Geometric errors for FAGMC.
MEM of FAGMC
Figure 2 can be used to obtain location of the actual and theoretical tool center in the machine coordinate system

where
The D-H matrices of FAGMC.

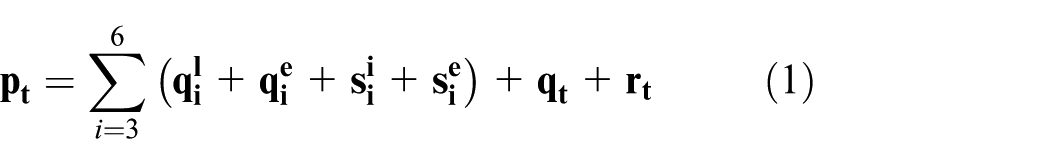
According to Table 2, equations (1) and (2) can be rewritten into homogeneous matrices


An important ideal condition is that the actual tool center location is equal to the theoretical tool center, that is,

Furthermore, to get the ideal tool center location

Therefore, MEM can be calculated from equations (5) and (6)

where

In the case where error parameters of the machine are unknown, sensitivity of the model cannot be analyzed by the LSA method, and GSA method must be adopted.
GSA of the MEM
Monte Carlo and QMC method
The main difference between Monte Carlo (MC) and QMC methods is that the random numbers used in each of the methods is different. Since 1960s, mathematicians have been studying highly uniform quasi-random number sequences. These numbers replace random numbers in MC simulation and this method is called as the QMC method. Random numbers are mainly used to simulate randomness, while the use of quasi-random numbers is primarily to achieve uniformity of numbers. It has been proved by numerous theories that uniformity of random numbers is primarily responsible for accuracy of MC simulation results compared to randomness of the generated random numbers. 27 Increase in uniformity of the random number distribution results in a decreased volatility of the random numbers, smaller deviation, higher calculation accuracy, and faster convergence rate for the calculations. Therefore, use of QMC method can improve simulation efficiency and reduce simulation errors. The uniformity of random numbers decrease with the increase in dimension. Since, FAGMC’s MEM involves up to 37 geometric errors, distribution of the 36th and 37th random numbers is observed. Figure 3(a) is distribution of the random numbers, and Figure 3(b) is distribution of quasi-random numbers. From the figure, it can be seen that uniformity of the quasi-random numbers is much better than the random numbers.

(a) Distribution of random number (5000 points) and (b) distribution of quasi-random number (5000 points).
GSA based on QMC method
The objective of sensitivity analysis is to identify critical inputs (parameters and initial conditions) for a model and quantify the impact of input uncertainty on model outcomes. 28 GSA based on MC is the best available method for calculating sensitive indices for model evaluation. 26 Essential features of MC-based sensitivity analysis are repeated here for reader convenience and also because they are needed for discussion of the approximation algorithms used in this work.
According to Sobol’s 29 definition, first-order sensitivity index is given as

where
Saltelli 30 proposed a GSA method based on QMC. In this case, inputs are assumed to be independent random variables and joint probability density function of the inputs is

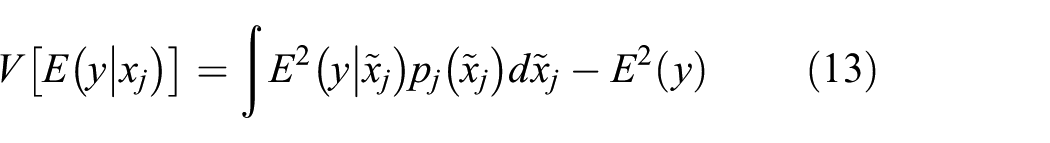
Thus, mathematical expectation and variance are obtained

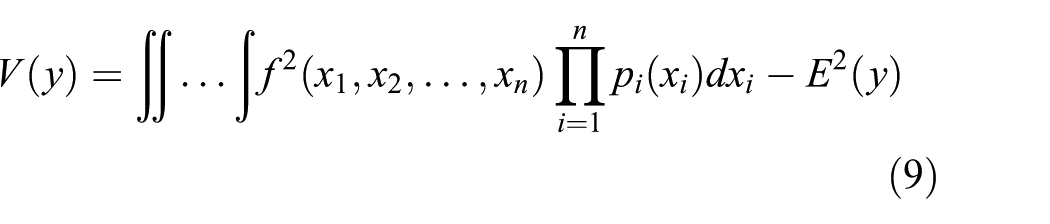
If
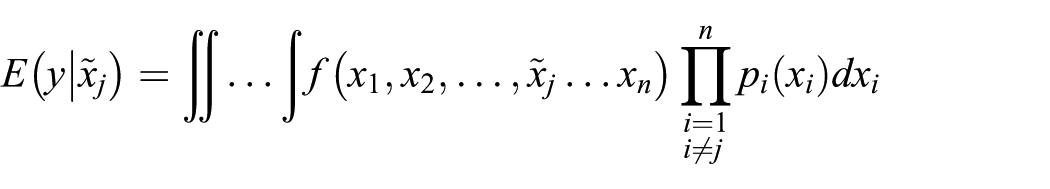
Thus, equation (9) can be written in the form

where

Equation (9) minus equation (10) gives

Based on the research of Iman and Hora 31

Substituting equation (11) into equation (12), we obtain
To facilitate presentation and readability, we assume

Equation (14) can be expressed as

The function


Substituting matrices


Sensitivity index of

where

Sensitivity indices reflect influence of error parameters on MEM. In practice, if machine geometry error values are known, accuracy of the sensitivity analysis can be further improved. If sensitivity index of an error parameter is large but its value is very small compared to other parameters, it may not have a significant impact on the model. So, an actual machining errors sensitivity analysis method is proposed here, where geometric error values are used as weights for sensitivity analysis

where

Sensitivity analysis diagram of FAGMC.
MEM studied here involves 19 geometric errors in the range [−0.1, 0.1]. To carry out the sensitivity analysis, MEM was input into the sensitivity analysis software shown in Figure 4 and constant values were assigned. A quasi-random sequence was generated and scrambled using the “MatousekAffineOwen” algorithm available in MATLAB. This allows generating a sequence with higher uniformity. In this way, matrices
Key geometric errors tracing for FAGMC
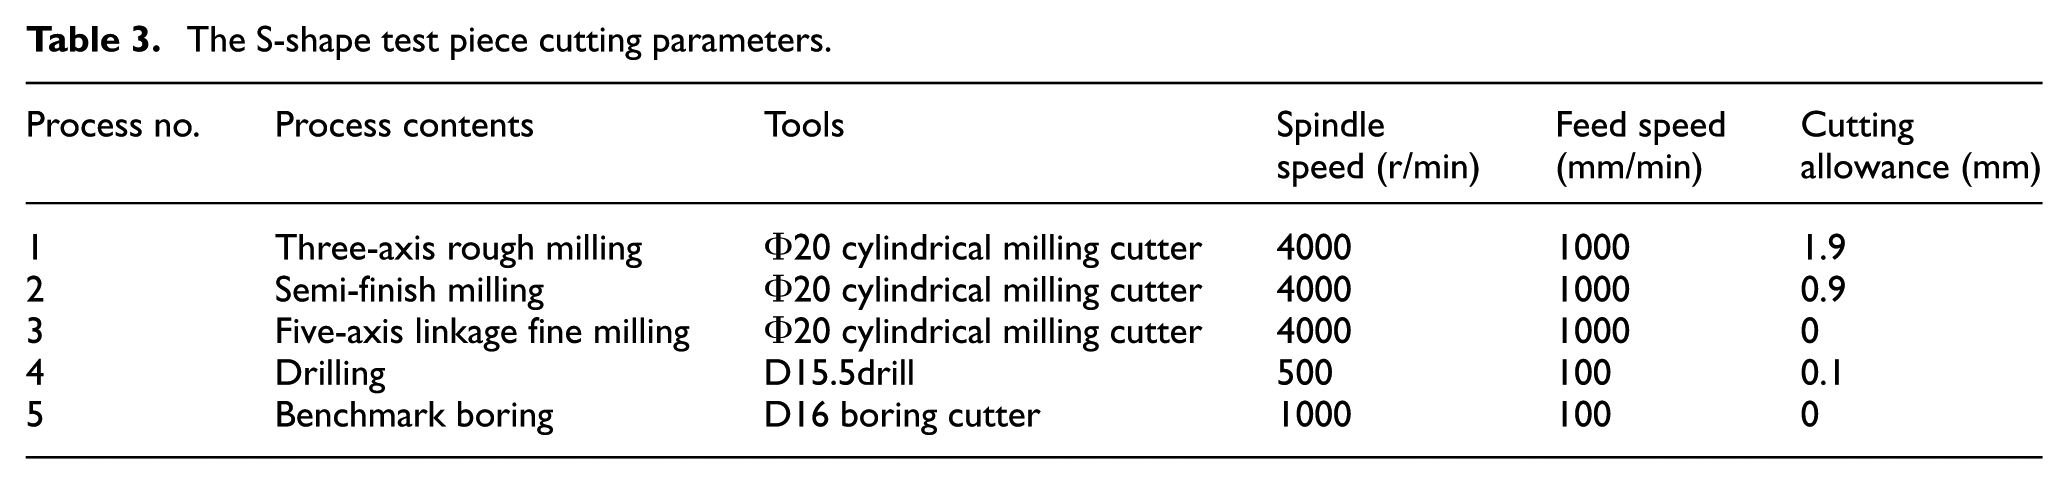
In this article, MEM of the Z-axis is the primary focus of research and discussions. Here, the key geometric errors affecting machining errors on the Z-axis are analyzed. For experiments, an aluminum alloy (material No. 7075-7451) was cut as an S-shaped test piece using FAGMC. Cutting parameters are listed in Table 3. Figure 5 shows an image of the S-shaped test piece being machined by the FAGMC.
The S-shape test piece cutting parameters.

An S-shaped test piece being machined by FAGMC.
Machining error of the S-shaped test piece was determined using the Global performance 09.15.18 coordinate measuring machine (CMM) manufactured by Hexagon Company. Diameter of the probe used was 3 mm. Measurements were carried out on the surface of S-shaped test piece over three lines along the height of the test piece. These are labeled as L1, L2, and L3 and are shown in Figure 6. Here, L1 is 30 mm from the top face of S-shaped edge strip and the two adjacent lines are spaced 5 mm apart. To measure machining errors, 25 sample points were measured on each line. Figure 7 is the referring checkpoints schematic in the CMM system.

Schematic illustrating measurement positions for error detection for the S-shaped test piece.
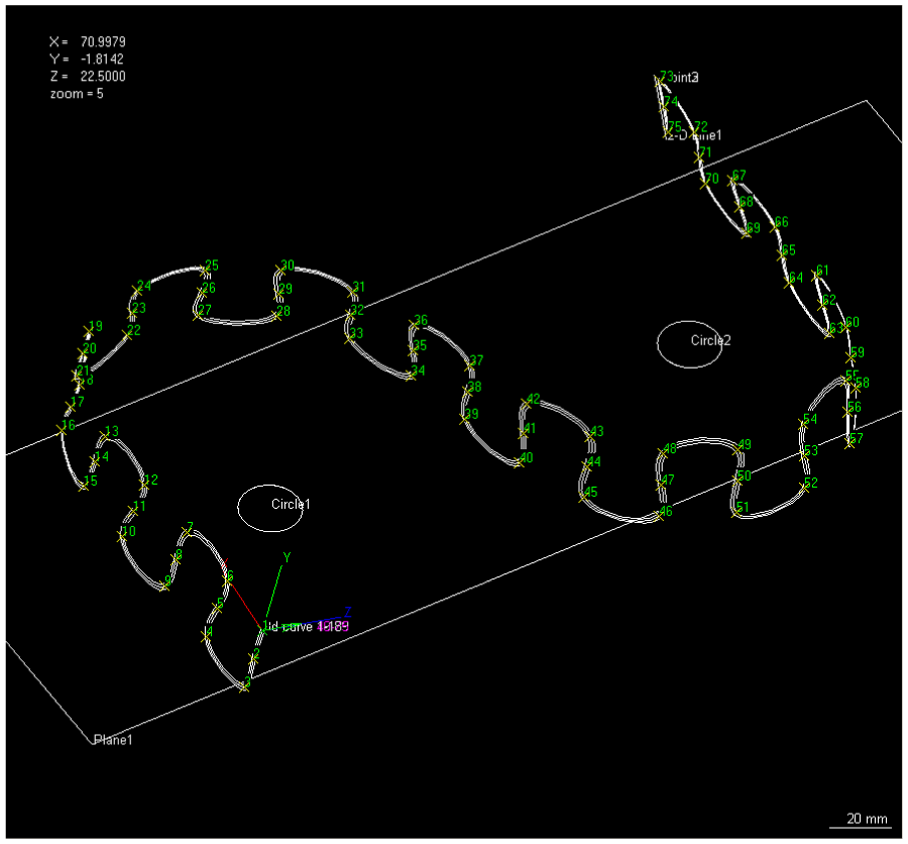
Referring checkpoints schematic for the system of trilinear CMM.
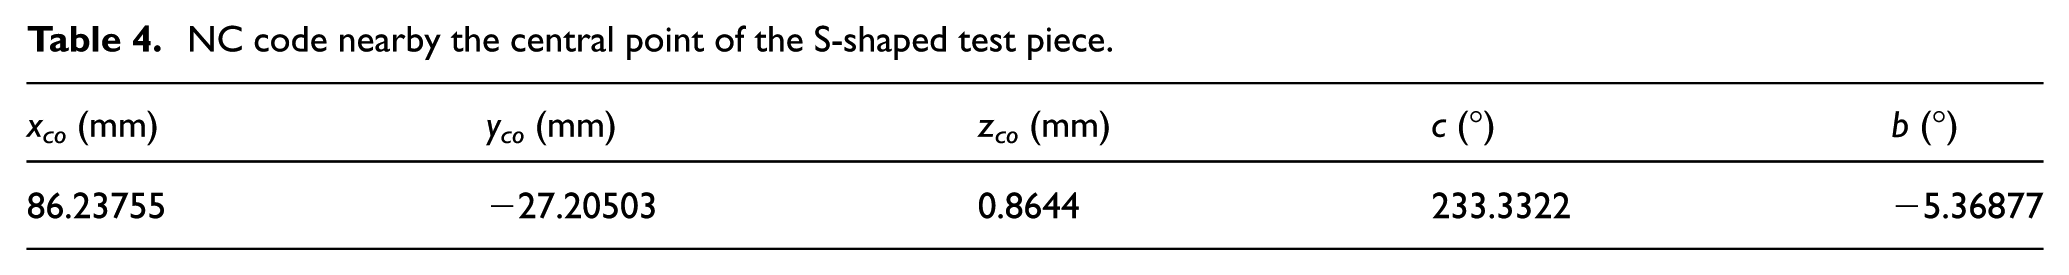
Machining errors on Z-axis are shown in Figure 8. From Figure 8, it can be seen that a majority of the large errors are located in the middle of the S-shaped test piece. Therefore, an area near the central point was selected to carry out further analysis of geometric errors affecting this region. Next, NC code of the test piece was generated in UG NX8.5. This generated NC code near the central point is shown in Table 4.

Machining errors on Z-axis for the S-shaped test piece.
NC code nearby the central point of the S-shaped test piece.
Substituting matrices from Table 2 into the equations (5)–(7) gives MEM on Z-axis
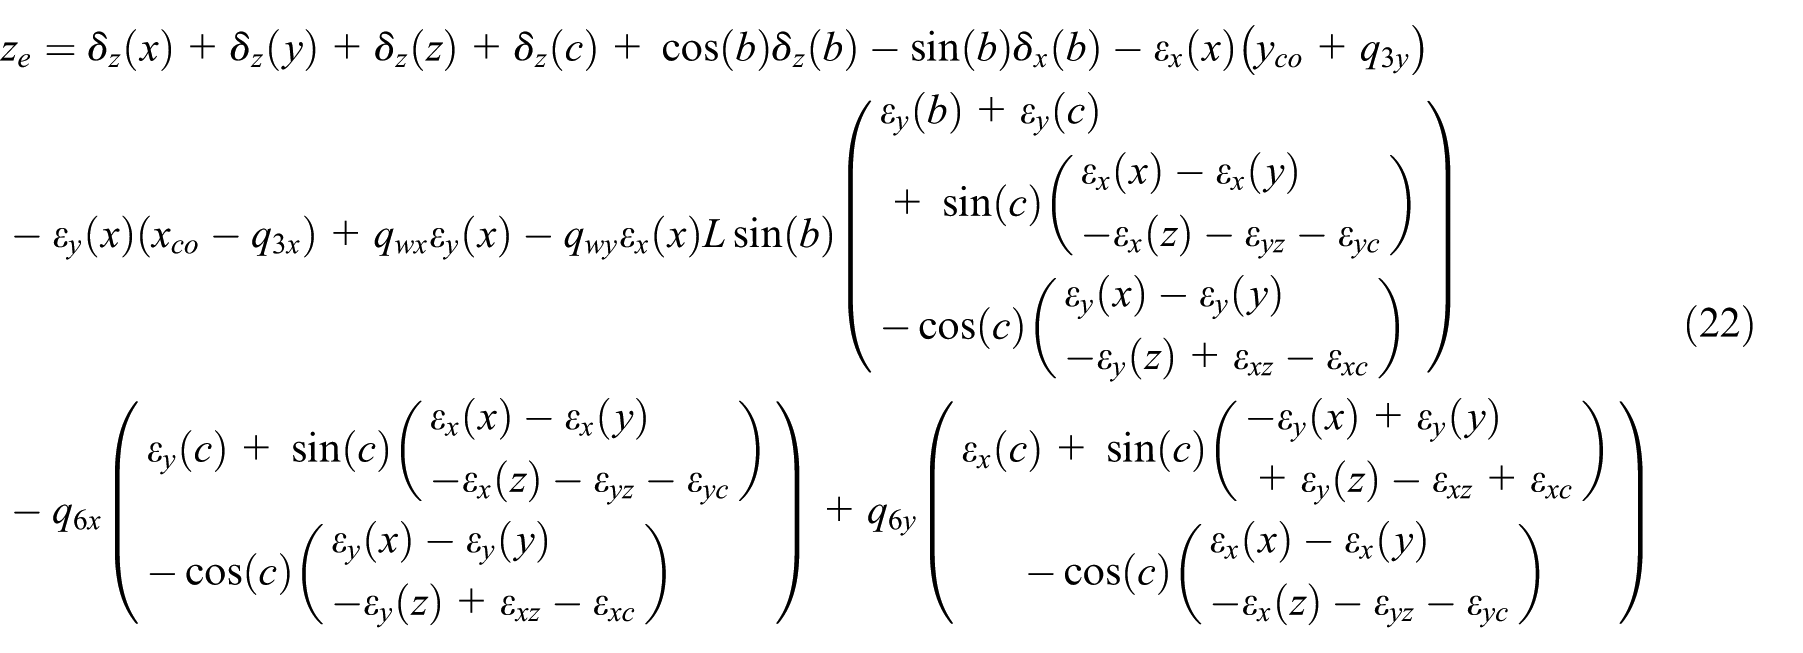
There are 19 unknown geometric errors and 11 constants in equation (22). The physical meanings and values of the constants are listed in Table 5.
The constants of MEM on Z-axis.

Sensitivity indices for the 19 geometric errors were obtained by substituting constant values from Table 5 and equation (22) into the sensitivity analysis software. Descending rank for geometric errors according to their sensitivity indices is shown in Figure 9. Maximum sensitivity index is the geometric error

Sensitivity indices of machining error model.
A total of 2000 sample points were taken from the range of geometric errors to plot the scatterplots (Figure 10), which reflect degree of association between the geometric errors and machining errors.

Scatterplot showing correlation between geometric errors and machining error.
From Figure 10, it can be seen that

Actual machining error sensitivity indices.
In Figure 11, geometric errors
To further verify these results, we compensate the four sensitive geometric errors by modifying the NC code. The four sensitive geometric errors were retained and other error parameters were set as zero. According to the machining accuracy model, the mapping model

Modified NC code iteration algorithm.
Then, a new S-shaped test piece was cut on the FAGMC using the modified NC code, while other machining parameters and the workpiece clamping position remained unchanged. Next, machining errors were measured again on the new test piece. The results are shown in Figure 13.

Contrast processing errors after error compensation: (a) machining errors in L1, (b) machining errors in L2, and (c) machining errors in L3.
After error compensation, machining errors on Z-axis were found to significantly decline. From Figure 13(c), absolute mean machining error on Z-axis reduced up to 61%. These experiment results demonstrate that sensitive geometric errors are key factors affecting the machining errors.
Discussion and results
Convergence rate and estimation error calculation
Taking sensitivity analysis results of
Comparison of sensitivity calculation results of

Using the MC method to obtain four-bit accuracy numbers needs to be sampled
Sample size in the QMC method
Sample size has a significant impact on calculation speed, so it is an important parameter that needs to be taken into consideration. The sample size should be as small as possible to ensure convergence. We varied the sample size from 100 to 25,000 to calculate sensitivity indices, which is shown in Figure 14.

Effect of sample size on sensitivity results.
According to Figure 14, sensitivity indices were observed to converge starting from a sample size of 5000. The values were found to fluctuate slightly on the order of a thousandth of magnitude leading to change in the order of approximate sensitivity indices. This order of the sensitivity indices is shown in Figure 15.

Effect of sample size on sensitivity order.
Figure 15 shows that the sensitivity indices order can be divided into four separate layers. The orders were found to change within each layer for a sample size exceeding 400. Therefore, we could not determine a specific type of sensitivity index. However, only the order of the layer is required to judge key geometric errors. Based on the above discussion, 5000 was selected as the sample size for this study.
Results
Figure 11 shows that geometric errors
Figure 9 shows that sensitivities of all four perpendicularity errors
To avoid duplication of results, only MEM on Z-axis was analyzed, that is, analysis process along the other two directions is the same. Servo system errors are also one of the critical factors affecting macroscopic-sized machining errors. After error compensation, machining errors found in the middle of the S-shaped were still large. This can, however, be attributed to the servo errors when the C-axis is changing direction. As a result, further investigation is necessary to carry out a comprehensive analysis of the servo error to trace machining error.
Conclusion
This article investigates methods for tracing key geometric errors affecting machining precision. Here, analysis was focused on significant source of geometrical errors for a large contour error area of the workpiece. For the MEM of FAGMC, sensitivity of inputs by QMC method was analyzed. Then, a sensitivity analysis method for actual machining errors with known geometric error values was proposed. In a trial cut test, mean absolute machining error was reduced by 56% after compensating for key geometric errors.
A major aim of this research was to propose a novel tracing methodology to determine importance of geometric factors affecting machining errors. Our results indicate that inputs and outputs of the MEM are intrinsically linked. GSA can be used to solve the relationship between the inputs and outputs. This method can be extended to practical applications in complex machine models. The results and the method presented in this article would be useful to machine tool manufacturers and users in designing and testing machines.
Footnotes
Academic Editor: Ramoshweu Lebelo
Declaration of conflicting interests
The author(s) declared no potential conflicts of interest with respect to the research, authorship, and/or publication of this article.
Funding
The author(s) disclosed receipt of the following financial support for the research, authorship, and/or publication of this article: This work was supported by the National Natural Science Foundation of China (Grant Nos 51275014 and 51475010) and the National Science and Technology Major Project of China (Grant No. 2013ZX04011-013).