
Abstract
A partition method mathematical model was established for the shutdown process of an overhead pipe, and the effects of crude oil’s variable physical properties on the heat transfer performance were analyzed. The model and solving method were verified by the existing experimental data. The oil temperature distribution in pipe was simulated by FLUENT software, and the allowance shutdown time, which is the time of the oil temperature in the pipe center that it takes to drop to its freezing point, was discussed. In simulation, oil properties including densities, thermal conductivities, viscosities, and specific heat were modeled with their values as functions of temperature or set to their average values in the temperature range. Results show that compared with the latter (oil properties were average value), the allowance shutdown time using variable physical properties were shortened by 16.3%, 7.9%, 0.2%, and increased 61%, respectively; the influence of thermal conductivity was embodied in the second half of the shutdown process. In numerical simulation of the shutdown process for an oil pipeline, the effect of oil viscosity variation can be ignored and, the other properties must not be regarded as constant, especially heat capacity, whose change reflects the influence of latent heat.
Introduction
If a hot oil pipe is shutdown, heat will escape from the pipe to the environment due to the temperature difference between the interior and exterior of the pipe. When the oil temperature drops to the wax-appearance point, paraffin wax will separate out and the oil will coagulate, making the oil pipe hard to restart. Numerical simulation results of pipeline oil temperature distribution have an important guiding role in determining safe shutdown time, establishing restart schemes, and determining maintenance plans.
Because the components of oil are complex, its phase transformation process is different from that of water. Additionally, the physical properties of crude oil are variable. For numerical simulation of oil temperature drops, there are two main problems to resolve: modeling convective heat transfer and wax-appearance precipitation. Natural convection is caused by changes in oil density and affected by oil viscosity. The release of latent heat through crude oil wax precipitation results in specific heat variation. Therefore, oil physical properties play a major role in modeling its temperature drops and phase changes.
However, in previous research, many numerical studies have been dedicated to convection and wax-appearance latent heat.1–21 Patience and Mehrotra 1 have taken oil properties as constant. Nagano et al. 2 has studied flow fields by inducing flow function and vorticity, but in the models, oil physical properties were constant except for oil viscosity. Zhang 3 and Liu and Zhang 4 have taken the oil specific heat as constant and added the wax-appearance latent heat at the freezing point. However, the actual wax precipitation process happens over a range of temperatures. Lu et al.5,6 established an enthalpy method model with constant oil specific heat, the wax-appearance latent heat being given off in the temperature range of 1.5°C above and below the freezing point. Obviously, these approaches are not consistent with the actual situation of wax precipitation. Xu et al. 7 and Du et al. 8 proposed a model that converted latent heat into enthalpy, but in simulation, the specific variable was adopted again, which was contradictory because of the latent heat of repeated calculation. Zhu et al. 9 have considered the relationship between the physical properties of crude oil with temperature; however, they did not present flow patterns and phase change interface shapes. Other researches10–16 ignored the convective process caused by density change, modeling the heat transfer as pure conductivity. Zu 17 took latent heat as equivalent to specific heat to calculate the temperature drop during shutdown.
Until now, there has not been a report on the influence of variable oil physical properties on temperature distribution. In this article, a partition method mathematical model was established for the crude oil temperature drop in an overhead pipe following shutdown and verified using existing experimental data. 22 The influence of different properties of parameters (e.g. density, viscosity, k-factor, and specific heat) on the temperature field was analyzed, and solidification interfaces at different shutdown times were obtained. The oil properties were modeled with their values as functions of temperature or set to their average values in the temperature range. The resulting temperature changes at the center of the pipe, with the resulting differences in shutdown time, were compared. The shutdown time allowance, which is the time taken by the oil temperature in the pipe center to drop to its freezing point, was discussed.
Models
Physical model
In order to simplify the calculation, some assumptions were set as follows:
Thermal resistance of oxidizing coating and protecting coating is negligible;
Each layer has a close connection, without additional thermal resistance;
Each material layer is uniform, and the physical properties of the pipe and thermal insulation material are constant;
At the beginning of shutdown, the temperature of the oil in pipe is uniform;
The Boussinesq 23 approximation was adopted, neglecting viscous dissipation in the fluid.
The physical model of an overhead pipeline in shutdown is shown in Figure 1. The model can be divided into four parts: the crude oil liquid zone, the crude oil solid zone, pipe, and the insulating layer. R0 is the diameter of the liquid crude oil zone, R1 is the inner pipe diameter, R2 is the external pipe diameter, and R3 is the external diameter of the insulating layer which has direct contact with the atmosphere.

Physical model of overhead pipeline.
When the overhead pipeline is shutdown, the oil heat transfer process takes place as follows: first, liquid oil transmits the heat to the condensate reservoir or pipe wall by natural convection. Then, the heat is transferred outward through the condensate reservoir, pipe, and insulating layer by conduction. Finally, the heat is transferred from the outermost layer to the atmosphere and the surrounding objects by convection and radiation.
Mathematical model
Partition allocation method mathematical models are established, and the oil in pipe was divided into a liquid zone and solid zone with an infinitely thin phase interface. Energy conservation equations are established in all zones as follows.
Liquid zone
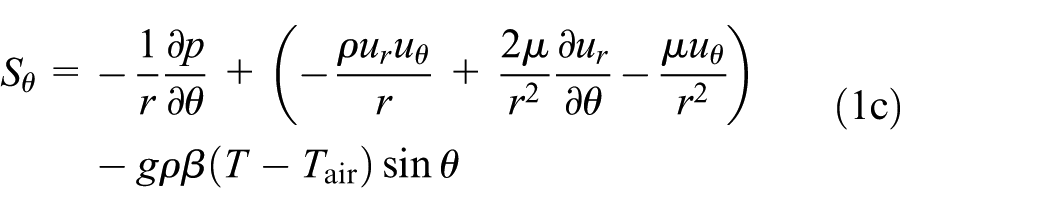
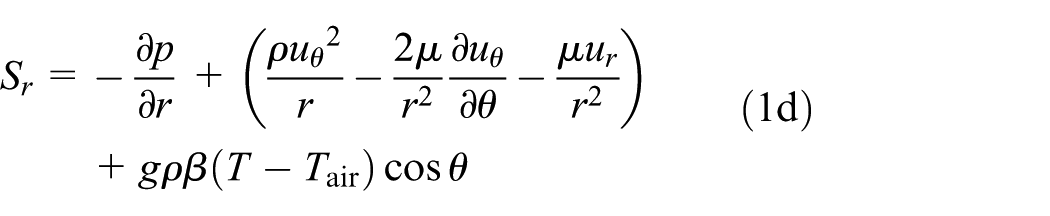
Momentum equations
The momentum equations of liquid are as follows. For a Newtonian fluid
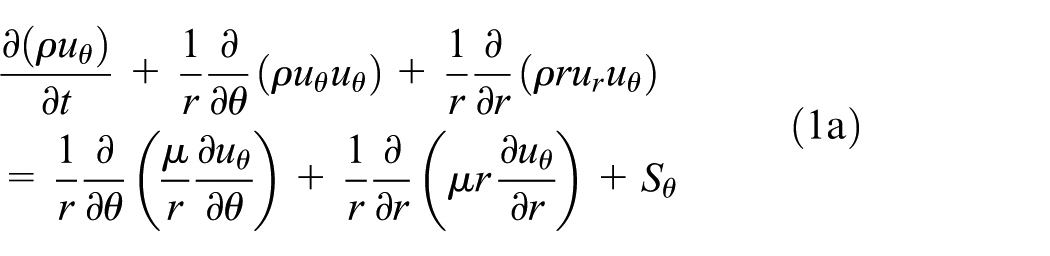

where
For a non-Newtonian fluid
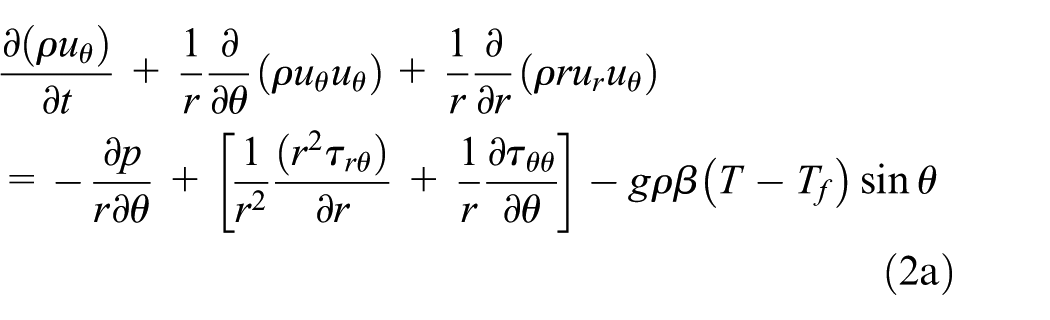

where


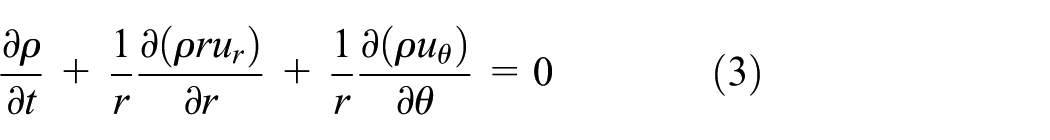
Continuity equation
The continuity equation of liquid is as follows
Heat transfer equation
Heat transfer equation in liquid oil is shown as follows

In the process of solidification, crude oil releases latent heat which can be demonstrated by
Solid zone
Pure heat conduction equation for the solid phase of crude oil is shown as follows

Other zones
The heat transfer equations for pipe wall and insulating layer are given by


where
Boundary conditions
At the point of contact between liquid and pipe wall

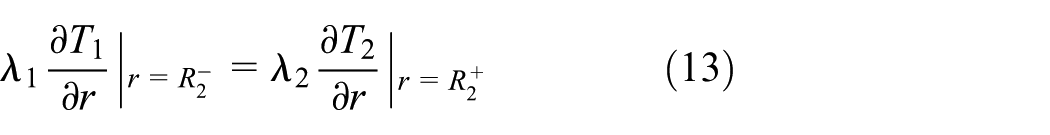
At the point of contact between liquid and solid (at the interface radius is


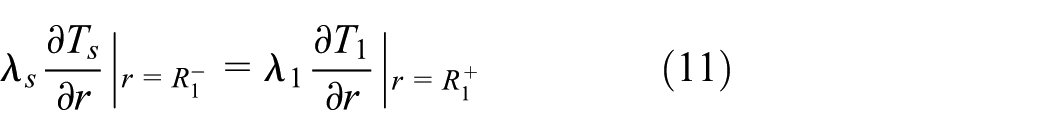
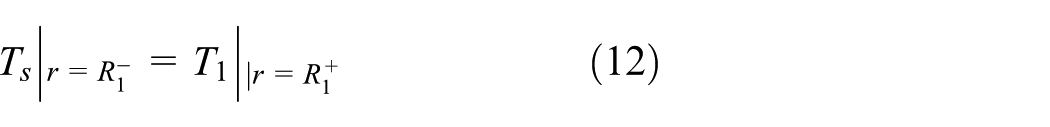
At the point of contact between the solid and the pipe wall
At the contact surfaces between the pipe wall and the insulating layer
At the contact surface between the air and the outmost layer of the pipe

where
Initial conditions

where
Model verification
Many methods for validating temperature fields between numerical simulation and experimental data have been developed. This article uses experimental data as reported in the literature 23 to verify the model. The atmospheric temperature as a function of time is as follows
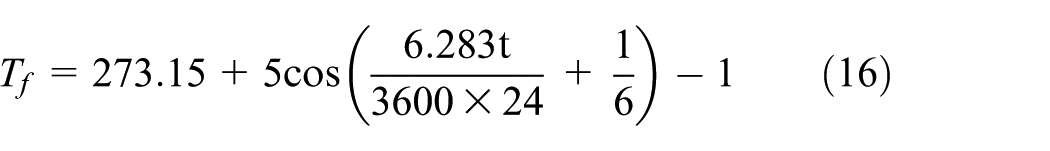
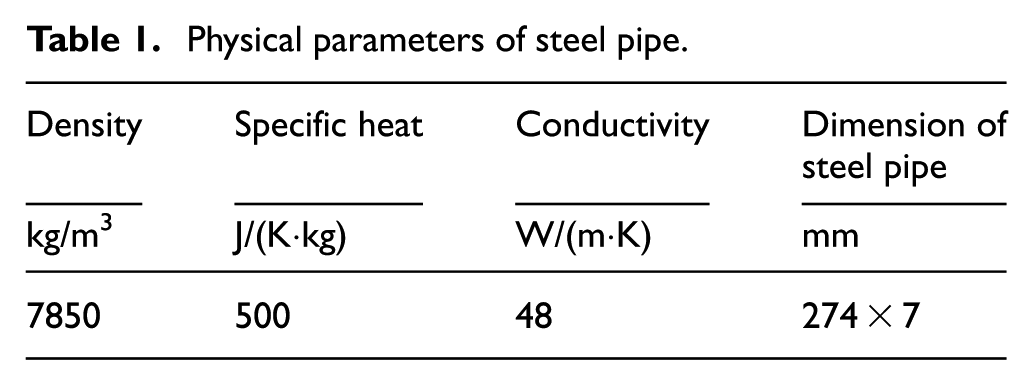
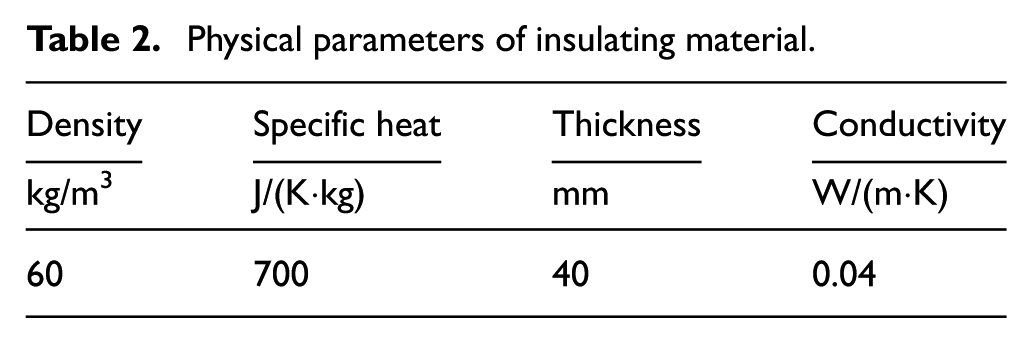
The experimental parameters are shown in Tables 1–3. The initial oil temperature is 350 K.
Physical parameters of steel pipe.
Physical parameters of insulating material.
Parameters of experiment crude oil.
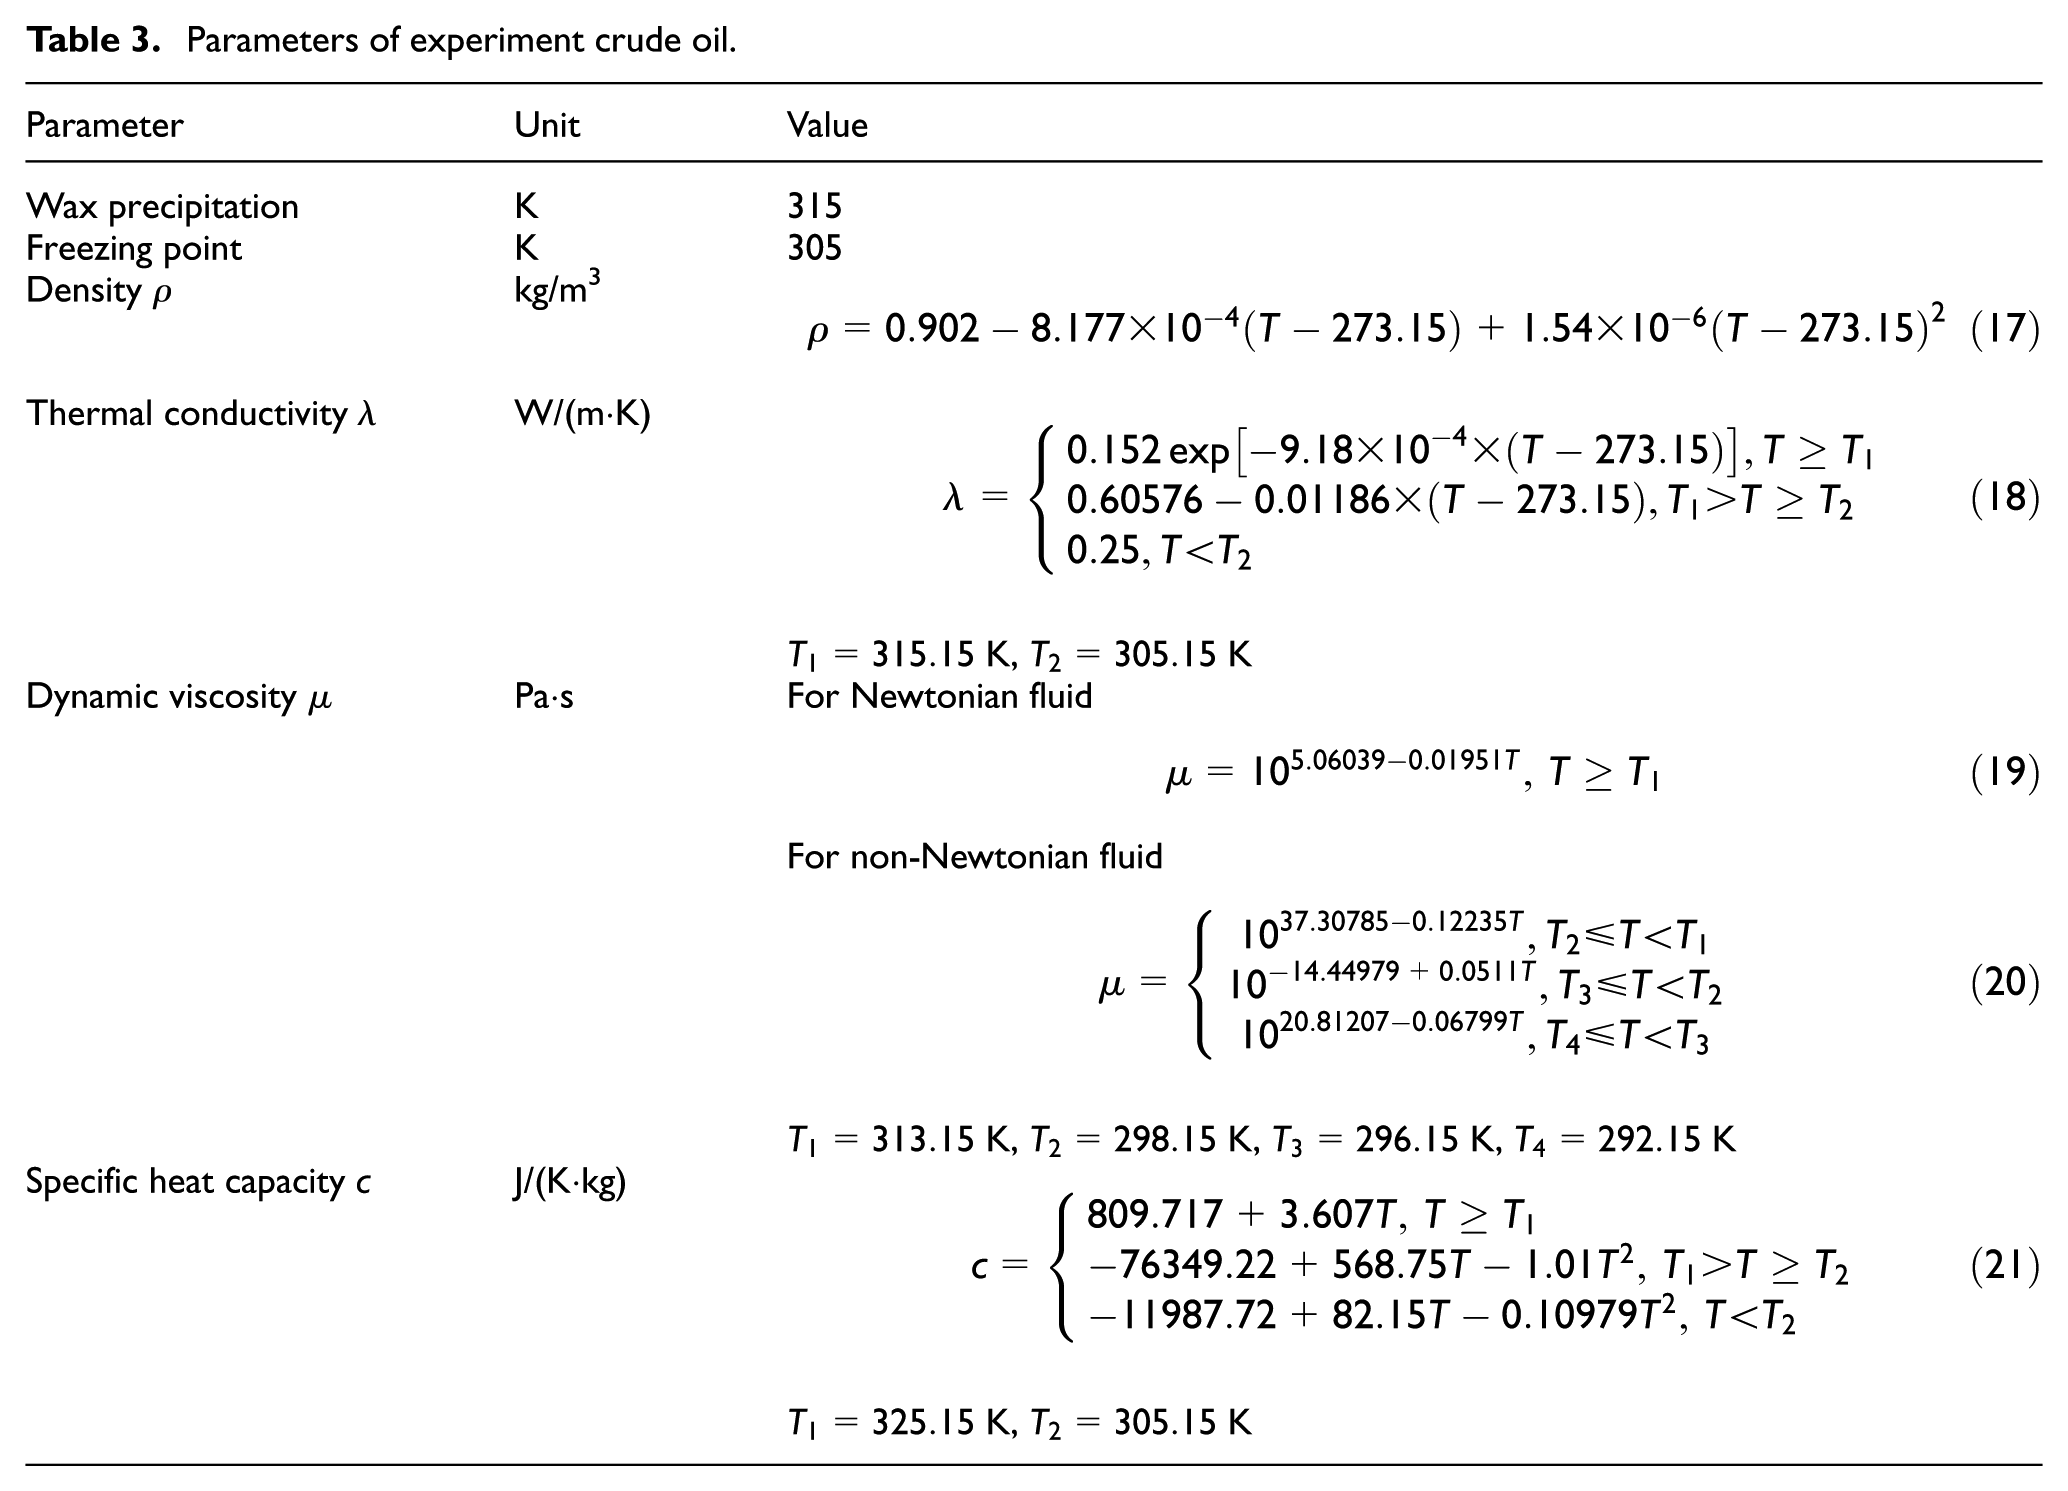
According to the specific conditions of the experimental pipeline, Gambit 2.4.6 software was used to establish a pipeline geometry model, generating 22,671 meshes using the ancient coin method. The outermost layer of the pipeline was set to the third kind of boundary conditions, the atmosphere temperature was given by formula (16), the heat transfer coefficient was 25 W/(m2 K), and the surface emissivity was 0.9. There was a coupling boundary between the inner surface of the pipeline and the crude oil. The crude oil properties were used as shown in Table 3; the values with temperature variation were written using C Language programs and imported into the software. The SIMPLE algorithm and
Results and discussions
The simulation and experimental results are shown in Figure 2. It can be seen that there is good agreement with a maximum relative error of 3.14%. Thus, the model can be used to discuss the influence of oil properties (such as density, conductivity coefficient-k, viscosity, and specific heat) on heat and mass transfer processes and the temperature field; the liquid–solid interface position can be obtained by FLUENT software. Next, crude oil, with its variable properties and influence on shutdown time, is used as a simulation test case with an initial oil temperature of 333 K. Its physical properties are listed in Table 3.

Comparison of simulation results and experimental results.
Influence of oil density on the oil temperature field
In different density conditions, the oil temperature drop curves at the pipe center are shown in Figure 3; the solidification cloud charts for different density crude oil are shown in Figure 4. The oil temperature distribution in pipe is symmetrical on Y axis, so take half of the pipe to compare.

Temperature drop curve of pipe center oil for different density.
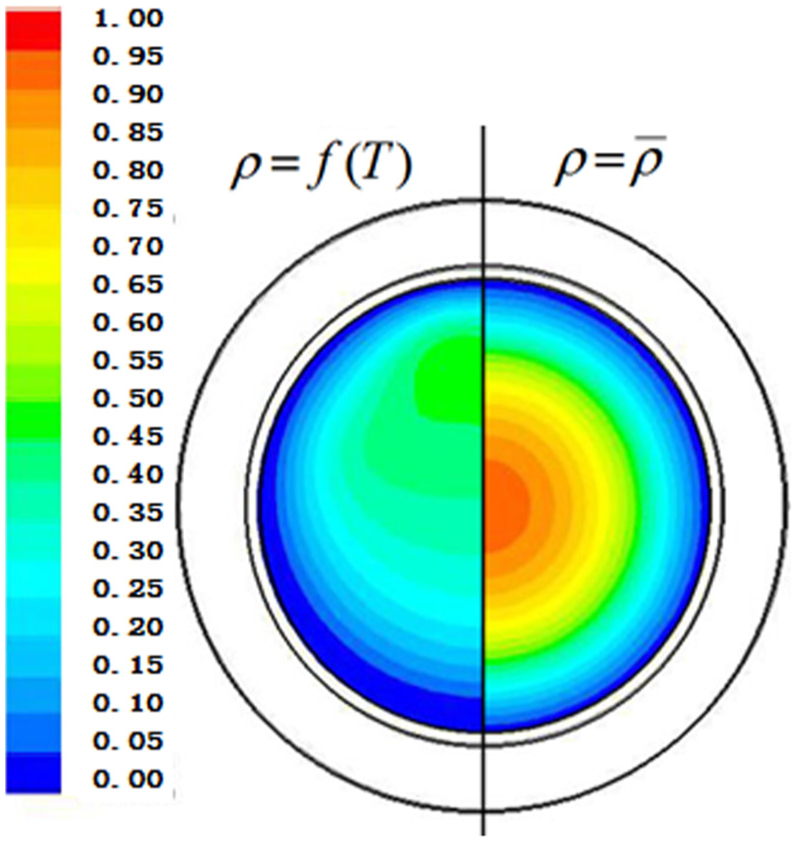
Solidification cloud charts for different density crude oil.
As Figure 3 indicates, when the fluid density is held constant at an average value (
In these figures, when the density is set to a constant average value, the oil temperature drop gradient in the pipe center is nearly steady: as there is no density difference, there is no natural convection, which means there is only heat conduction in the crude oil pipe. Therefore, as shown in Figure 4, the temperature field of liquid oil is symmetrical about the pipe center. When oil density is temperature-dependent, because of heat transfer from the oil to the environment, the oil temperature around the inner wall of the pipe is less than that in the pipe center. As hot oil goes up and cold oil goes down, the solidified layer first appears at the bottom pipe wall. When the influence of heat convection is taken into account, the oil in the pipe experiences a rapid dissipation of heat and the temperature falls faster, and the solidification time of the oil at the pipe center is shortened.
Influence of oil thermal conductivity on temperature field
Taking the experimental crude oil in Table 3, for example, it is a light oil and its thermal average and temperature-dependent thermal conductivity is
For different thermal conductivities, the simulation results of temperature drop of the oil at the pipe center are presented in Figure 5. The crude oil solidification cloud charts of the pipe are shown in Figure 6.
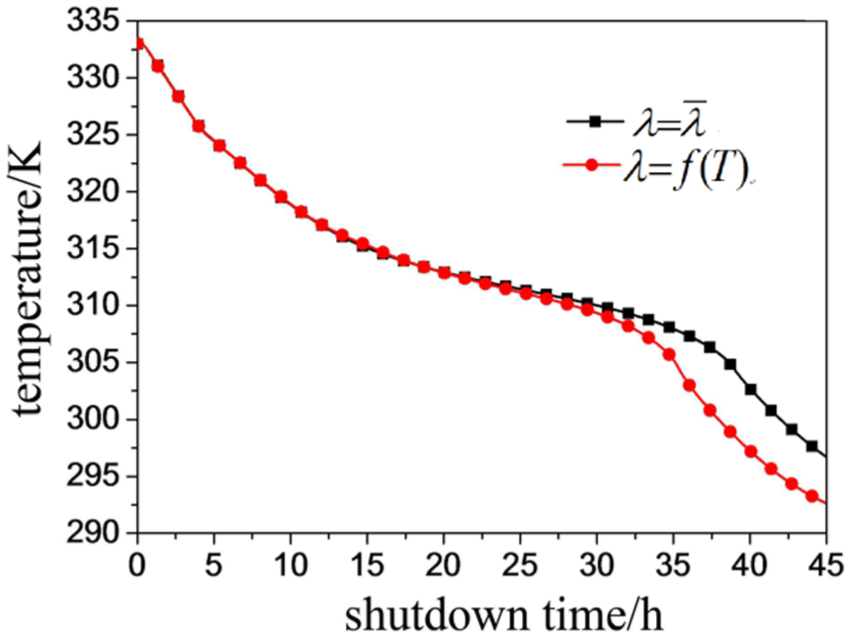
Temperature drop curve of pipe center for oil with different conductivity.

Solidification cloud charts for crude oil in different conductivities: (a) 20 h after shutdown and (b) 30 h after shutdown.
From Figure 5, we know that before the oil temperature drops to about 312 K, the temperature drop curves overlap each other. In this stage, the influence of the thermal conductivity change with temperature is small. When the temperature drops below 312 K, the two temperature curves separate and the curve slope with
In Figure 6, for an overhead pipe, when the shutdown time is 20 h, the solidification cloud charts are basically the same; when the shutdown time is 30 h, the positions of the solidification interfaces are obviously different. This is due to natural convection when the oil is in a liquid state. As time goes on, the oil begins to gelatinize and the natural convection fades away, and the influence of the heat conduction plays an increasingly major role in heat transfer.
Influence of oil viscosity on the oil temperature field
Oil viscosity affects the flow state of liquid oil, which can be controlled to affect natural convection. For a shutdown pipe, the range of the oil temperature drop is 333 to 305 K and the average value of oil viscosity (

Temperature drop curve of pipe center for oil with different viscosities.
In different conditions, the curves are almost same. The difference in oil solidification time at pipe center is negligible. Thus, for numerical simulation, the change of viscosity with temperature can be ignored.
For Daqing oil field, in different blocks, the oil viscosities (

Temperature drop curve of pipe center in different
For oil from different blocks of the Daqing oil field in Heilongjiang Province, China, the oil viscosities (
Influence of oil specific heat capacity on oil temperature field
With the drop of oil temperature, wax-appearance latent heat is released and the specific heat capacity increases significantly: its relationship c = f(T) is given by formula (21). When the wax-appearance latent heat is ignored, oil specific heat c can be set as a constant (

Oil temperature drop curves of pipe center in different specific heat capacity conditions.
As shown in Figure 9, when wax-appearance latent heat is ignored, the temperature drop gradient is larger. When wax-appearance latent heat is taken into account, the process of shutdown can be divided into three stages according to the rate of temperature drop at the pipe center. When the temperature decreased from 333 to 325 K, the temperature difference was large between the crude oil and the pipe inner wall, and convection was significant; the temperature gradient was large in this stage. However, with an increasing condensate reservoir thickness and decreasing temperature difference, the overall trend of temperature drop becomes slow. When the temperature is between 325 and 310 K, the temperature gradient becomes small due to the release of wax-appearance latent heat at 325 K and its delay of the crude oil temperature drop. Especially at about 315 K, the temperature gradient was small; this may be due to the fact that the wax in crude oil has about 20 carbon atoms. Also at this time, the latent heat release reached a peak, which can make the temperature drop to slow down. When the temperature of crude oil was less than 310 K, the latent heat release decreased significantly and the temperature gradient increased again. Compared with the constant value specific heat, the allowance shutdown time of variable specific heat was increased by about 22 h.
Conclusion
In this article, physical and mathematical heat transfer models of crude oil in shutdown overhead pipelines have been established. Temperature and flow fields, as well as the solidification cloud in the pipe, can be obtained. The effects of crude oil’s variable physical properties (density, viscosity, k-factor, and specific heat) on temperature distribution and shutdown time have been investigated. The main conclusions are as follows:
When the oil density is held constant at its mean value,
The results show that whether the thermal conductivity is held at the mean value
The effect of viscosity on the temperature distribution in the radial direction of the pipe is very small.
Because of the release of wax, the specific heat capacity of the crude oil has obvious variation. In this stage, the temperature drop changes slowly, and compared with that when specific heat capacity is held constant, the allowance shutdown time is longer.
Footnotes
Academic Editor: Oronzio Manca
Declaration of conflicting interests
The author(s) declared no potential conflicts of interest with respect to the research, authorship, and/or publication of this article.
Funding
The author(s) disclosed receipt of the following financial support for the research, authorship, and/or publication of this article: This work was supported by the National Natural Science Foundation of China (nos 51534004 and 51176024), special funds for scientific research of Hei-Longjiang Education Department within the program (grant no. 2016YSFX-02), and the Natural Science Foundation of Heilongjiang Province (no. ZD2015011).