
Abstract
Aiming at addressing the load behavior of iron ore particles in a ball mill, a design of experimental method was used to define a series of discrete element method simulation conditions with two factors being the mill speed and lifter height. The key feature locations of impact toe, bulk toe, shoulder, and head positions were identified visually to determine the load behavior of the charge. To allow the irregular particle shape to be accurately determined, a quick and accurate sphere-clump method was employed in modeling the geometrical model of irregular shape. The results show that the dependence of the impact toe and head on mill speed is higher than its dependence on the lifter height with a correlation of −0.923 and 0.97, respectively. The shoulder changes approximately invariant with the mill speed and varies little with the lifter height. The bulk toe of particles appears to be invariant to the mill speed as well as the lifter height, resulting in the approximately same inclination of the chord joining the shoulder and bulk toe.
Keywords
Introduction
Iron ore is the primary source for iron- and steel-making industries, which use the tumbling mills for further comminuting to get the required particle size distribution. Establishing power equation of tumbling mill has been investigated intensively for many years. Many researchers assumed that the en-masse mass was located below the line joining the toe and shoulder and the power equation was established on the basis of torque–arm principle.1,2 The method provided a concise assumption that incorporated all active charge into a point. The size between mill center and this point was the key feature to determine the mill power, while this size was intimately related to the load behavior of the charge. 3 Currently, the key location features (impact toe, bulk toe, shoulder, and head position) were extensively adopted to represent the charge behavior, which provided an elegant description to determine the load behavior quantitatively.4,5
Generally, the charge inside the mills moves upward and reaches a force balance point (shoulder position). Subsequently, the charge flows downward with a typical trajectory from the shoulder, coming into contact with the liner as a cascading or cataracting style (toe position). Along this trajectory, the highest point of the liner that is in contact with the charge is called head position. Currently, with the application of large or steep lifters, the charge will throw higher and impact on the liner in a region above the toe position. The top of this direct liner impact region is usually called impact toe. 4 In the toe region, the highest point reached by the bulk of the charge is usually called the bulk toe. 4 To sum up, the positions of the four key features of the charge provide profound information about the current operation of the mill and can be employed in optimizing the mill.
It is well known that the lifter profiles hitherto extensively used in the semi-autogenous grinding (SAG)/autogenous grinding (AG) or the primary mills are lifter bars and trapezoid lifters. 6 Lifter plays a vital role in protecting the mill shell from wear due to its strong influence on the load behavior of charge behavior as well as the grinding efficiency. A portion of cataracting is used for increasing the impact energy for particle breakage, while a portion of cascading is used for the abrasion and attrition. Morrell 7 presented that the mill power was only dependent on the active charge, and the charge in the cataracting region had no impact on the mill power. And then a simplified charge shape, namely, crescent-like shape, was presented in his theoretical model of mill power draw. According to the theoretical model, the positions of toe and shoulder were strong dependence on mill fillings and speeds, while the positions of toe and shoulder appeared to be invariant to the liner shape. However, Powell and Nurick 8 have put forward that the power draw was not only closely related to the total mass of the charge rather than the active charge but also sensitive to the liner shape. Currently, Powell’s model has been tested by many scholars on the basis of PEPT (positron emission particle tracking).3,9,10 Hence, the power draw calculated by Morrell’s theoretical model is small. Currently, advances in computing speed and power as well as improvements in programming (such as particle tracking technology), the determinations of COC (center of circulation), and COM (center of mass of charge) have become the key parameters to study the power draw of mill.1,3,11 Therefore, the mill load behavior highly depends on the liner shape and should be studied accurately. As the lifter wears, the reduction in its dimensions definitely results in the variation of the impact toe, bulk toe, and the position of shoulder and head.12–14 Besides, many researchers demonstrated that the key location features are highly sensitive to critical mill parameters such as mill speed and filling.15–17 Therefore, it is of economic importance to address the influence of operating parameters and lifter profile on the load behavior. In China, the largest ball mill of 7.9 m in diameter and 13.6 m in length was developed and applied successfully in a mine. It is also intensively recognized that the wave lifter profile is widely used for the ball mill. However, little study has been addressed on the wave lifters.
In the last few decades, the discrete element method (DEM) has been successfully applied for describing the motion properties of particles, with many industrial applications ranging from chemical to metallurgy industries.18–20 In order to apply the powerful numerical method qualitatively, it is now intensively recognized that it is highly desirable for predicting what happened in reality as well as the quantitative accurate information representation. The exact definition of real particle shapes hitherto is one of the key issues to be solved. 21 Many investigators employed the simple spherical shape in the majority of DEM simulations to achieve a reasonable simulation time, whereas it is apparent that the shortcomings of unrealistic simplifications and assumptions are also clear. These simplified models are an unrealistic measure on both the physical properties and contact parameters, as well as poor particle representation on packing characteristics. In ball milling, the geometrical shapes of iron ore particles are highly irregular because of the breakage behavior. Therefore, modeling the contact model with irregular shape is essential and worthwhile for DEM simulations. Along with the fast development of X-ray and image processing technique, the multi-element spheres method has been used successfully to represent the geometrical model of irregular iron ore particles.22–24 To achieve an accurate representation of particle shape, a large number of spheres are used for describing information about the details. Due to computing considerations, there are some limitations in the current state of the art for DEM software especially for industrial application. In particular there are restrictions on shape of particles that can realistically be modeled. 25 Therefore, considering the accuracy in describing the shape of iron ore particles and computational effort, the appropriate geometrical shape of irregular particles should be carefully modeled.
This article aims to study the influences of mill speed and wave lifter profile (wear state) on the load behavior for a given mill filling. A design of experimental method, namely, central composite design, was used to provide a series of DEM simulations that were conducted on a two-dimensional (2D) mill. To allow the irregular particle shape to be accurately determined, a quick and accurate sphere-clump method was employed in modeling the geometrical model of irregular iron ore particles, and the changes in the four key features with mill speed and wave lifter profile were studied, which supplies the basis data for lifter design in the pre-design stage.
DEM model
In this study, the nonlinear model, namely, no-slip Hertz–Mindlin model, was employed to figuring the contact force between particle systems within the software EDEM because of the accurate representation of the physical situation and less computational effort. In EDEM, any kind of irregular geometrical shape of particles can be generated as a clump composed of several touching or overlapping balls. 25 Therefore, the contact detection between the sphere clumps is sphere-based, and therefore, the discrete element algorithm of the sphere clumps is fully available for calculating the contact forces.
According to Newton’s second law of motion, the translational and rotational motions of particle j (Figure 1) can be expressed as 26


where mj, vj, wj, and Ij are mass, velocity, angular velocity, and moment of inertia of particle j, respectively;
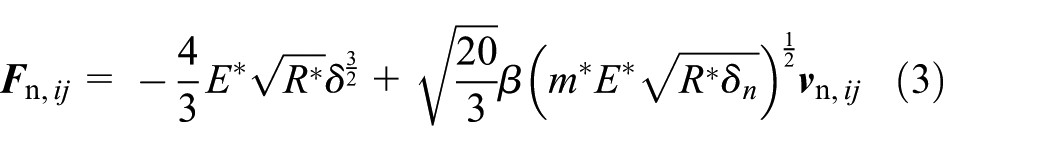
where E* is equivalent Young’s modulus,

The illustration of the contact forces between particle i and particle j.
Methodology
Mill geometry and operating conditions
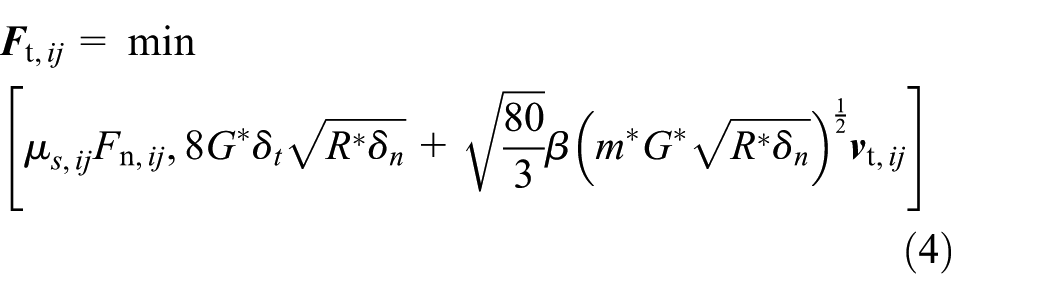
In this study, the specifications of the mill geometry, summarized in Table 1, were constructed to address the effect of mill speed and lifter height on the load behavior under the given fill level. The lifter profiles used in this study were single wave and the variation of lifter height represented the wear states from new lifters to worn lifters (wear cycle). The highest lifter had the height of 30 mm, whereas the shallowest lifter had the height of 10 mm, as shown in Figure 2.
The configuration of experimental mill.
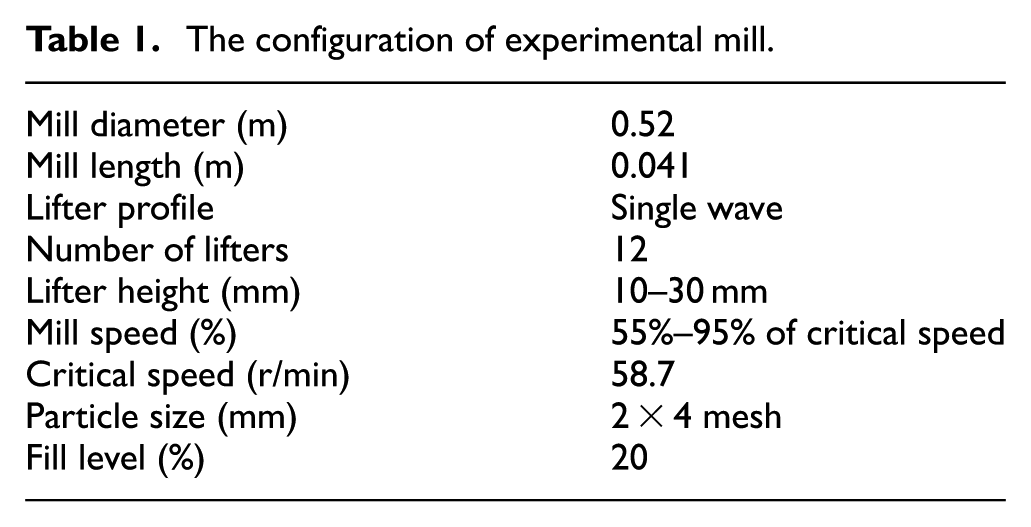
Sketch of lifter profiles.
Due to computing considerations, there are some limitations in the current state of DEM software. In particular there are restrictions on particle size and shape that can realistically be modeled. In this work, the geometrical shapes of iron ore particles were estimated on the basis of sphere-clump method. During the DEM simulations, the average time spent on each numerical calculation was approximately 12 h. In the event that the optimized numbers of DEM simulations are desired, a design of experimental method, namely, central composite design, was used to minimize the number of DEM simulations and was conducted to determine the load behavior affected by mill speed and lifter worn states. In this study, for a two-parameter investigation, central composite design is an elegant method to optimize the number of simulations. For the central composite design, five different mill speeds and five different lifter heights were needed to perform on the mill. The lifter heights ranged from 10 to 30 mm and the mil speeds ranged from 55% to 95% of critical speed were selected to determine the desired intermediate values. Based on the central composite design method, 12 experimental schemes were addressed with the same filling level (20%) and the same mono-sized particle size (2 × 4 mesh), as shown in Table 2. Four center-point repeats, namely, 20 mm in height and 75% of critical speed in mill speed, were included to represent the simulation error.
Twelve DEM simulations using central composite design.

DEM: discrete element method.
Arguably, the key aspect of the no-slip Hertz–Mindlin model is to provide the quantitative contact parameters between particle–particle and particle–wall, that is, coefficient of restitution, the coefficient of static friction, and the coefficient of rolling friction, besides the mechanical properties of iron ore particles. Researchers found that the collision parameters were highly sensitive to some key factors such as particle shape, drop height, and material properties.28–30 Therefore, the ranges of collision parameters were obtained on the basis of different experimental methods. First, the mechanical properties of particles and liner were measured based on the testing machine (the measurement of mechanical properties of particles was repeated five times). The coefficient of restitution was estimated on the basis of drop particle tests, in which individual iron ore pellets were allowed to free-fall under gravity with the aid of a vacuum release system against a target surface. Then, the heights of rebound were recorded, and therefore, the coefficient of restitution can be calculated. The static friction coefficients were measured on the basis of pin-on-disk tribometer tester. The rolling friction coefficient between particle and liner was measured on the basis of inclination tests. The rolling friction coefficient between particle and particle was determined on the basis of the swing-arm slump test. Finally, the contact parameters were measured, and the “sand-pile calibration” was used to calibrate the measured parameters. However, in most cases, the DEM simulations were conducted using the mid-range values. 4 In this study, the density and shear modulus of iron ore particles were 4415 kg/m3 and 2.73 GPa, respectively. The particle size ranged from 8.5 to 5 mm with the average size of 6.75 mm. The restitution coefficient was 0.49, and the static friction coefficient was 0.48. The rolling friction coefficient was hard to measure quantitatively, and the result was summarized at 0.02 from the literature. 22
Sphere-clump methods
In this study, the required mono-sized iron ore particles (2 × 4 mesh) were first sieved on the vibrating screen for different times such as 1, 3, 5, 10, 15, and 20 min. The results indicated that the mass was almost invariant after 10 min and therefore 10 min was used in this work. In mill processing, the particle shape is highly irregular because of the breakage behavior and grinding. Researchers have proposed that the sphericity was the major physical parameter to characterize the particle shape, 23 giving

where SArp is real surface area of the iron ore particle and SAes is the surface area of the equivalent sphere with the same volume of the real particle
In the event that more accurate shape representation was desired, an automatic method for generating sphere-clump model of real particles was carried out to approximate the desired shape. The elegant software, named Automatic Sphere-clump Generator (ASG), was employed to realize this method for generating a geometrical model that can be used in DEM simulations. The method is divided into two steps, sphere detection and sphere optimization. Sphere detection is used for populating the geometrical model with suitable spheres by means of a random selection process. After the clump initialization, the Levenberg–Marquardt nonlinear least-square method is carried out to optimize and minimize the distance between the clump’s surface and the original mesh. The Levenberg–Marquardt method is a standard technique used to solve nonlinear least-square problems. The Levenberg–Marquardt algorithm is the most widely used optimization algorithm. It outperforms simple gradient descent and other conjugate gradient methods in a wide variety of problems. The Levenberg–Marquardt algorithm is first shown to be a blend of vanilla gradient descent and Gauss–Newton iteration. In order to characterize the sphere clumps quantitatively, two parameters describing the error, namely, volume error and the percentage volume error (EIT error), are employed. EIT error shows the percentage average mass distribution error along the principal axes, and the volume error shows the percentage volume error. The volume error is expressed by
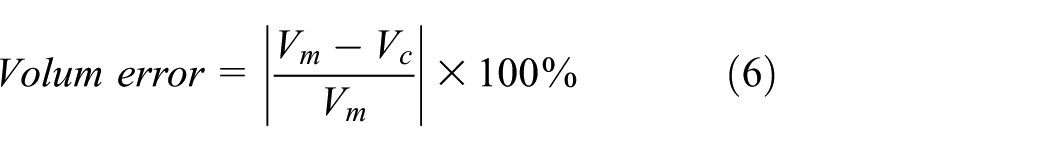
where Vm is the mesh volume and Vc is the sphere-clump volume.
Assuming the mono-sized particles consisted of two typical particles, the geometrical model of iron ore particles was generated using the sphere-clump method, as shown in Figure 3.

The geometrical model of iron ore particles (30 spheres).
Results and discussions
Particle shape estimation
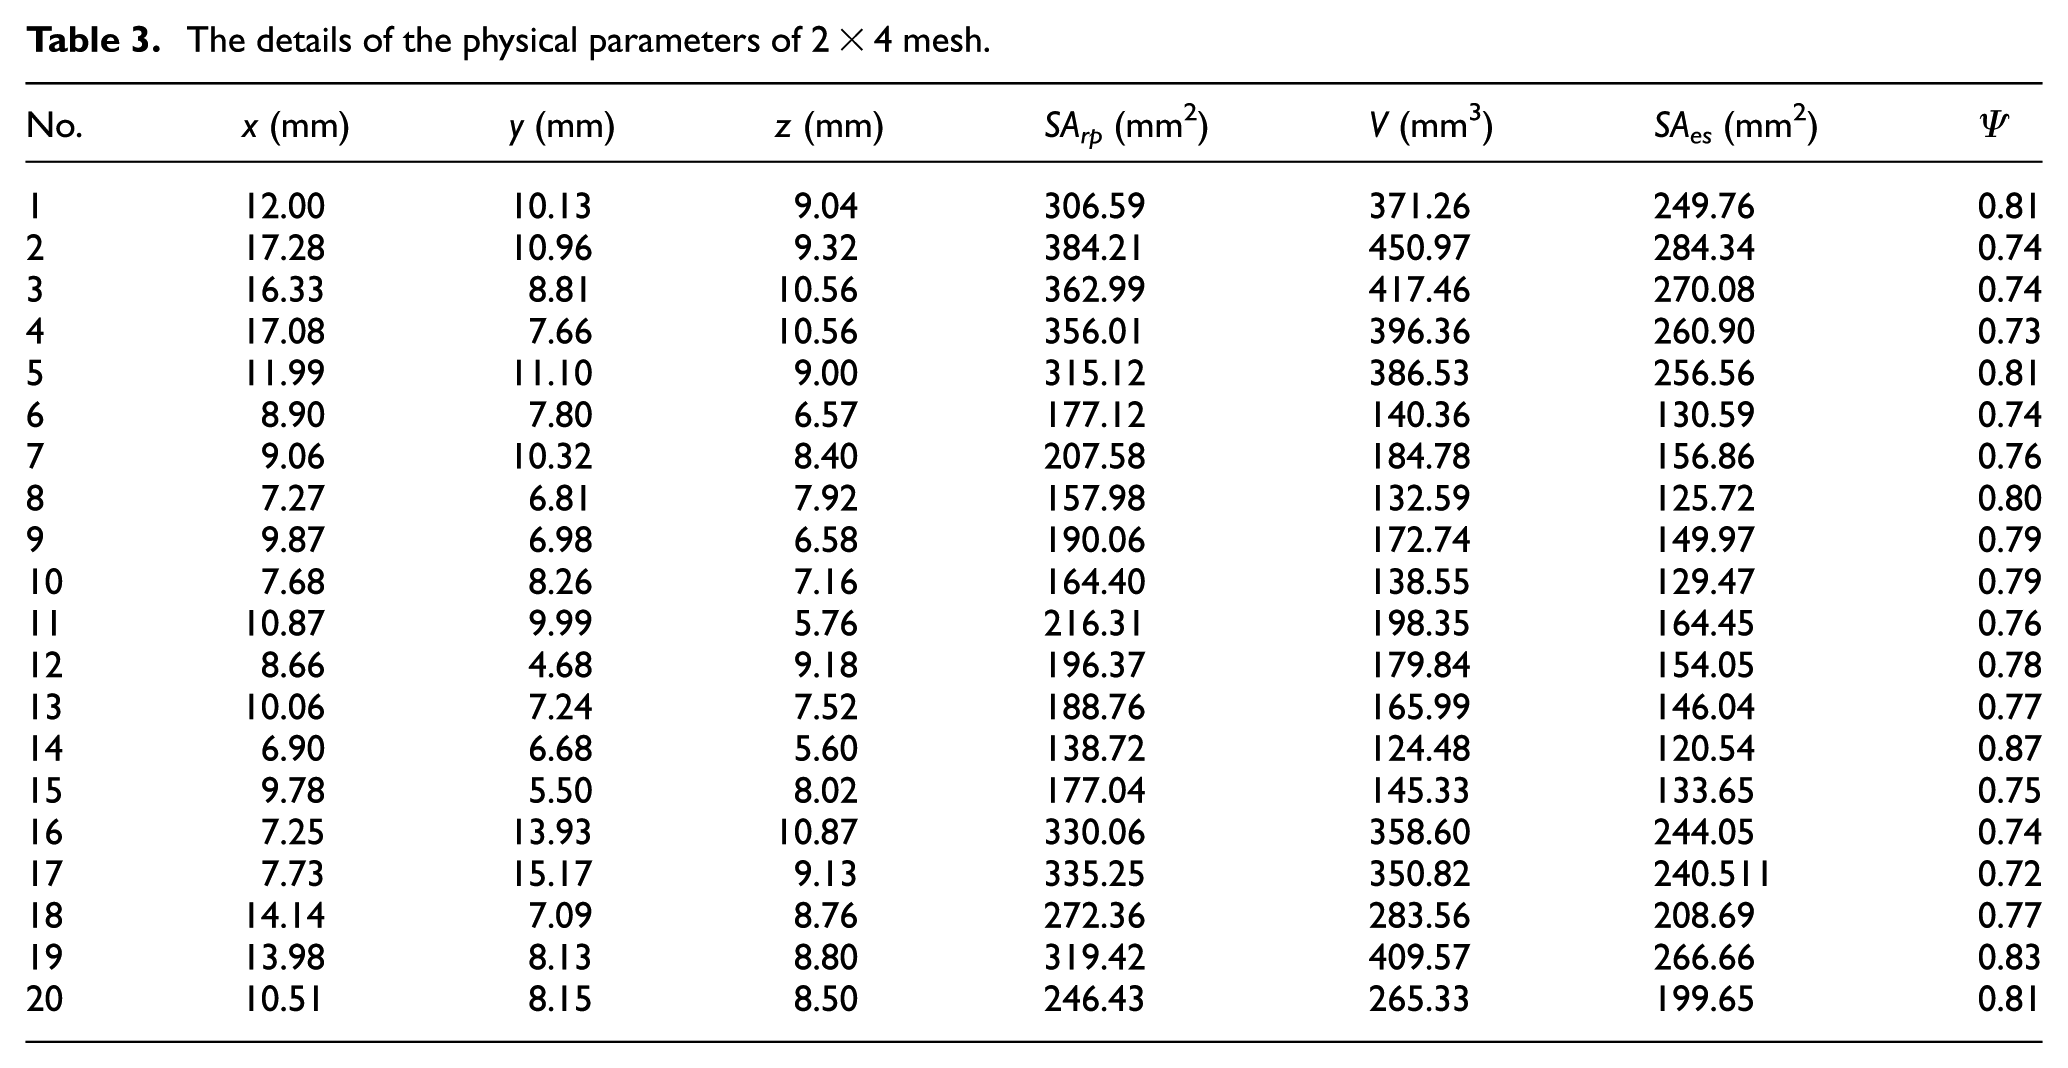
In an attempt to represent the particle shape accurately, 20 particles are selected to determine the sphericity of 2 × 4 mesh particles. The details of the physical parameters are given in Table 3. From the data in Table 3, the average sphericity calculated from the 20 particles is 0.776, which is quite irregular comparing with the sphere so that the simplifications and assumptions of irregular particle as simple spherical shape are unrealistic.
The details of the physical parameters of 2 × 4 mesh.
In the event that the more accurate representation and less computational effort expense are desired, the geometrical model of iron ore particle shape is conducted using the sphere-clump methods. Assuming the mono-sized particles consisted of two typical particles, the geometrical model of iron ore particles was generated as shown in Figure 4. Research works show that the accuracy of irregular iron ore particles increases with an increase in the number of elements. In an attempt to obtain the appropriate number of sphere clump, different numbers of sphere clump are selected and the results are summarized (Figure 4).

The geometrical model of iron ore particles with various number of sphere clumps.
As can be seen in Figure 4, it is interesting to see that the accuracy in describing the geometrical shape of iron ore particles increases with an increase in the number of spheres, which will require more computational effort. Therefore, considering the accuracy in describing the shape of iron ore particles and computational effort, the appropriate sphere-clump numbers should be carefully selected on the basis of volume error and EIT error.
Figure 5 shows the volume error and the percentage average mass distribution error along the principal axes affected by the number of spheres. It is also evident from Figure 5 that the change in volume error and EIT error with number of sphere clumps decreases dramatically and then remains approximately unchanged. Once the number of sphere clump is greater than 10, the maximum volume error and EIT error are 1.1% and 1.4%, and the minimum volume error and EIT error are 0.1% and 0.2%, respectively. Hence, to achieve computational accuracy without increasing the amounts of calculation, the geometrical model used in the work is a cluster of 10 spheres.

The change in volume error and EIT error with number of spheres.
Key feature locations identification
In order to describe the load behavior accurately, four key feature locations, namely, impact toe, bulk toe, shoulder, and head positions, were conducted using the visualizations of the charge shape and streak patterns. The streak patterns are the streamlines which represent the trajectory of each particle at a certain time interval. By definition, the impact toe is the location where the highest trajectories in the cataracting stream intersect the liner. The bulk toe is the location where the highest position is reached by the bulk of the particle in the toe region. The shoulder position is the location where the trajectory of particles is going to diverge from the mill. The head position is the point where the highest point of the particle trajectory that is still in contact with the liner. As is shown in left-hand side of Figure 6, the normal display of EDEM particles is employed to determine the bulk toe and shoulder position. However, the streamline display of the trajectory by tracing the particle position makes it easier to determine the impact toe and head position, as shown in right-hand side of Figure 6. The positions of these features are listed in a counterclockwise motion from six o’clock position, as shown in Figure 6.

Schematic of trajectory showing four key feature locations.
Cases 3, 6, 9, and 12 represent the four center-point repeats conditions. There has a fine distinction between the four key feature locations because of the particle probability distributions caused by the working mechanism of DEM software. There is small difference between the impact toe and the bulk toe with the location ranged from 340 to 342. The shoulder position is located in the range of 111–113, while the head position is always above the shoulder ranged from 124 to 125. Hence, the average values are used for studying the load behavior of iron ore particles.
Figure 7 shows the influence of mill speed on the four key feature locations (impact toe, bulk toe, shoulder, and head positions) for three various lifter heights. As can be seen in Figure 7(a), the impact toe is clearly a strong function of the lifter height. For lifter height larger than 2/3 of the new lifter, the impact toe decreases evidently with the mill speed, but for the lifter height of 12.93 mm, the impact toe is invariant with mill speed. The lifter height of 20 and 27.07 mm has the ability to throw up the particle higher than the case for the height of 12.93 mm. Figure 7(b) presents the variation of bulk toe as a function of three different lifter heights. The bulk toe at the height of 12.93 mm is slightly higher than the case for the other height resulting in less able to slow the cascading flow of the charge down to the toe region. The bulk toe changes approximately invariant with the lifter height, and the nature of this dependence is basically the same with lifter height so that the dependence of the bulk toe on mill speed can be neglected. Figure 7(c) shows the location of the shoulder for mill speed for three various lifter heights. The change in shoulder with mill speed is approximately invariant for three different lifter heights, and the height of 20 and 27.07 mm can lift the particles higher than the case for height of 12.93 mm. Hence, the shoulder is weakly sensitive to the mill speed. Figure 7(d) presents the variation of head plotted against the mill speed for three different lifter heights. It changes approximately linear with the mill speed and moves higher as the mill speed increases. The lifter height of 20 and 27.07 mm is able to lift the head position higher than the case for the height of 12.93 mm due to the reduction in the amount of cataracting particles.

Effect of mill speed on the four key feature locations: (a) impact toe, (b) bulk toe, (c) shoulder, and (d) head.
Figure 8 shows influence of lifter height on the four feature locations (impact toe, bulk toe, shoulder, and head positions) for three various mill speeds. Figure 8(a) presents the location of the impact toe for varying lifter height for three various mill speeds. The impact toe at the mill speed of 60.86% and 75% varies little with the lifter height, while it decreases linearly with an increase in the lifter height. The higher mill speed has the potential to lift the charge more higher resulting in more particles cataracting. Figure 8(b) shows the variation of the bulk toe as a function of lifter height, and the mill speed has only a weak effect on the bulk toe for three different mill speeds. Figure 8(c) presents the location of the shoulder for varying lifter height, and the shoulder increases slightly linear with the lifter height, but the difference of three curves is approximately the same. Figure 8(d) presents the variation of head plotted against the lifter height. It is evident that the head increases linearly with an increase in the lifter height, and there is a strong sensitive to the variation of mill speed. The charge can be lifted higher with higher lifter height as well as the higher mill speed.
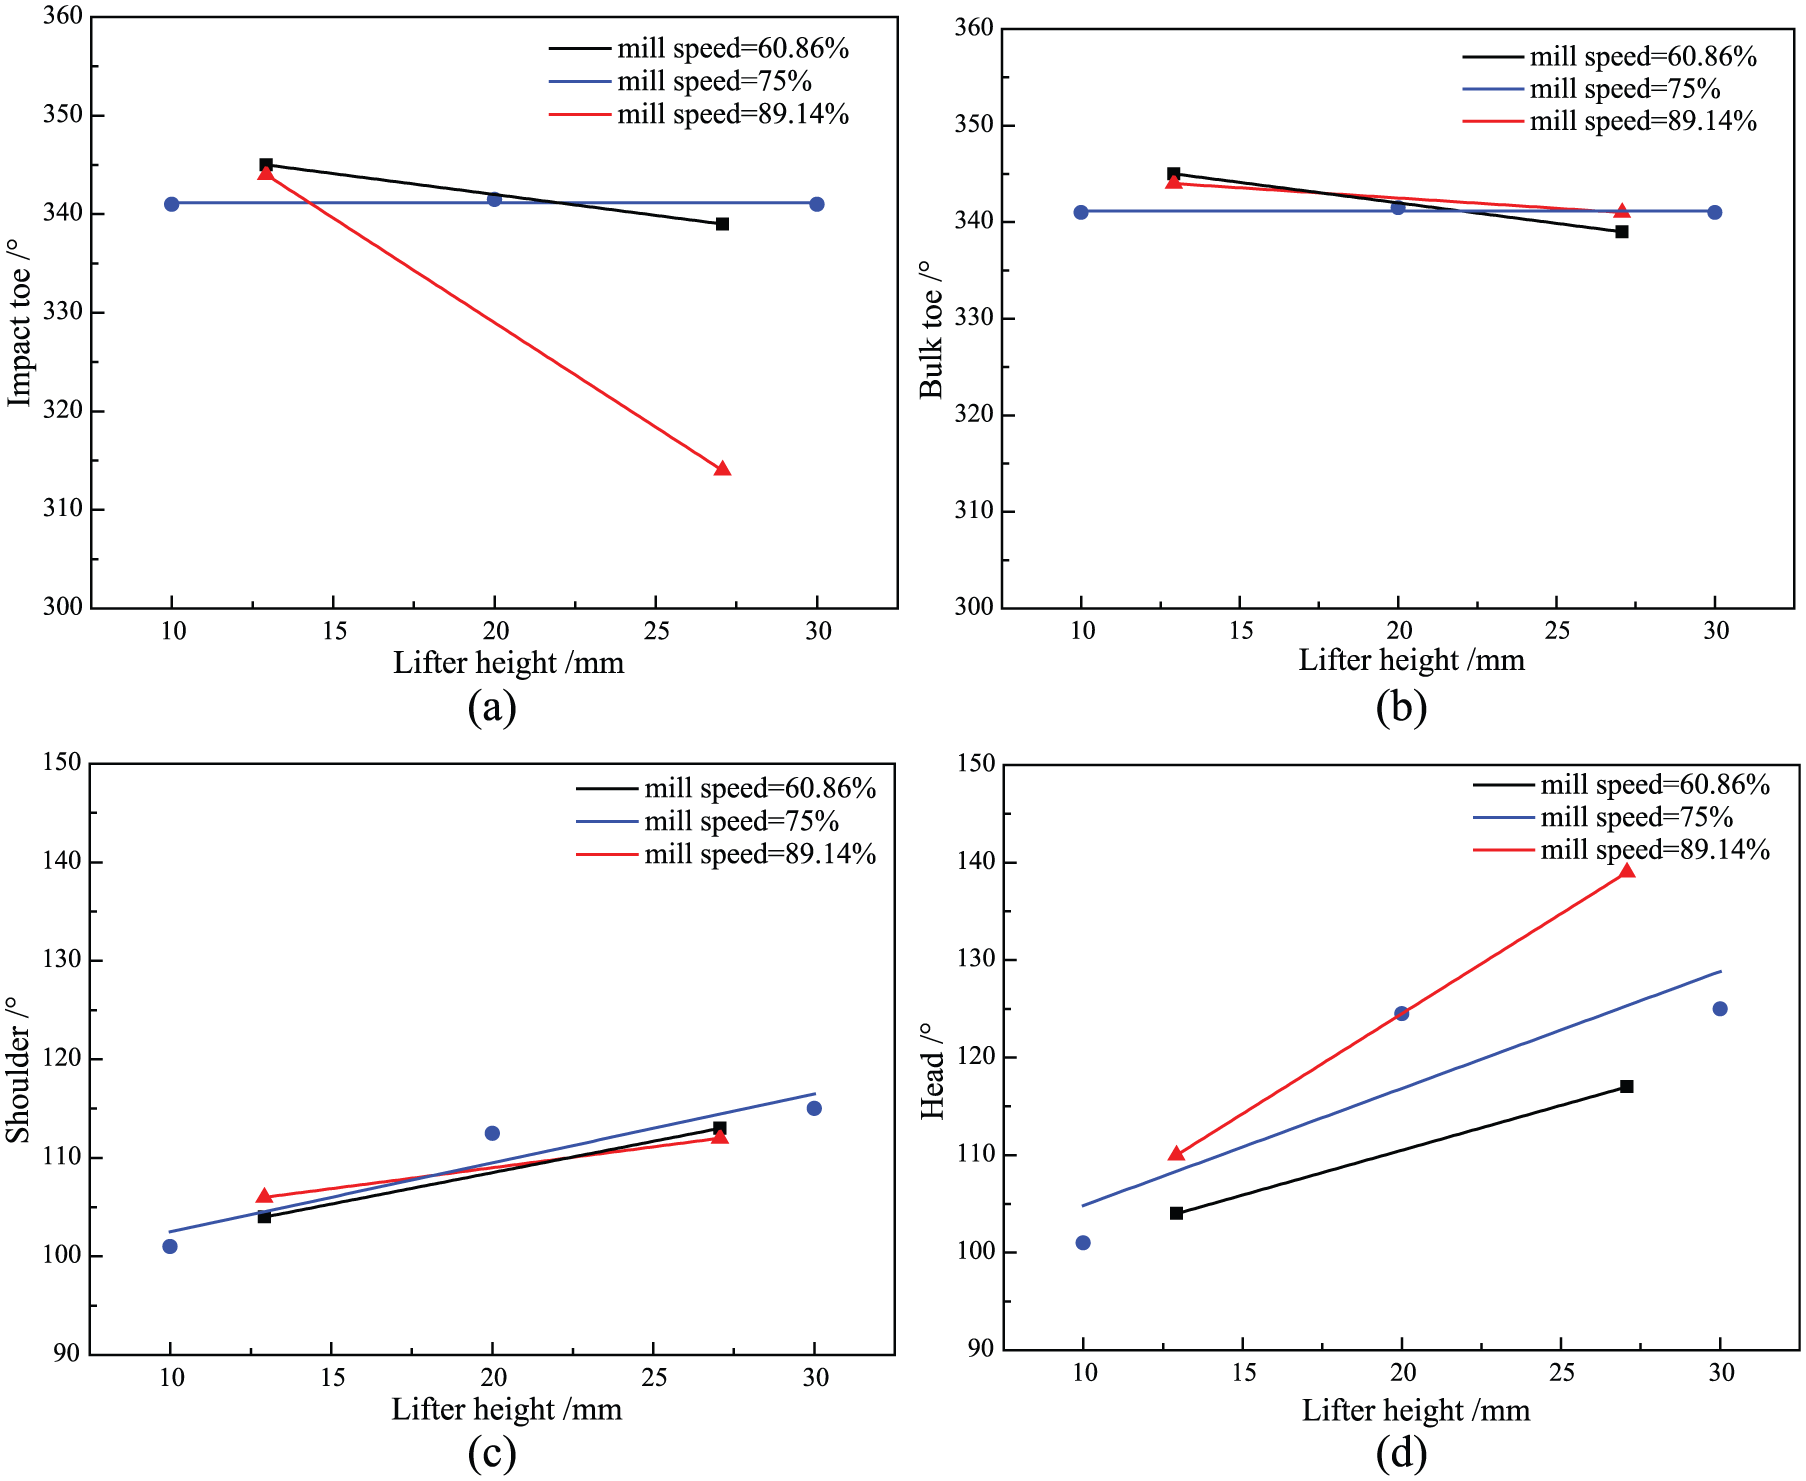
Effect of lifter height on the four key feature locations: (a) impact toe, (b) bulk toe, (c) shoulder, and (d) head.
As shown in Figures 7 and 8, the results can be used to comprehend the load behavior under various wear statuses of wave liner. Besides, the determination of four features can help us install the acoustic sensor and acceleration transducer for measuring the charge motion in the proper position in the industrial mill and experimental setup. The DEM simulations in this study can be well employed in optimizing the wave liner design in the pre-design stage.
To sum up, based on the correlation analysis, the relationship between the four key features and input parameters is addressed. The dependence of the impact toe on mill speed is higher than its dependence on the lifter height with a correlation of −0.923, which means increasing the mill speed decreases the position of impact toe. The correlation of the dependence of the head on mill speed is 0.97, which is slightly higher than the dependence on the lifter height with the correlation of 0.875. Once the lifter height has been worn out outweighing 2/3 of the new lifters, the influence will become meaningless. The shoulder changes approximately invariant with the mill speed. The dependence of the shoulder on lifter height is slightly higher than its dependence on the mill speed. The bulk toe of particles appears to be invariant to the mill speed as well as the lifter height so that the influence can be neglected. Therefore, the inclination of the chord joining the shoulder and bulk toe is approximately the same but the mass that lies on the chord varies the influence of lifter height and mill speed, as shown in Figure 9.

The stream of the particles for case 2, case 4, case 7, and case 11.
Conclusion
In this study, the sphere-clump method is employed to determine the geometrical shape of the mono-sized (2 × 4 mesh) iron ore particles. The average sphericity calculated from the 20 particles is approximately 0.776, which means quite irregular comparing with the sphere so that the simplifications and assumptions of irregular particle as simple spherical shape are unrealistic. Based on the sphere-clump method, the three-dimensional (3D) shape of iron ore particles with a cluster of 10 spheres not only represents the geometrical shape trustworthily but also decreases the computational effort evidently. Subsequently, a design of experimental method, namely, central composite design, is employed to determine a series of DEM simulations. The influences of lifter height and mill speed on the impact toe, bulk toe, shoulder, and head position are determined to assess their impact on the load behavior of iron ore particles in a ball mill. The impact toe and head are highly sensitive to mill speed and filling. With an increase in the mill speed and lifter height, the impact toe decreases approximately linear, while the head increases evidently. However, the impact of mill speed plays a primary role on impact toe and head that is the case for the lifter height. The shoulder changes approximately invariant with the mill speed and varies little with the lifter height. The bulk toe of particles appears to be invariant to the mill speed as well as the lifter height, resulting in the approximately same inclination of the chord joining the shoulder and bulk toe. It is interesting that varying the mill speed over the range considered does not lead any obvious variation in the four key features once the lifter has worn out over two-thirds. Correspondingly, the ball mill has to replace the worn lifters. Therefore, determining the impact of mill speed and lifter on the load behavior of iron ore particles in a ball mill not only potentially facilitates the improvement in high-performance liners but also optimizes the mill speed in the pre-design stage.
Footnotes
Acknowledgements
The authors thank the Priority Academic Program Development of Jiangsu Higher Education Institutions (PAPD) and the Top-notch Academic Programs Project of Jiangsu Higher Education Institutions (TATP).
Academic Editor: Filippo Berto
Declaration of conflicting interests
The author(s) declared no potential conflicts of interest with respect to the research, authorship, and/or publication of this article.
Funding
The author(s) disclosed receipt of the following financial support for the research, authorship, and/or publication of this article: The research reported here was supported by the National Nature Science Foundation of China (Grant no. 51475458), the Jiangsu Postgraduate Scientific Research and Innovation Projects, and the Program for Changjiang Scholars and Innovative Research Team in University (IRT_16R68).