
Abstract
Sintering is an important phase of the iron-making chain, as it allows the usage of finer iron ore particles in the blast furnace whilst still maintaining furnace performance. An on-going challenge for sinter plants is to obtain higher productivity from their sinter blends, or maintain sinter productivity whilst using more financially attractive iron ores. One of the most effective means to reduced blend cost is to use a higher proportion of concentrated iron ores in the blend. The key characteristic of concentrated ores is that they have a finer particle size distribution (PSD) than traditional sinter feeds and are widely known to negatively impact sinter bed permeability and sinter productivity. In this study, various iron ore blends were used to demonstrate the effect that the PSD of the sinter blend has on granulation and subsequent sintering process parameters during laboratory-scale sintering. Particular focus was applied to the impact of the PSD of the layering material in blend (−0.5 mm). Cold bed superficial gas velocity (SGV) was correlated to the spread of the PSD within the layers around granule nuclei. Widening the PSD spread within the layer increased cold SGV due to a narrowing in the spread of the granule size distribution (GSD) and increase in mean granule diameter. The Fuller–Thompson (FT) blend exhibited increased SGV during sintering (hot SGV) which led to shorter sintering times. This was a result of an enhanced ‘hot SGV efficiency’ (a measure for the ratio of hot SGV to cold SGV) over what was anticipated based on the trend with mean granule diameter. Complete industrial blends were compared with blends designed to the FT equation at varying proportions of layering particles in the blends (−0.5 mm). At equal proportions of layering particles in the blends, the FT blends exhibited increased cold and hot SGV by up to 20% and 25%, respectively, and led to a maximum 10% decrease in sintering time. Further, blends designed to the FT equation enabled the incorporation of 4 wt-% more layering particles and still exhibited similar cold SGV, hot SGV and sintering times to the industrial blends.
Introduction
The agglomeration of iron ores into sinter is vital to blast furnace performance, as it maintains furnace permeability whilst allowing the usage of finer iron ore particles. Mixing and granulation before sintering converts the blend of raw materials into a granulated feed that can be sintered. Sinter blends consist of iron ores, coke breeze, fluxes, plant reverts, binder and return sinter fines, which are mixed before water is added for granulation in a continuously rotating drum. The key mechanism operating during granulation is the layering of finer particles around larger nuclei particles to create granules. 1 A microscopic image of a granule composing of a nucleus with layering particles is shown in Figure 1. Granulation enhances sinter bed permeability, which controls the rate the flame front can pass through the bed. 2 Thus, granulation and the resultant sinter bed permeability are key limiting factors in sintering process productivity and granulation is the process phase targeted in this study. In this article, the authors use the following terms with definitions as follows: (i) cold SGV; the superficial gas velocity (SGV) of the granulated mixture before sintering (ii) hot SGV; the SGV during sintering and we introduce a new term (iii) hot SGV efficiency defined as the ratio of hot SGV to cold SGV (expressed as %).
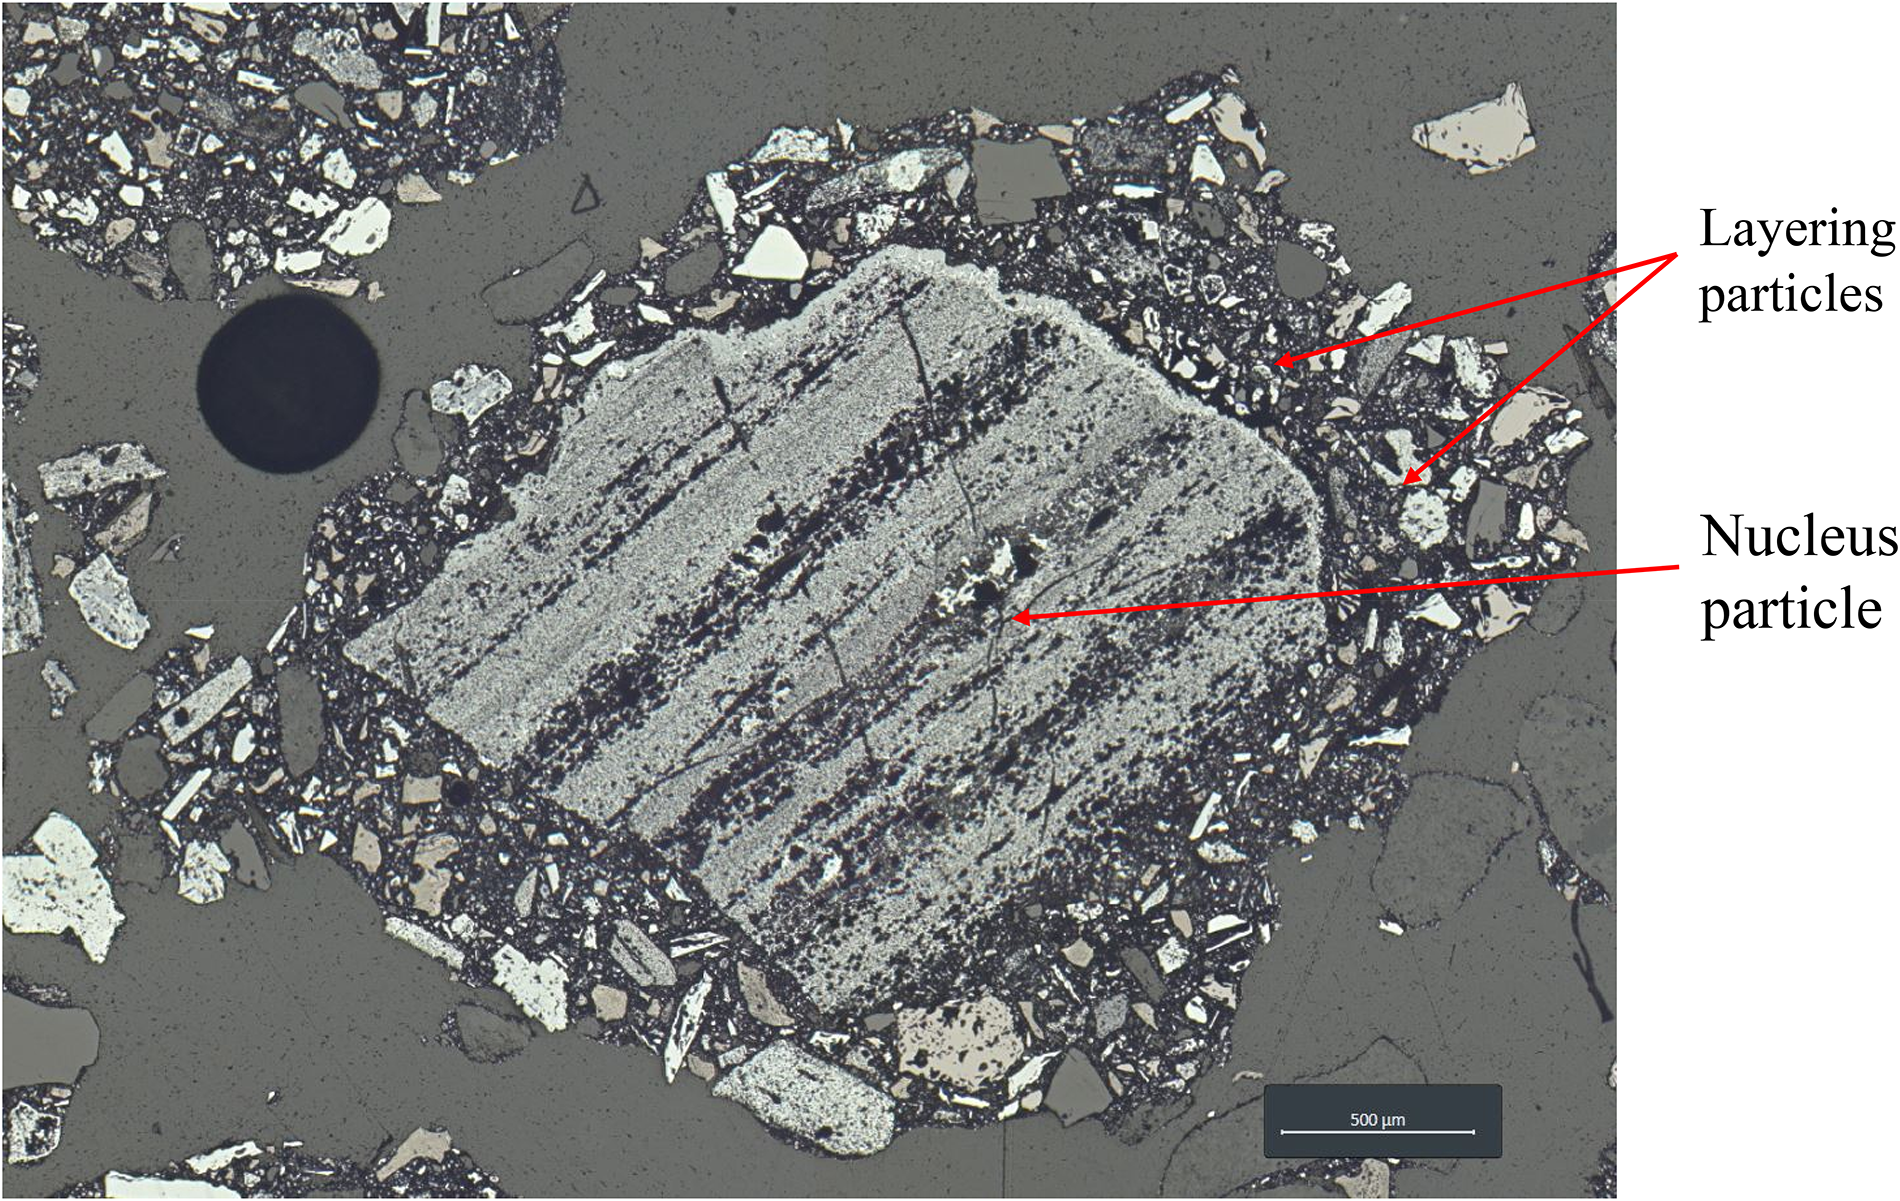
Microscopic image of granule showing the layering of finer particles around a larger nucleus.
The earliest granulation studies focused on understanding the influence of parameters including moisture, drum speed and residence time on granulation effectiveness.3,4 The major constituent of sinter blends is iron ore; Litster and Waters 1 conducted the initial studies on the impact of particle size distribution (PSD) on the granulation of iron ores. Litster and Waters proposed a measure for granulation effectiveness (X0.5), which could compare granule growth in blends with different PSDs. One of the key findings was that increasing the proportion of layering particles reduced the extent of granulation for a specific moisture content, however decreasing the mean layering particle size increased it. This emphasised the importance of not only the total blend PSD on granulation but also the PSD within specific size ranges. Other studies have taken this further to investigate the impact of iron ore PSD on sintering process parameters: bed permeability and strength.5–7 There have also been further attempts to model and predict bed permeability based on iron ore properties such as particle size categories and the SiO2 and Al2O3 contents.5,8,9 One of the key conclusions from these studies was that incorporating more layering particles in the blend negatively impacts granulation effectiveness and bed permeability. Thus, the key objective of this study was to investigate an approach based solely on optimising the iron ore PSD to create enhancements in sinter bed permeability and process productivity when using more layering particles in the blend.
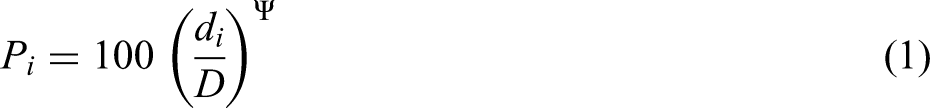
The Fuller–Thompson (FT) equation (1) was developed for designing the aggregate blends used in concrete, where blends with PSDs that fit the FT equation provided increases in material properties such as strength and durability.10–13 Pi is the percentage less than the particle size di, D is the maximum particle size of the distribution and Ψ is the exponent.
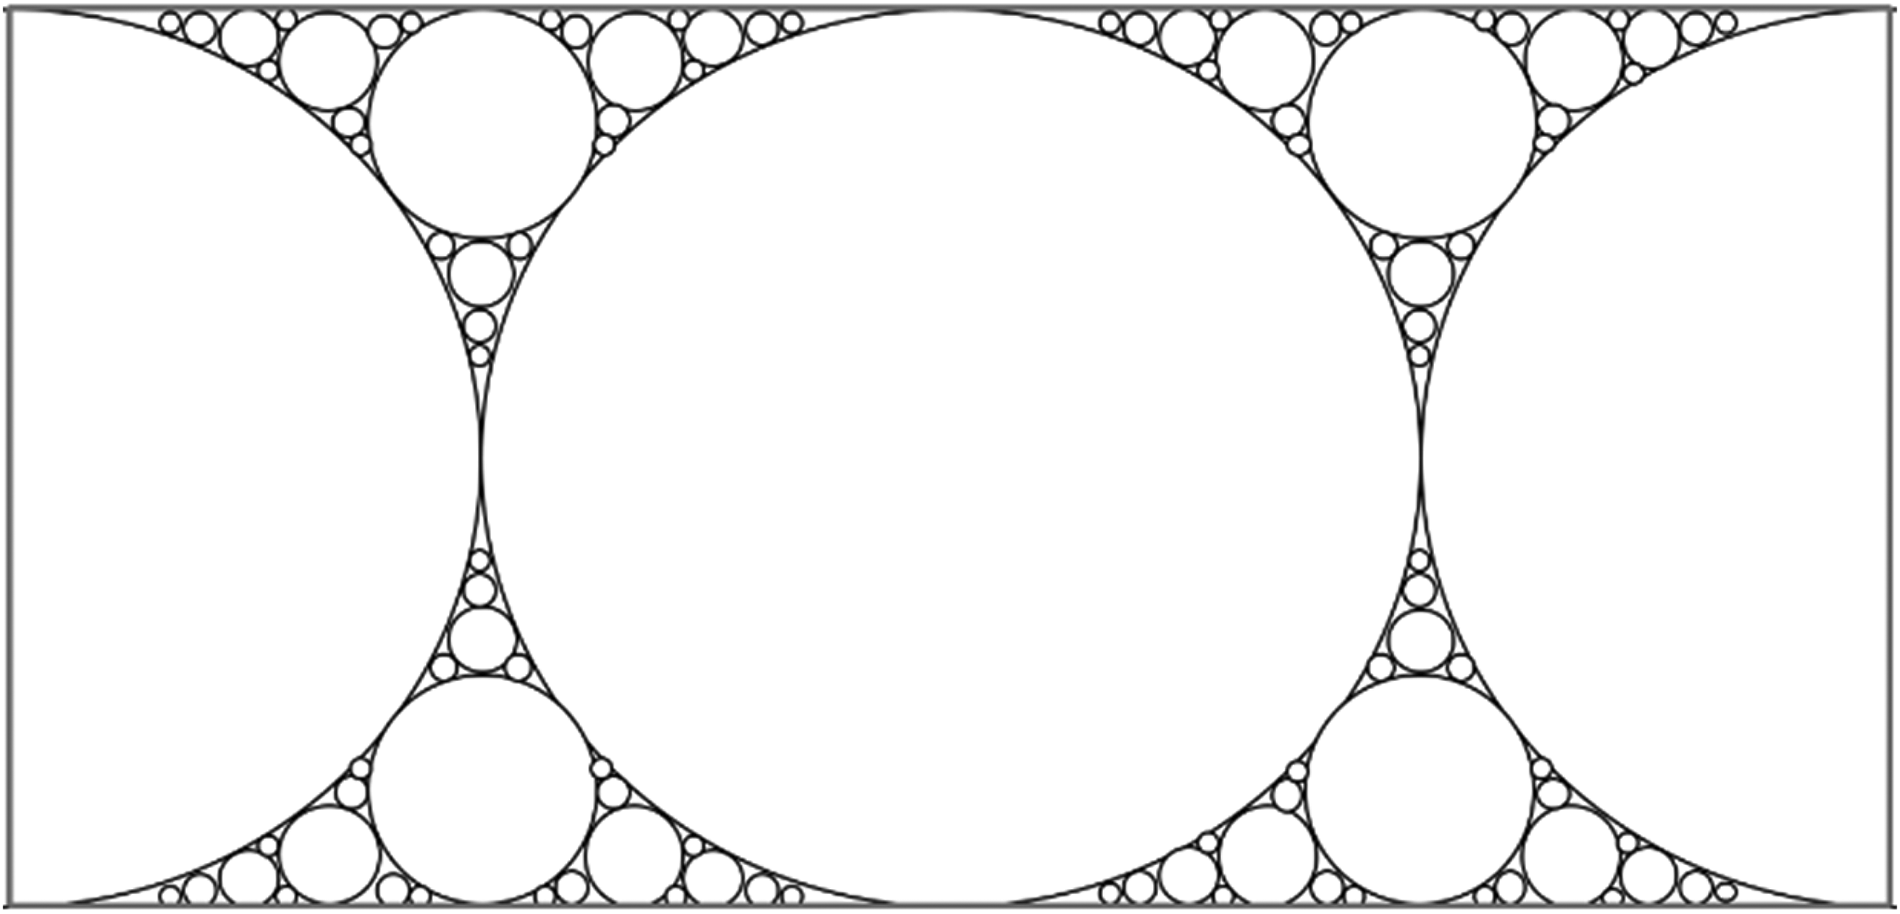
Arrangement of FT distribution of particles (2D representation).
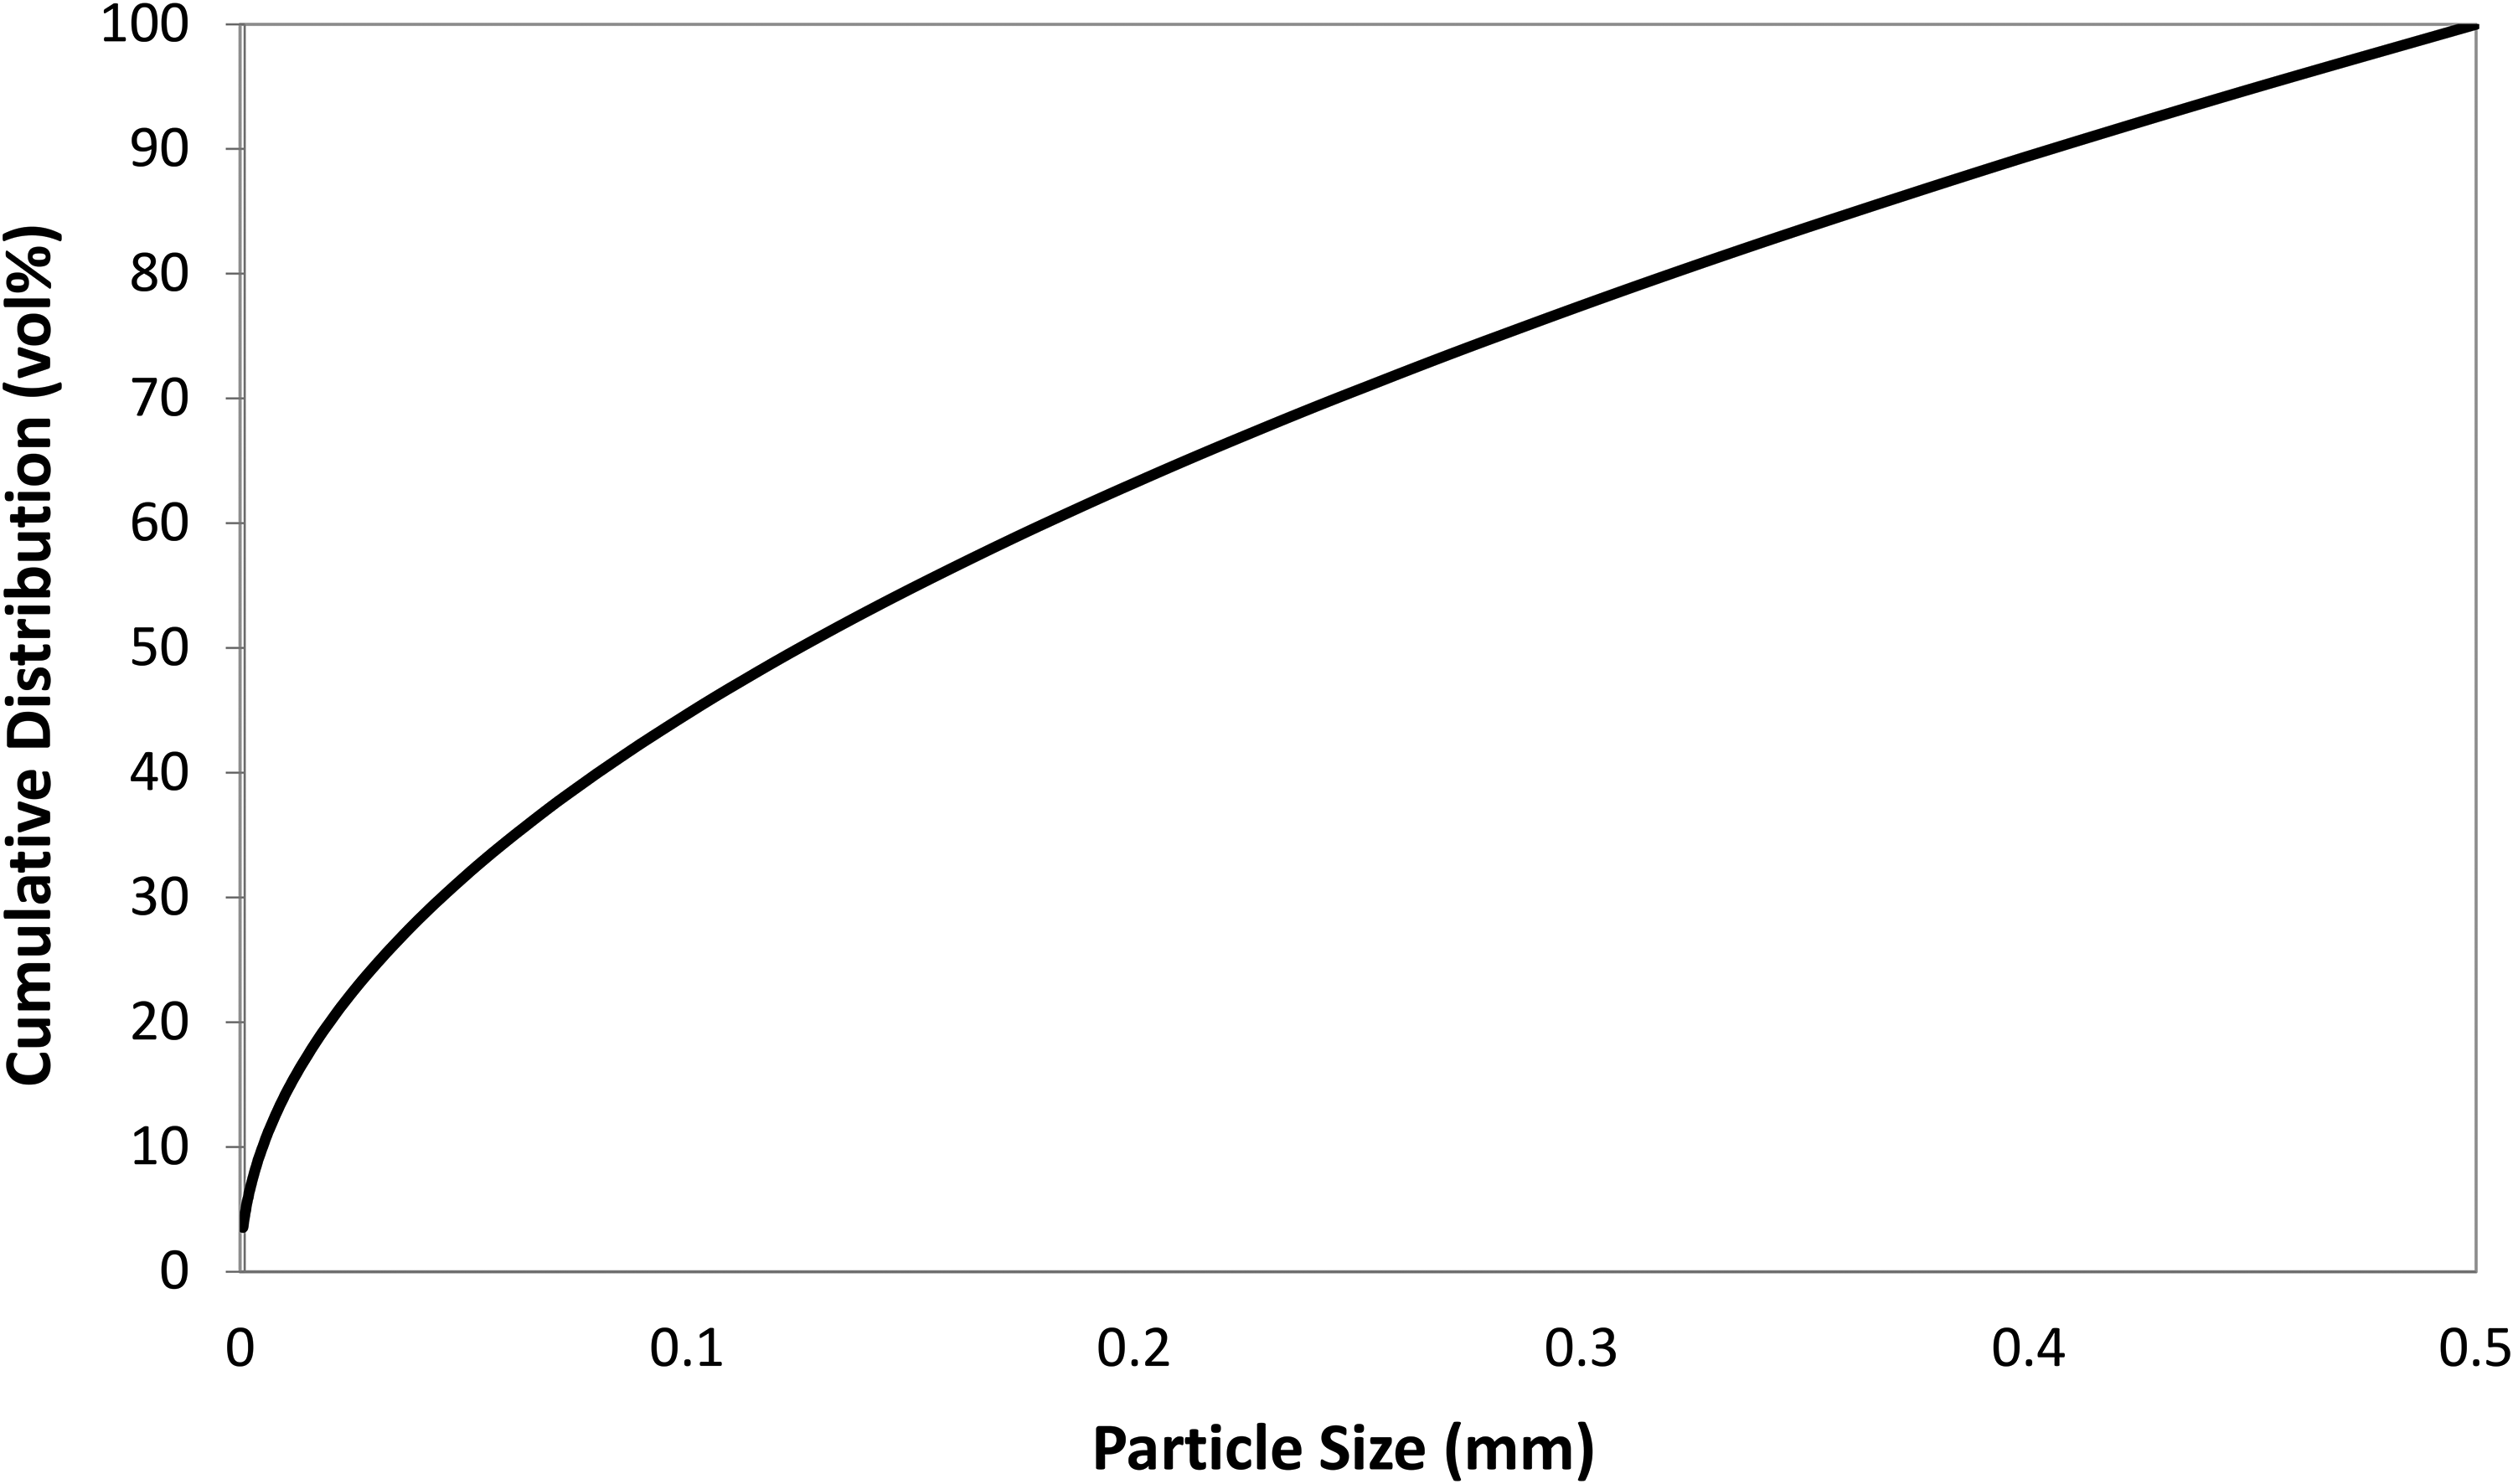
Example FT cumulative PSD with D = 0.5 mm and Ψ = 0.5.
Materials and methods
Materials
Four commercial grade iron ores, which originated from various locations worldwide were tested (Ore A to Ore D). Figure 4 shows the iron ore PSD, which was determined by dry sieve analysis through the following sieve series: +10 mm, −10 + 6.3 mm, −6.3 + 5 mm, −5 + 3.15 mm, −3.15 + 2 mm, −2 + 1 mm and −1 + -0.5 mm.
21
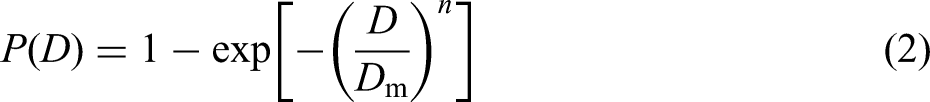
Representative samples of the particles −0.5 mm were taken for particle size analysis by laser diffraction with a Malvern Mastersizer 2000. The complete iron ore PSD was fitted with the Rosin–Rammler (RR) distribution (equation (2)),
22
where P(D) is the percentage less than the particle size D, Dm is the mean particle diameter and n is the spread of particle sizes within the distribution. The RR distribution is utilised in describing the PSDs created during mineral processing operations and allows the determination of the mean particle diameter and spread of particle sizes.
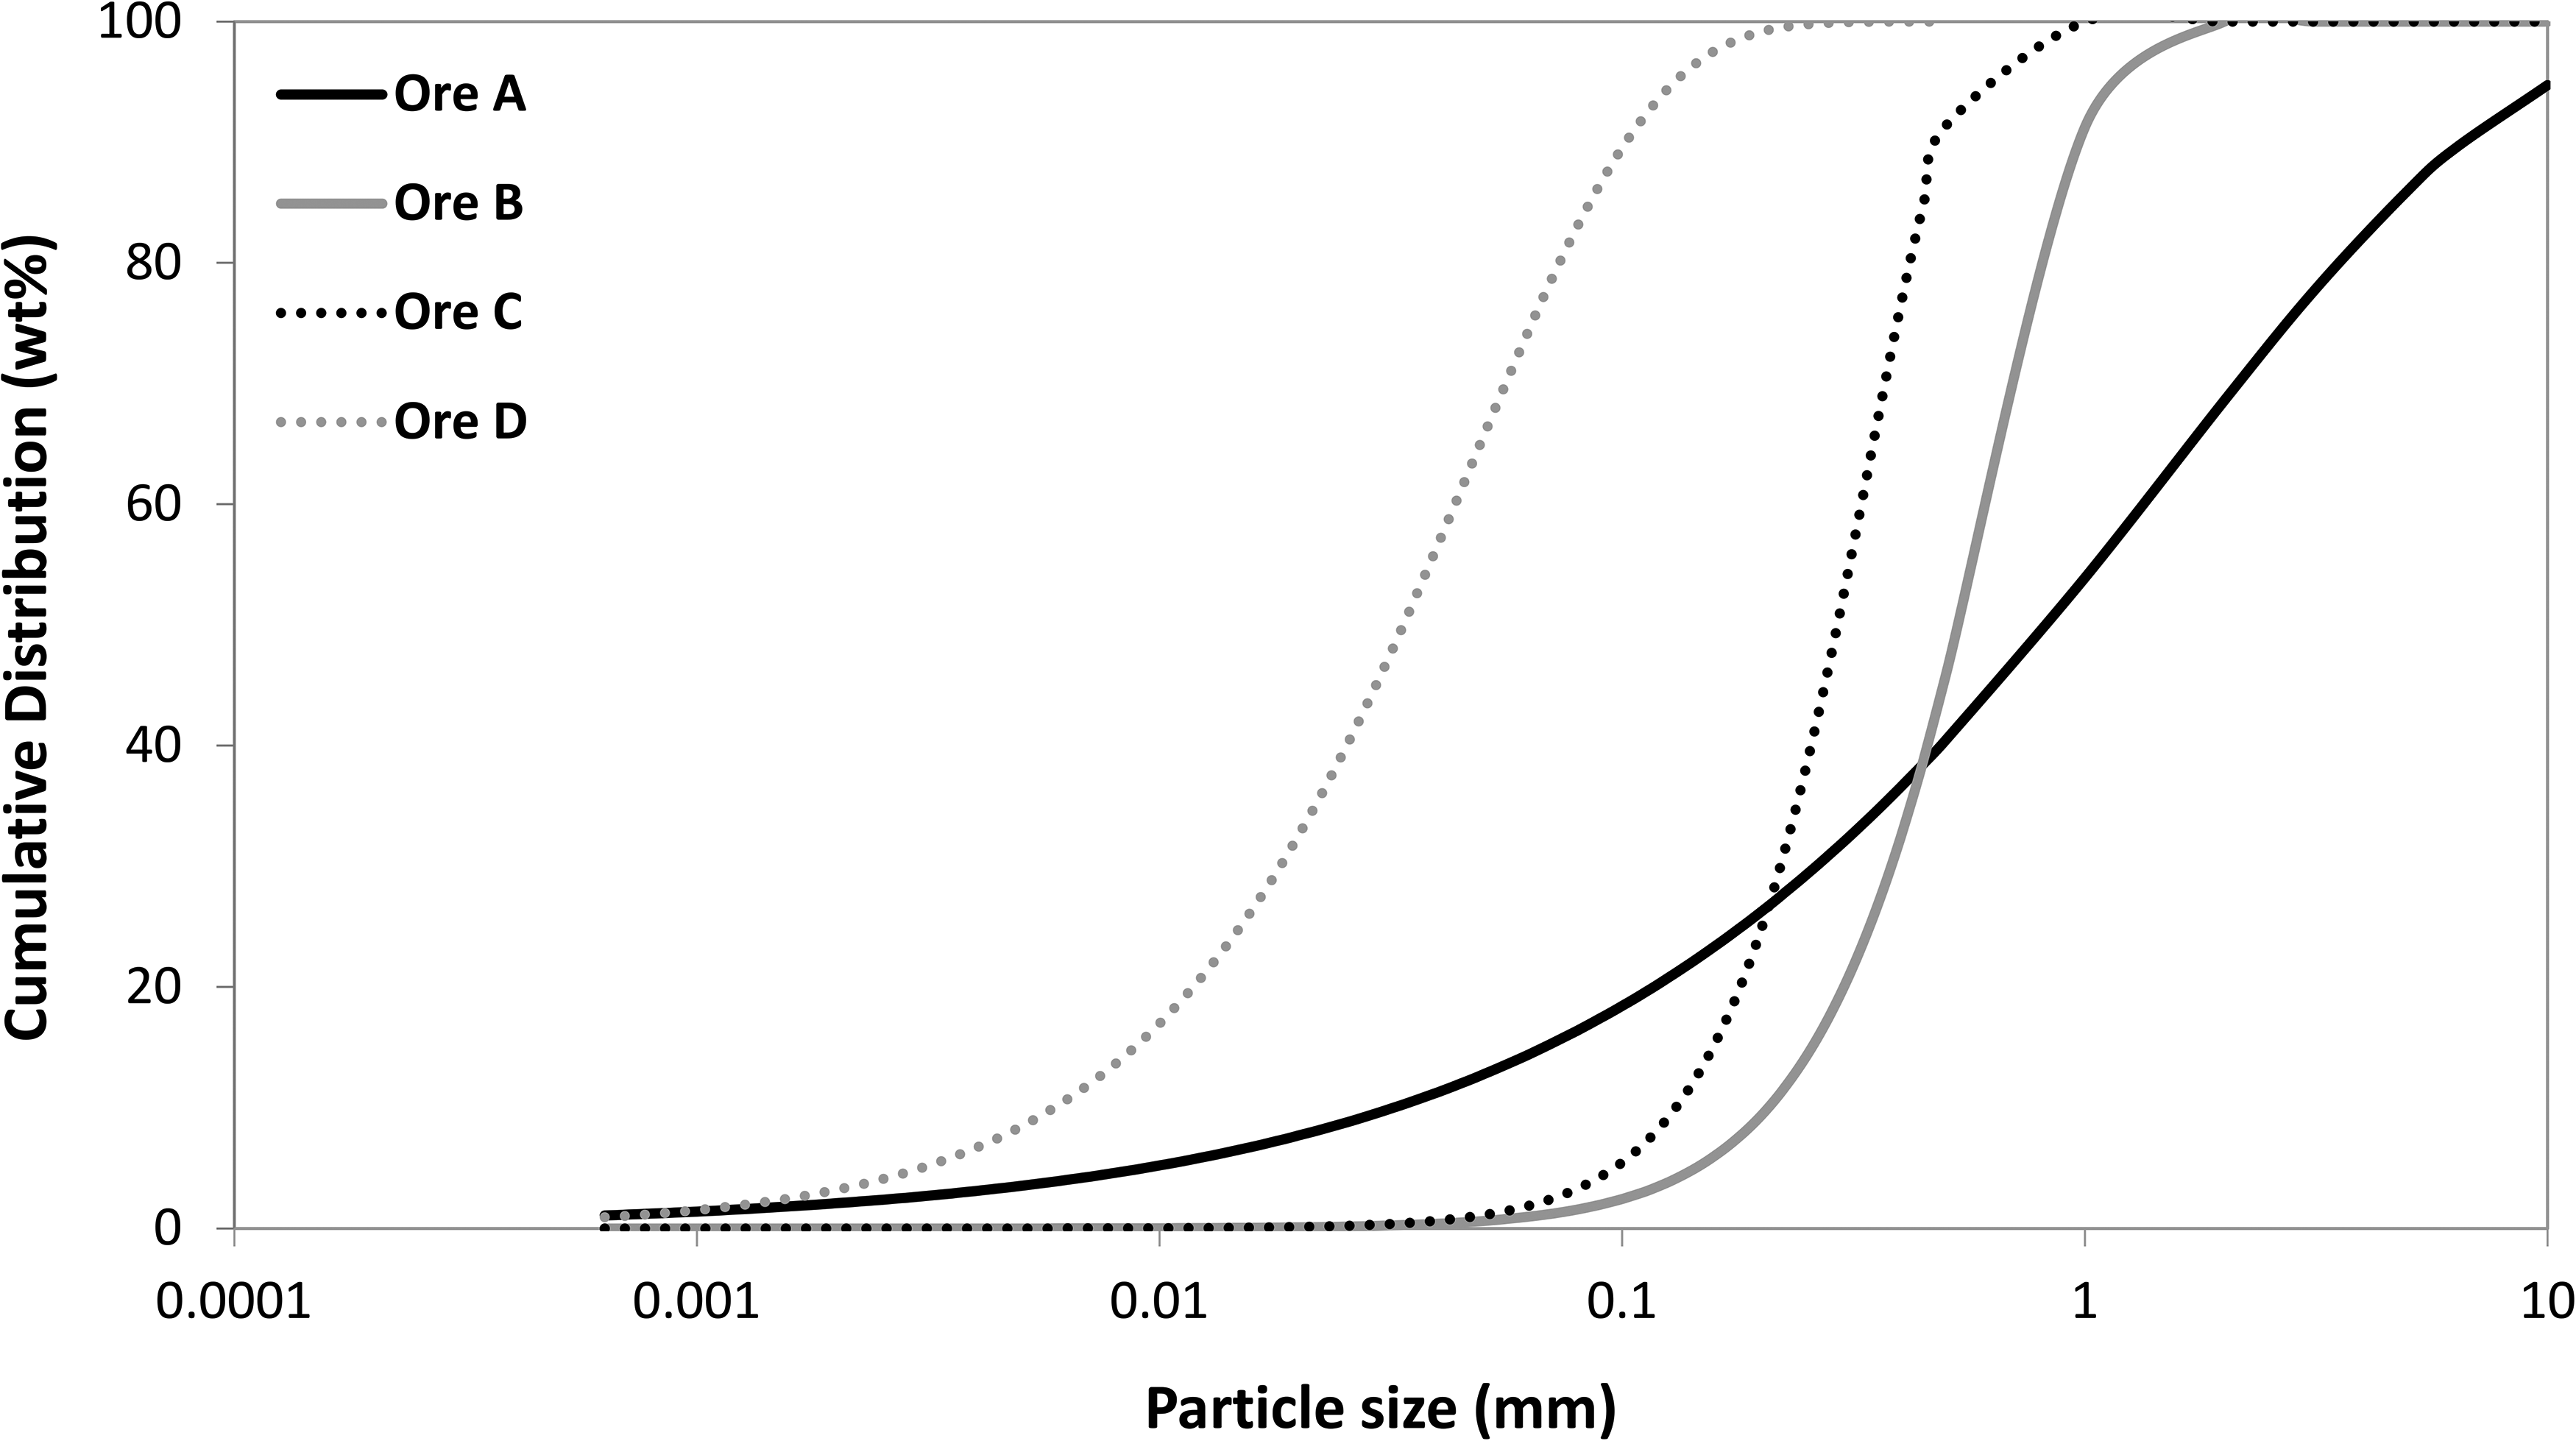
Iron ores cumulative PSD with RR approximation.
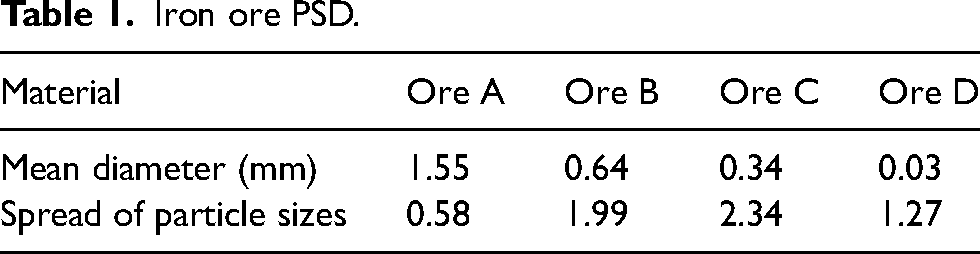
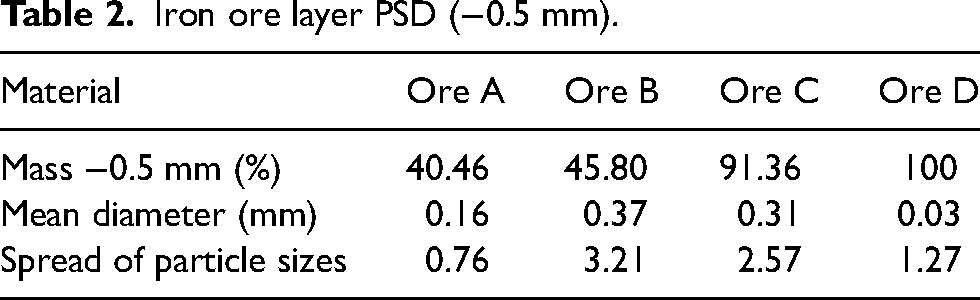
The mean particle diameter and spread of particle sizes of the ores were determined by using the Microsoft Excel™ solver. These parameters were calculated by iteration to minimise the sum of squared residuals between the measured iron ore PSD and the distribution created by the RR equation (2). Table 1 gives the mean particle diameter and spread of particle sizes for the iron ores. Table 2 gives the mass (%), mean particle diameter and spread of particle sizes of the −0.5 mm fraction of the iron ores, which are considered as layering particles in this study. The primary difference in PSD under investigation is layering PSD spread, which is a relative measure of the uniformity of particle sizes in the distribution of the layer. Spreads can range from narrower to wider distributions (larger to smaller n). Combining these ores in different proportions enabled specific blend layer PSD spreads to be created.
Iron ore PSD.
Iron ore layer PSD (−0.5 mm).
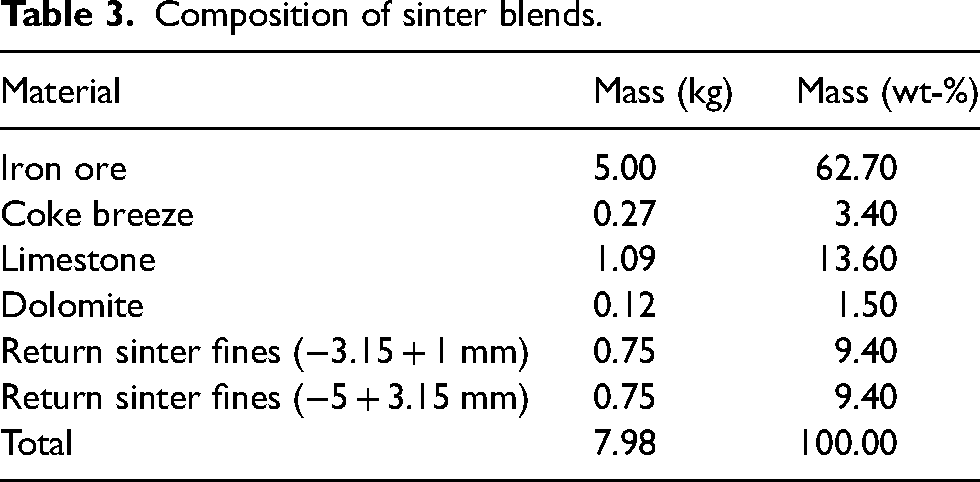
Other sinter blend materials: coke breeze, limestone, dolomite and return sinter fines were utilised in conducting the laboratory sintering experiments. Plant reverts were not used in laboratory testing due to safety regulations. The ores and additional materials were held in constant proportions throughout experimentation with Table 3 presenting the mass of each on a dry basis.
Composition of sinter blends.
Sinter blend design
To design the layering proportion of the iron ores in the blends to the FT equation the Microsoft Excel™ solver was used to fit the PSD to the FT equation. The FT equation parameters used were a maximum layering particle size of 0.5 mm and an exponent of 0.5. This exponent is commonly used in FT equation applications with other naturally occurring materials like iron ores, which have similar properties such as shape.23,24 The solver was used to iteratively vary the proportions of the four iron ores, which displayed different PSDs (Figure 4). The objective was to minimise the sum of square residuals between the FT equation and the blend PSD to determine the blend composition with optimum fit. Constraints set for the solver included ores being ≥0 wt-% and ≤100 wt-%. Also, in the evaluation of industrial blends (IS) with FT blends the proportion of layering particles were set as a constraint (46 wt-%, 48 wt-% and 50 wt-%). This enabled a constant proportion of layering particles in the blends, so that the layer PSD was the only variable in the investigation.
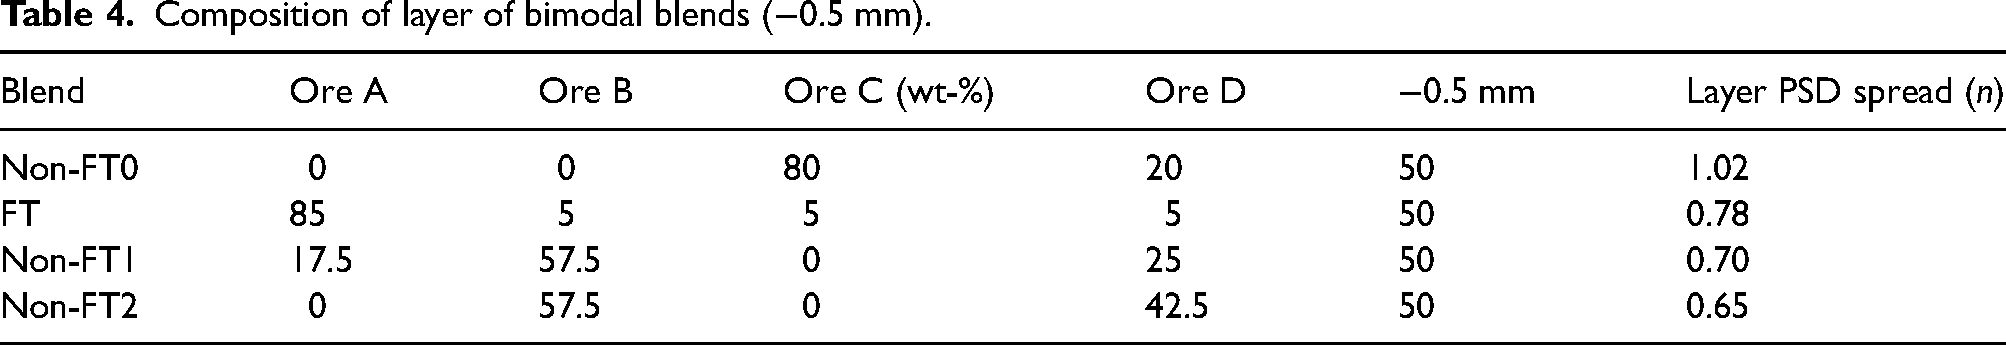
Bimodal blends comprising a layering proportion of particles mixed with a constant mass of nuclei (Ore A + 1–10 mm) were utilised to examine the influence of layer PSD spread on sinter bed permeability. The blends composed of 50 wt-% layering and 50 wt-% nuclei particles. The layering fraction of one of the blends was designed to the FT equation with the defined parameters. A blend was designed with layer PSD spread that was narrower (larger n) than the FT blend, termed ‘non-FT0’. Additional blends ‘non-FT1’ and ‘non-FT2’ were designed with a wider PSD spread (smaller n) than the FT blend. The blend compositions and layering PSD spreads of the blends are shown in Table 4.
Composition of layer of bimodal blends (−0.5 mm).
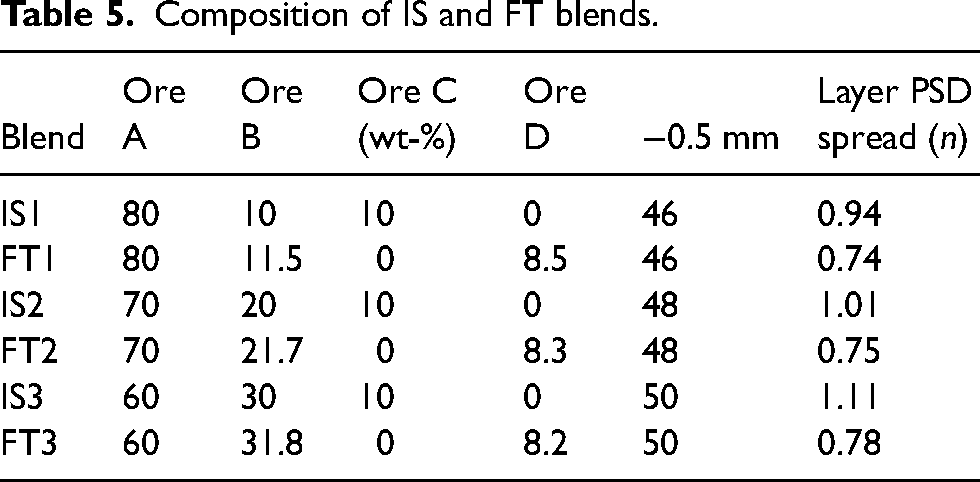
The bed permeability and sintering speeds of FT blends were also compared with IS blends containing a fraction of layering particles similar to those typical in sinter plant operations (46 wt-%, 48 wt-% and 50 wt-%; −0.5 mm). These blends are complete sinter blends containing all the particles from the iron ores and not the manipulated nuclei proportion in the blends introduced in the first part of the study. The compositions of the blends used in the industrial evaluation are shown in Table 5. Each experimental blend in Tables 4 and 5 was tested in triplicate at a moisture content of 6–6.5 wt-%. Error bars observed in the graphs are 95% confidence intervals.
Composition of IS and FT blends.
Mixing and granulation
Dry mixing was conducted for 2 min in an Eirich mixer before adding 6–6.5 wt-% water over a further 2 min to ensure effective water mixing into the material. Granulation was conducted in a plastic drum of internal diameter 300 mm and length 500 mm at 40 rpm for 3 min. The Froude number (NFr) was 0.009 and the filling degree of the drum was 0.17. Two approximately 400 g samples were taken for GSD analysis. This was measured by freezing the granules in liquid nitrogen before sieving through the following sieve series: +10 mm, −10 + 6.3 mm, −6.3 + 5 mm, −5 + 3.15 mm, −3.15 + 2 mm, −2 + 1 mm, −1 + −0.5 mm, −0.5 + 0.25 mm and −0.25 mm. 21 The mass (±0.01 g) retained in each sieve fraction was measured. This allowed the GSD, mean granule diameter and the spread of granule sizes to be determined through applying the RR equation. A further two 50 g granule samples were taken to determine the moisture content (wt-%) using an automated moisture balance with an accuracy of ±0.1 wt-%.
Granule microscopic analysis
Representative samples of granules produced by the blends in Tables 4 and 5 were set in epoxy resin and horizontal cross-sections made. Mosaic images of the granules in the cross-sections were taken under a Zeiss Axioplan Imager Z1 microscope and Axiovision image analysis software. Adobe Photoshop™ was used to outline the layers and nuclei particles of the granules in the cross-sections before further image analysis was conducted. The measurements obtained from the image analysis were the number and areas of nuclei, layering and ‘non-layered’ (or ‘non-granulated’) particles.
Sintering
Laboratory sintering tests were carried out in a cylindrical sintering unit of 120 mm diameter and 450 mm height. Approximately 8 kg of the granulated mixtures were charged into the sintering equipment over a 20-mm hearth layer of 10–15 mm sinter. The SGV through the bed (m/s) at pressure drops of 40, 80, 100 and 120 mbar were recorded for 2 min using a VPFlowScope® in-line flow metre from VP Instruments to provide the measurements for cold SGV. The top layer was then ignited for 2 min with compressed air and natural gas at a pressure drop of 120 mbar. Once ignited the flow metre was reattached so that the flow rates to obtain a measure for hot SGV could be recorded. The measurements used for hot SGV was the average of the flow rates when at their most stable, which was when the flame front was between 0 and 22.5 cm along the height of the sintering bed.
The pressure drop (ΔP) through a sinter bed can be described by the Ergun equation (3).
25
This equation defines pressure drop in terms of bed height (L), SGV (U), gas viscosity (μ), gas density (ρ), mean granule diameter (Dp), shape factor (Φ) and porosity (ε). The pressure drop, SGV and mean granule diameter are determined by the methods discussed previously. The shape factor and gas properties are constant. The Ergun equation was fitted to the measurement data by minimising the sum of squared residuals by iteratively varying the only remaining unknown parameter, the bed porosity using the Microsoft Excel™ solver. Sinter bed SGV (cold and hot) was then classed as the SGV at a pressure drop of 120 mbar, which is similar to that found in plant operations.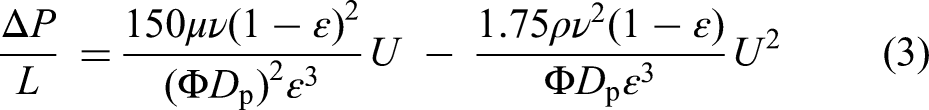
Results and discussion
Influence of layering particle size distribution spread in bimodal blends
Cold SGV
To understand the impact of layering PSD spread on cold SGV it was important to first understand which factors have primary influence. The GSD of the blends in Table 4 are shown in Figure 5 with the mean granule diameters and GSD spreads shown in Table 6. Figure 6 shows changes in cold SGV were strongly related to the GSD spread. As the GSD spread became narrower (increasing n) an increased cold SGV was observed. Note that the FT blend did not create the narrowest GSD spread or greatest cold SGV. The Ergun equation indicates that the SGV is a function of bed void fraction. Maximum bed void fraction is achieved in a bed of equal sized spheres. 26 The less uniform the size of spheres, that is, widening GSD spread (decreasing n) the lower the bed void fraction.

Cumulative GSD measurements for bimodal blends in Table 4.
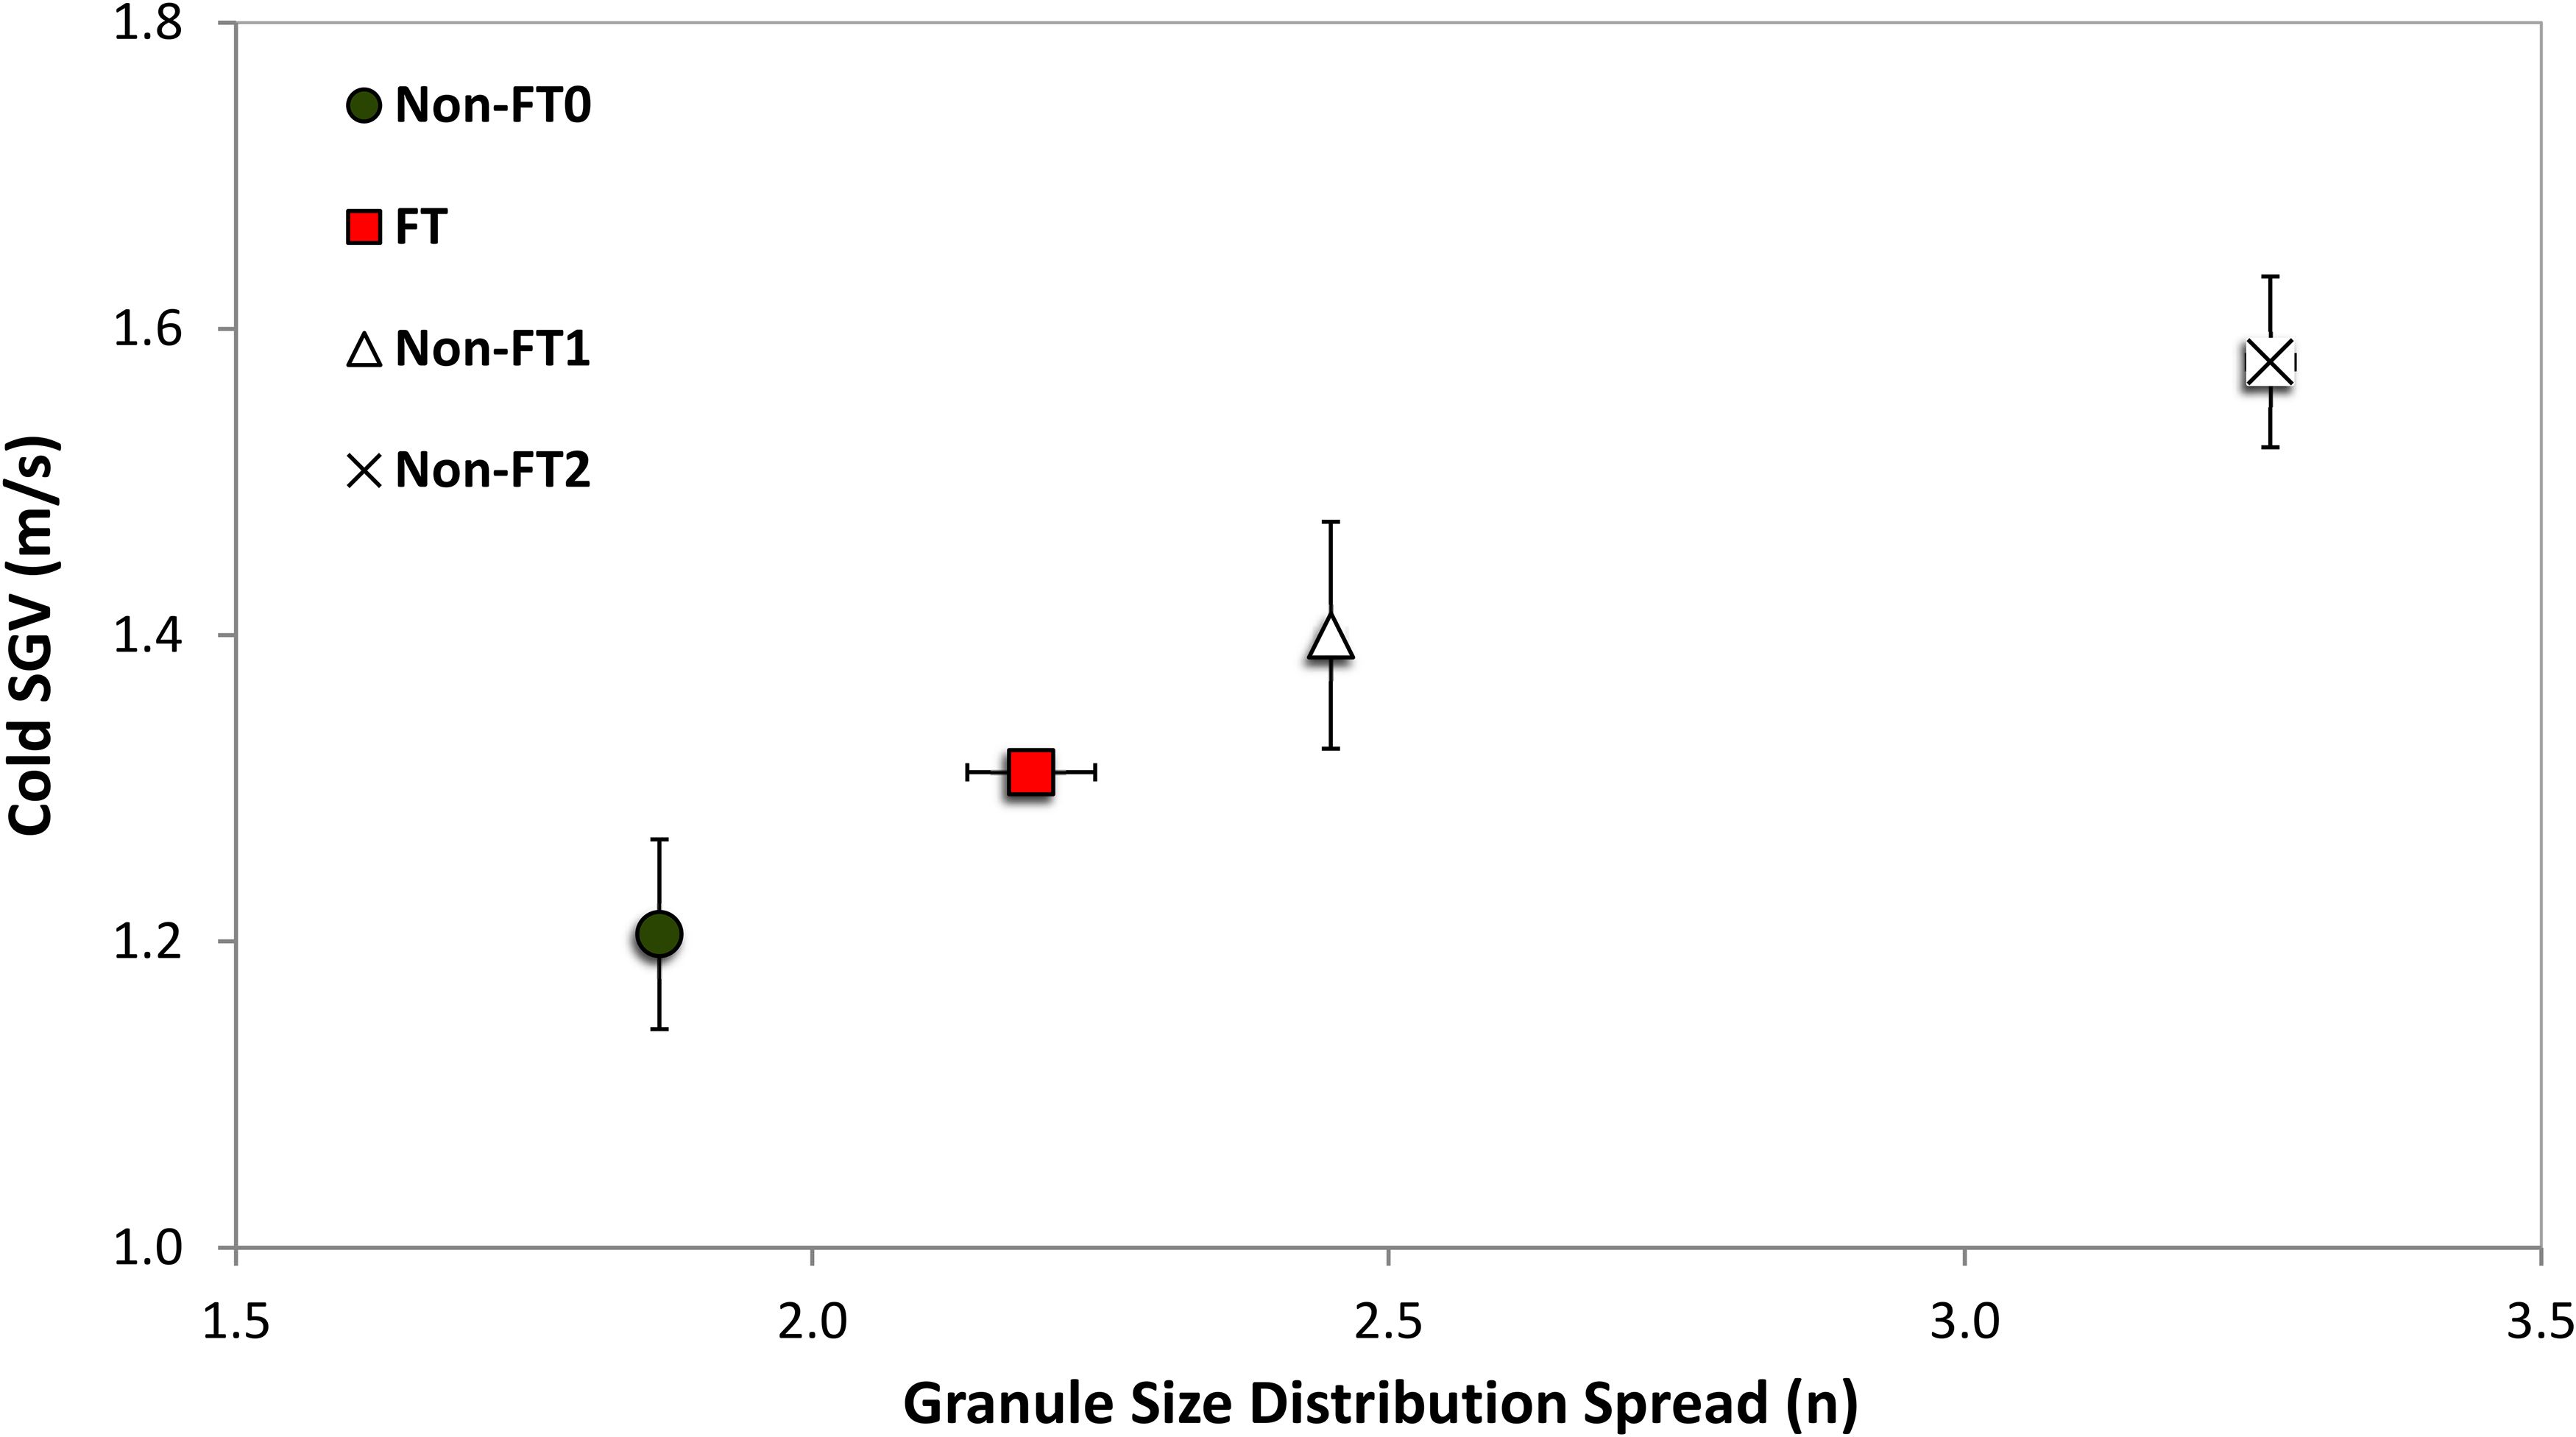
Relationship between cold SGV with GSD spread for bimodal blends in Table 4.
GSD spread and mean granule diameter for bimodal blends in Table 4.
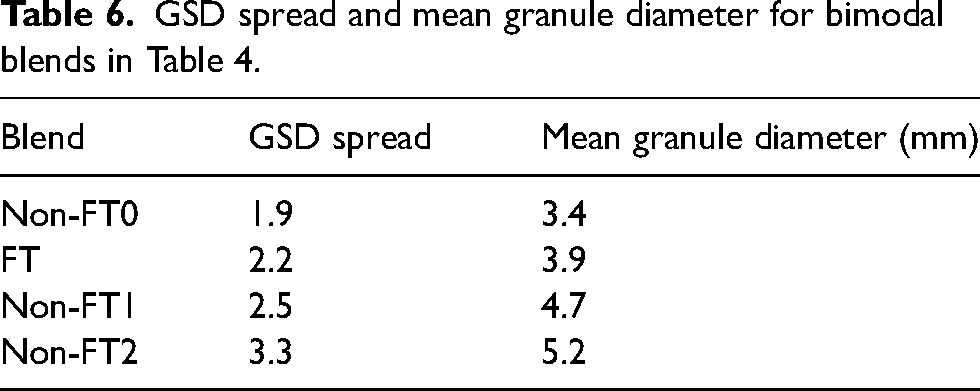
Figure 7 shows the relationship between layer PSD spread and GSD spread with mass of particles −1 mm. There is an inverse relationship between layer PSD and GSD spread. As the layer PSD spread widened (decreasing n) a narrowing in the GSD spread (increasing n) was found. There are no error bars in the x-axis, as the layer PSD spread did not change in the three repetitions of blend. The y-axis error bars cannot be seen in all measurements, which is due to the small measurement error with those blends. The mass of particles that can be considered as ‘non-layered’ (or ‘non-granulated’) at the end of a granulation experiment were defined as those that were less than 1 mm. Figure 7 also shows the mass (%) of ‘non-layered’ particles at the end of granulation, plotted against the layer PSD spread. As the layer PSD spread widened (decreasing n) the mass of non-granulated particles (those passing 1 mm sieve) after granulation decreased, this indicates that a greater mass of material became layered when the layer PSD spread was wider. This explains the narrower GSD spread with wider layer PSD spread, as shown in Figure 7. The interpretation of these data is that a wider range of particle sizes within the distribution of layering particles (lower n) means that more particles (and hence more mass) can become entrained within the layer around the nucleus during granulation.
Relationship between GSD spread and mass passing 1 mm sieve with layer PSD spread for bimodal blends in Table 4.
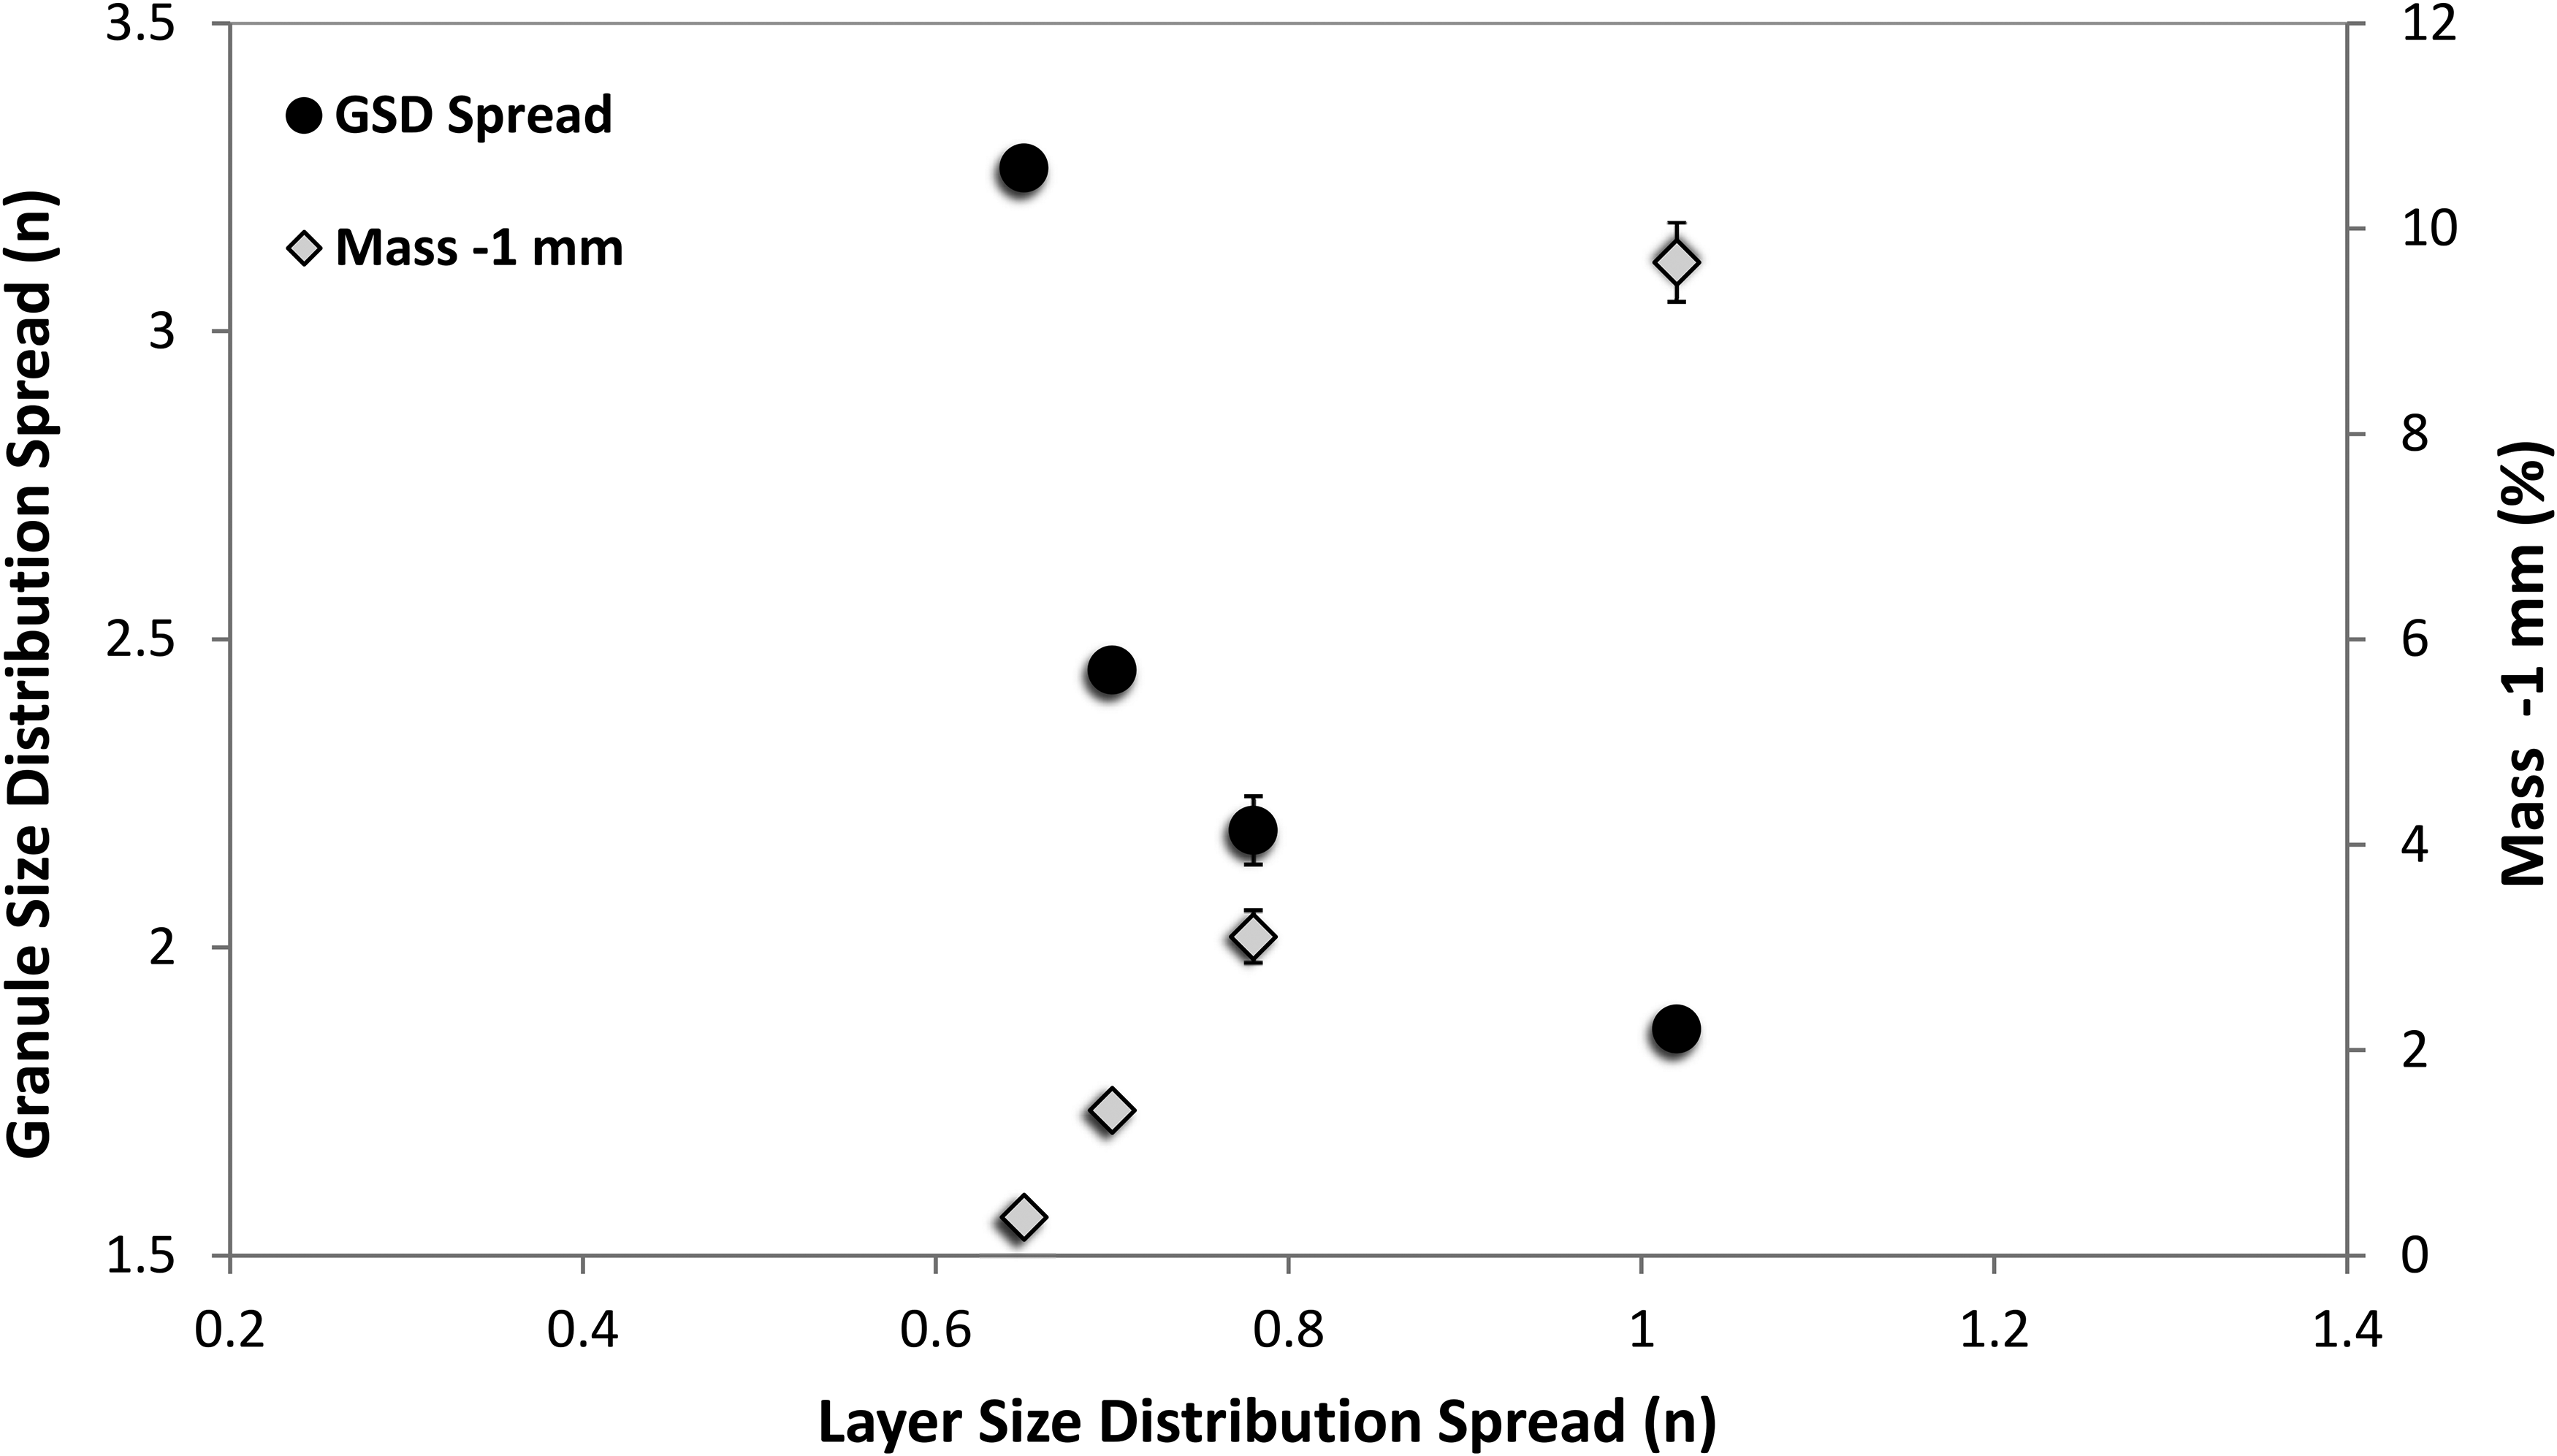
Further evidence for this phenomenon is demonstrated in Figure 8 which presents the relationship between GSD and layer PSD spread with mean granule diameter. Widening the layer PSD spread (decreasing n) created a larger mean granule diameter. From Figure 8 the direct relationship between mean granule diameter and GSD spread can also be seen, where increasing mean granule diameter is correlated with a narrowing in GSD spread (increasing n).
Relationship between GSD and layer PSD spread with mean granule diameter for bimodal blends in Table 4.
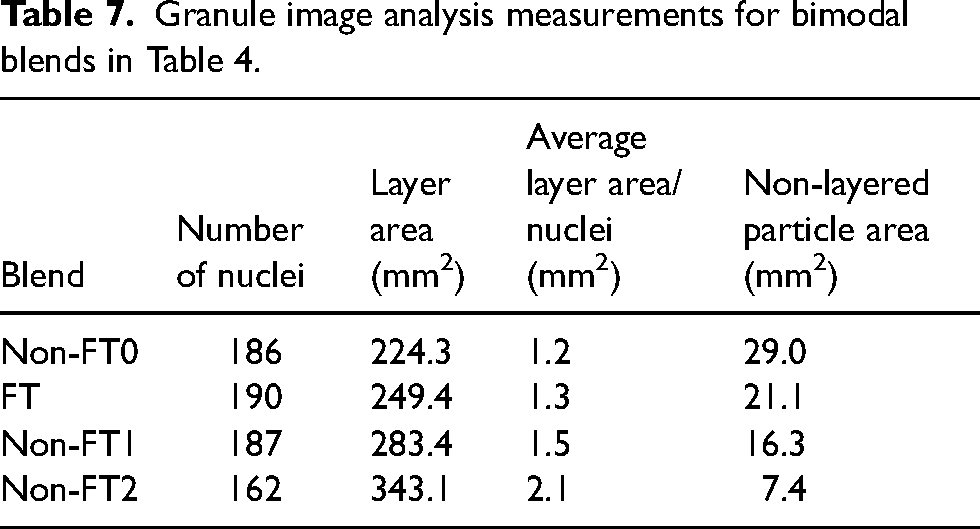
Microscopic cross-section images of the layers formed around nuclei are shown in Figure 9(a)–(d). The measurements obtained from image analysis of these cross-sections are presented in Table 7. The data in Table 7 support the observations in Figure 8 that widening layer PSD spread (decreasing n) increased the mean granule diameter. As the layer PSD spread widened from non-FT0 to non-FT2 (decreasing n in Table 4) there was a corresponding increase in the average layer area per nuclei in the cross-sections. Further evidence can be seen from Figure 9(e)–(h) which show the ‘non-layered’ (or ‘non-granulated’) particles highlighted in the cross-sections after granulation. The areas of ‘non-layered’ particles are presented in Table 7. These data confirm the trends highlighted in Figures 7 and 8, as the layer PSD spread widened (decreasing n) there was a smaller area of ‘non-layered’ particles as more particles report to the layers around the nuclei. In summary of Figures 6 to 9 and Tables 6 and 7 when the PSD of layering materials was wider (smaller n), larger granules were formed which had a narrower GSD (larger n) and increased cold SGV.
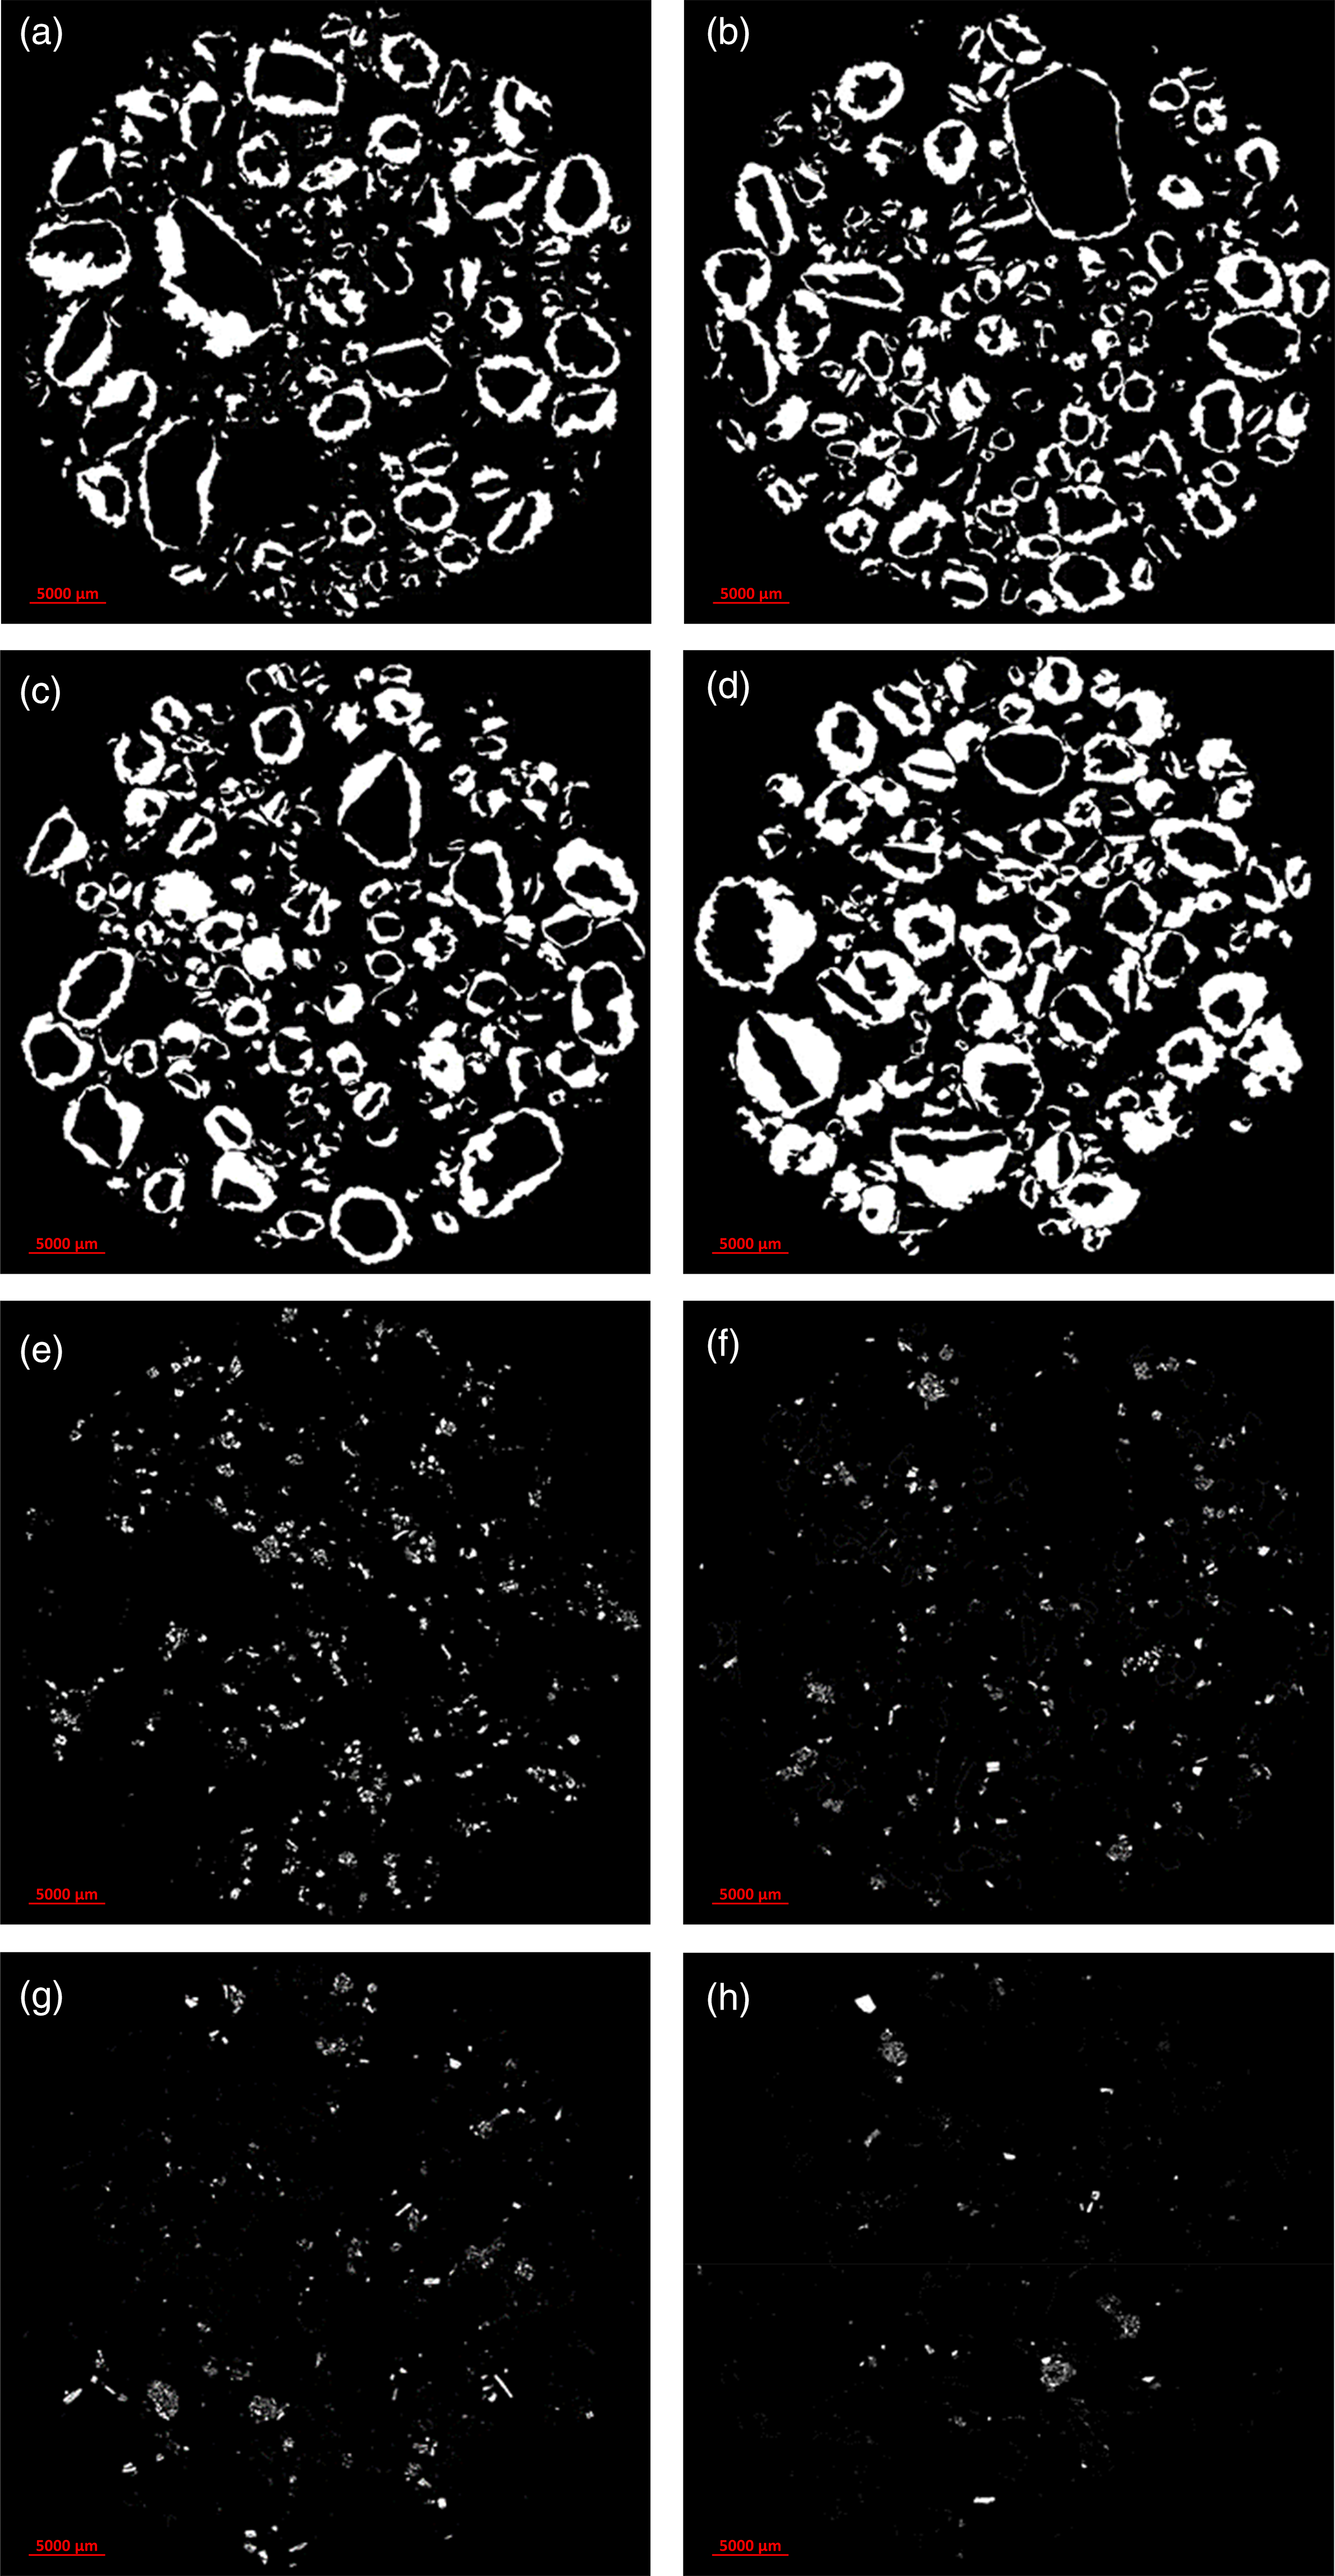
Filtered microscopic images after image analysis of layered and non-layered material for bimodal blends in Table 4: (a) non-FT0 layer material; (b) FT layer material; (c) non-FT1 layer material; (d) non-FT2 layer material; (e) non-FT0 non-layer material; (f) FT non-layer material; (g) non-FT1 non-layer material; (h) non-FT2 non-layer material.
Granule image analysis measurements for bimodal blends in Table 4.
Hot SGV and sintering time
Whilst the cold SGV is an important parameter to ensure good gas velocity during the initiation of sintering, the SGV of the bed during sintering (referred to as the hot SGV) is more critical. A bed will have a relatively high SGV prior to sintering (cold SGV) but once a flame front is created the SGV will reduce. This is primarily due to a sharp increase in pressure drop caused by the instigation of the flame front creating a layer of partial melt, and the bed deformation due to higher moisture contents from condensation lower in the bed. The hot SGV strongly influences sintering time (Figure 10) and the sinter strand productivity will be impacted by longer sintering times. Note that the FT blend produced the greatest hot SGV and shortest sintering time. Figure 11 shows the maximum sintering temperature measured for each blend. It can be seen from Figure 11 that the results were the same within the 95% confidence intervals. This indicates that differences in sintering temperatures were not the reason behind the different hot SGV results obtained.
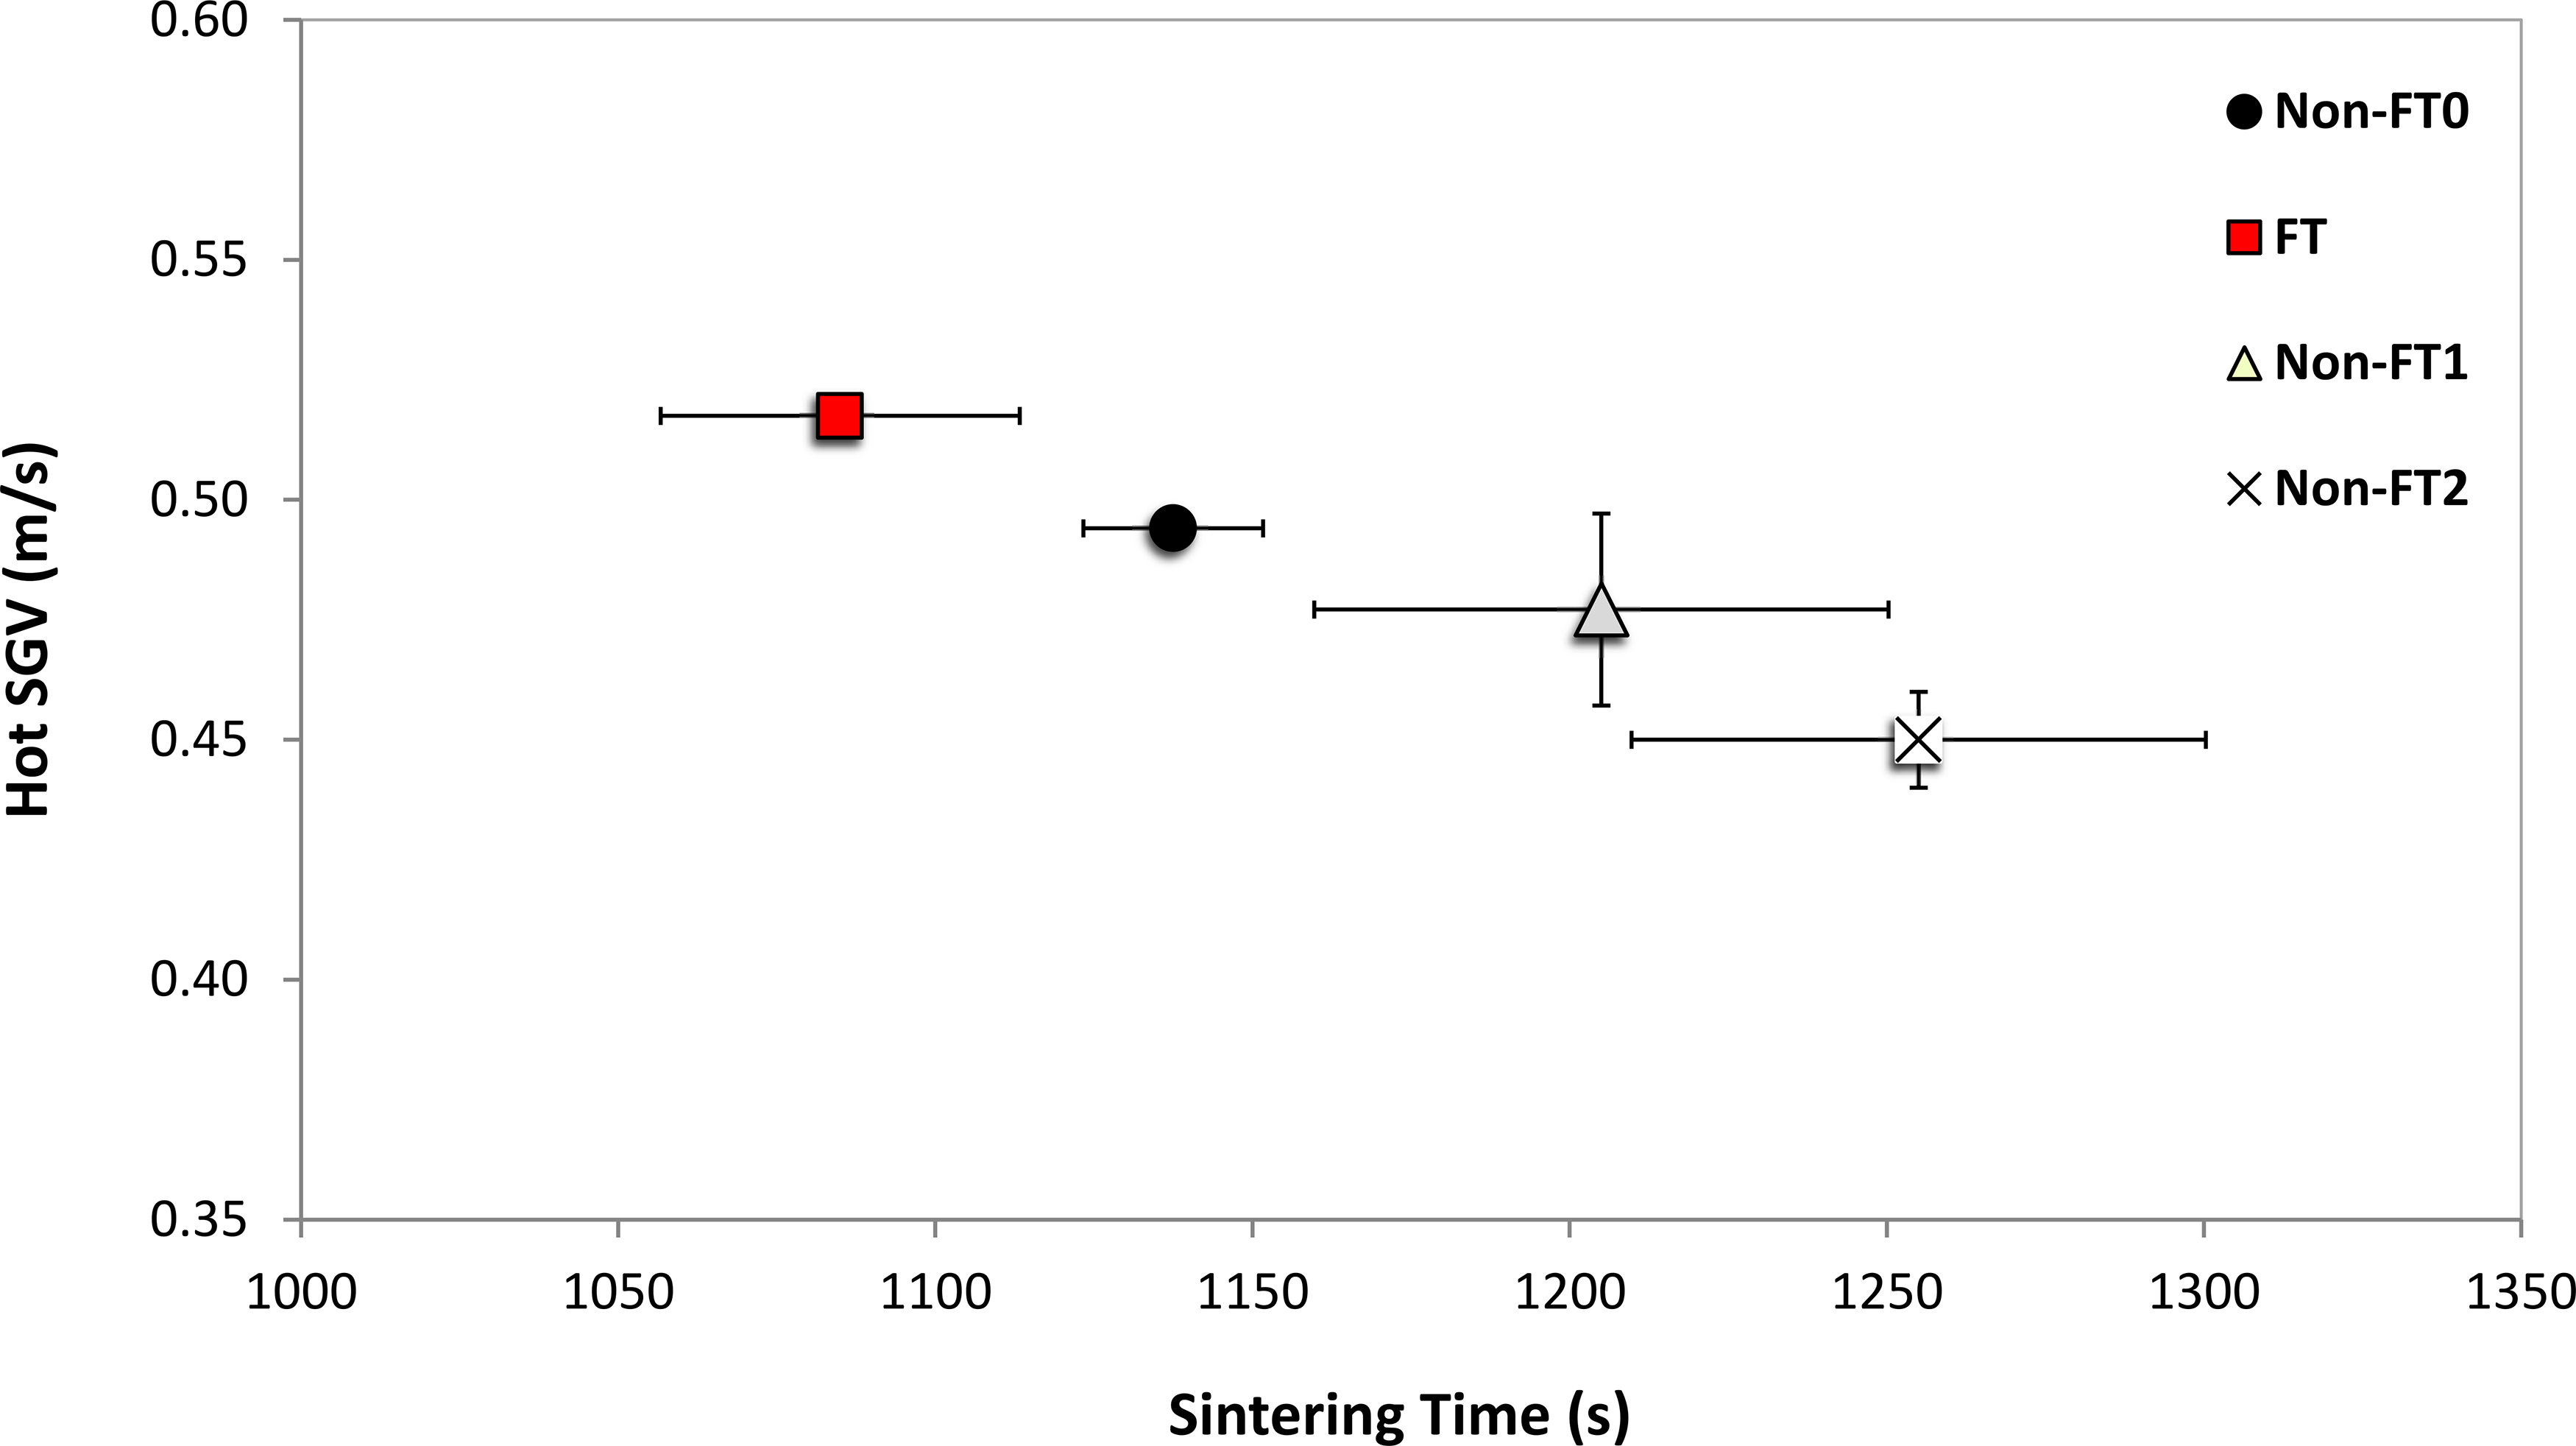
Relationship between hot SGV and sintering time for bimodal blends in Table 4.
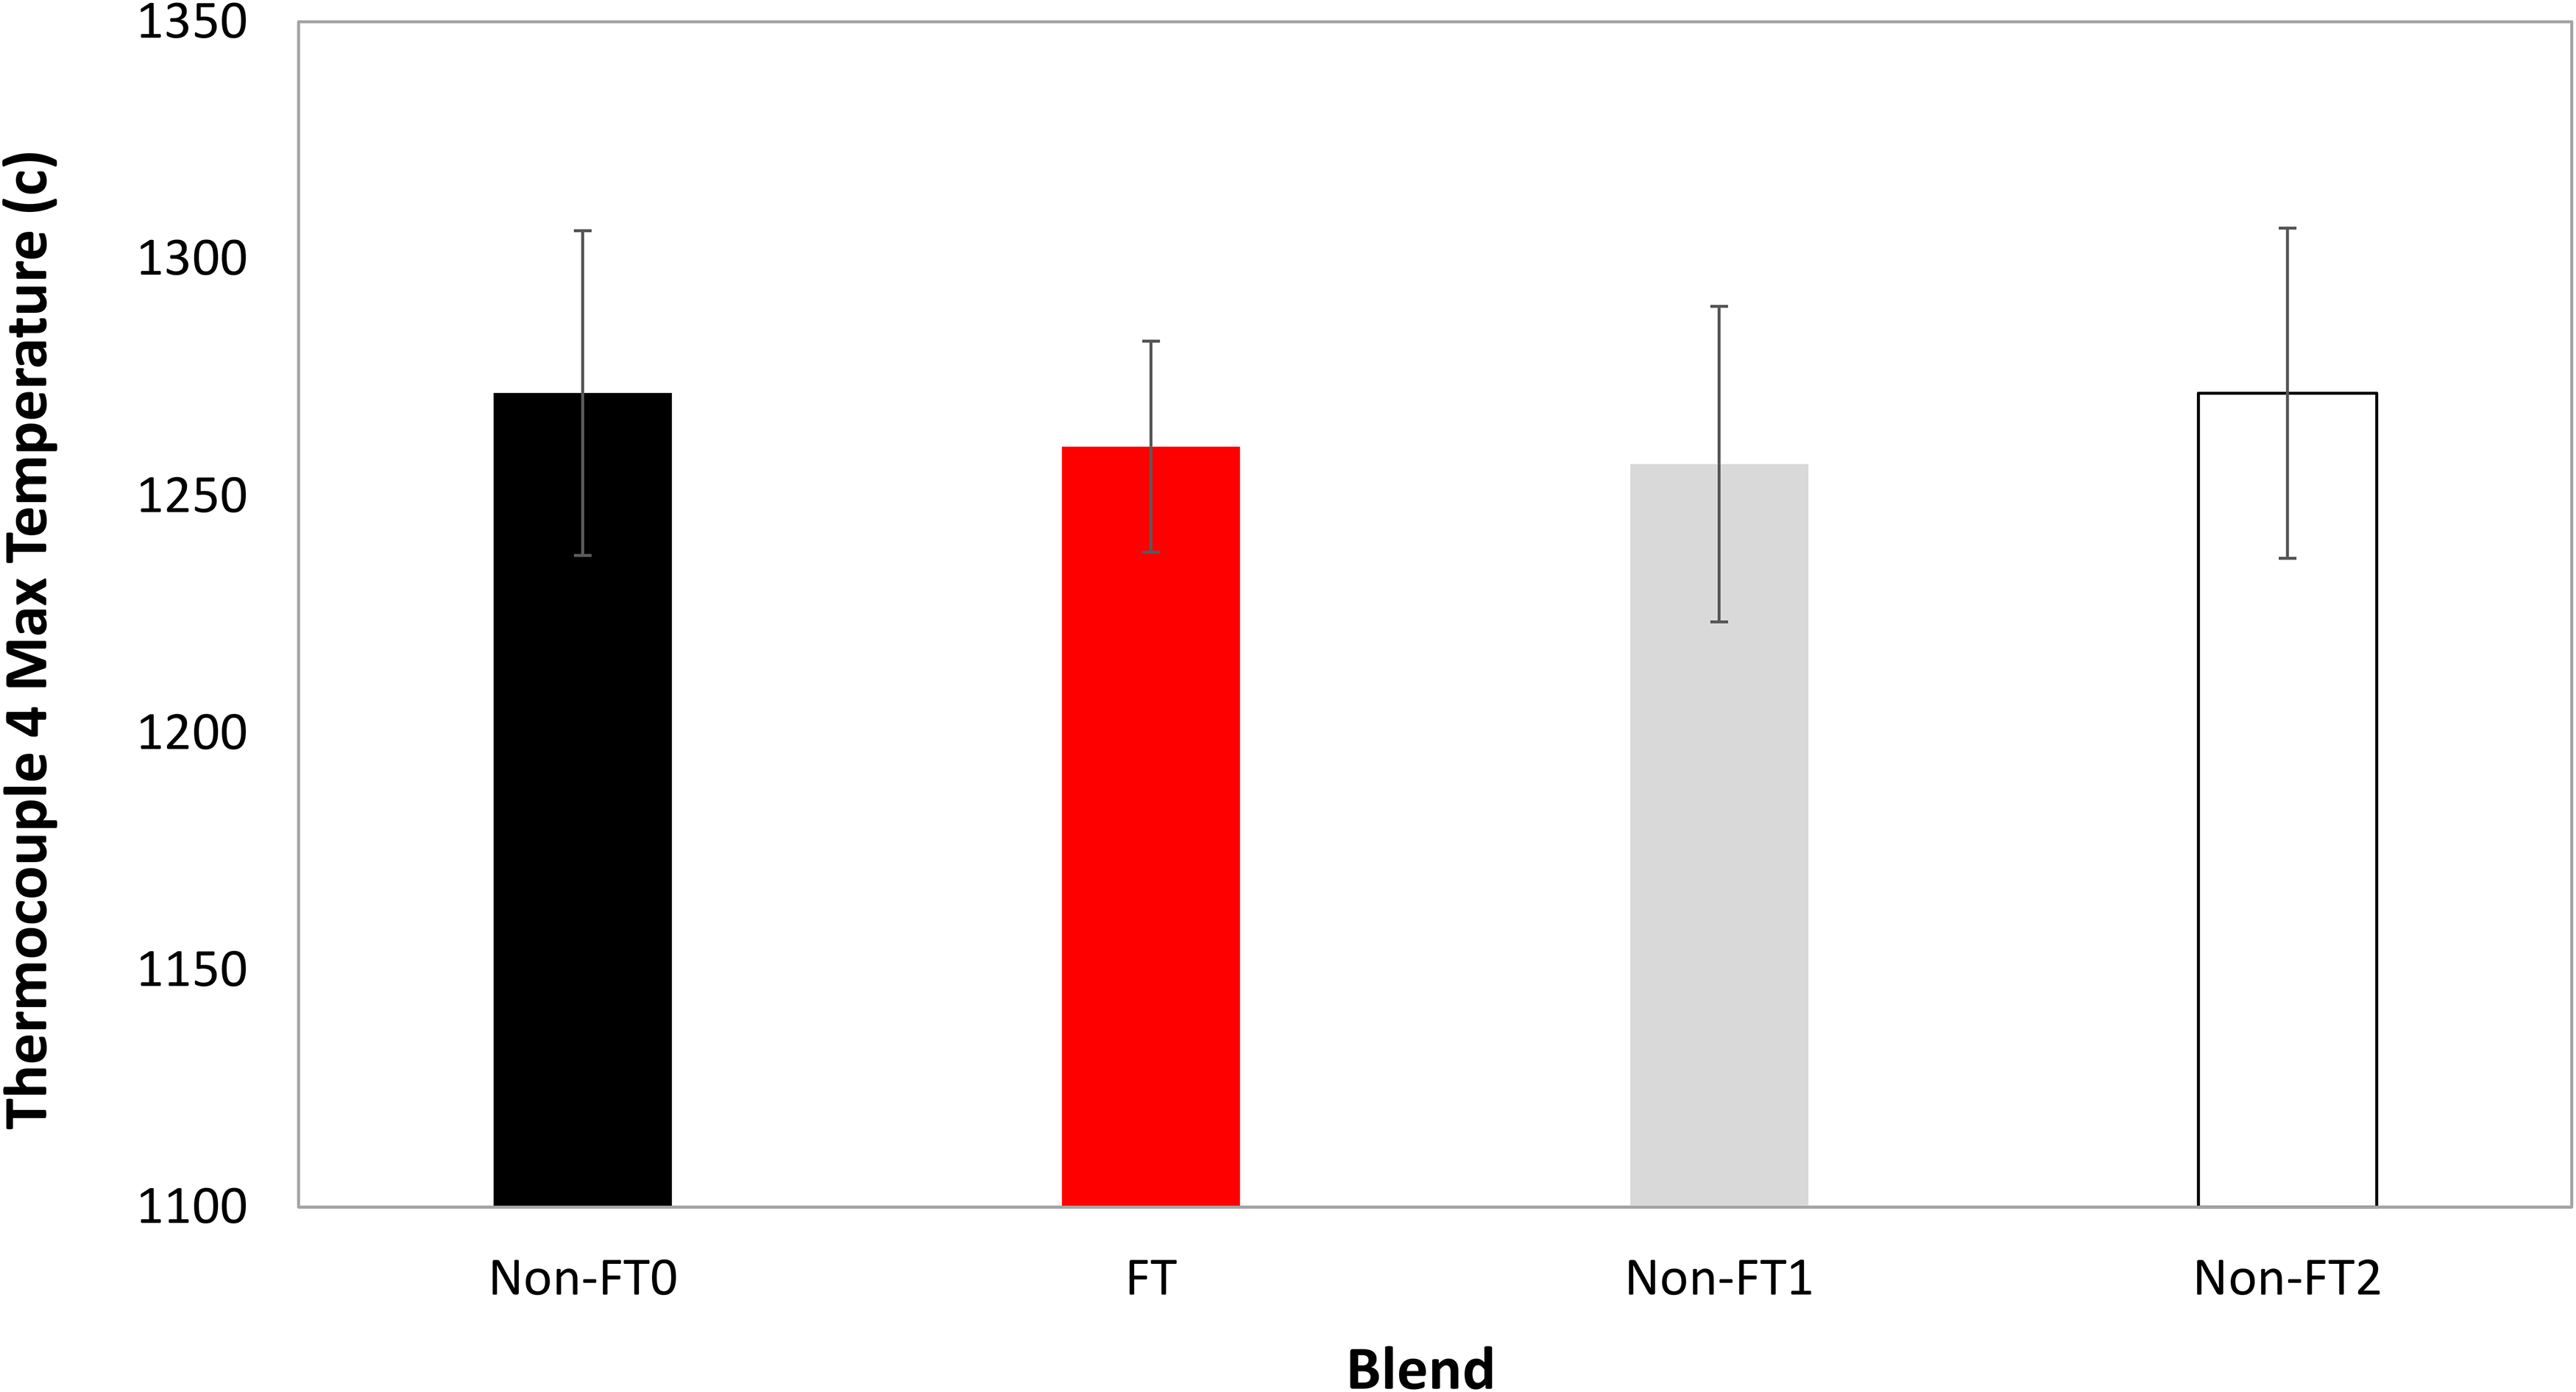
Maximum sintering temperature measured by thermocouple 4 for bimodal blends in Table 4.
It is thus essential to represent the decrease in SGV experienced by the sinter bed during transition from cold to hot conditions during sintering. The authors introduce a measure – the ‘hot SGV efficiency’ defined as hot SGV/cold SGV*100, to indicate the relative size of the decrease in SGV between cold and hot conditions.
Widening the PSD spread of layering material (decreasing n) has been shown to increase the mean granule diameter and narrow the GSD spread (increasing n) which leads to an increased cold SGV. However, an increase in mean granule diameter is correlated with a decrease in hot SGV efficiency (Figure 12). That is, larger mean granule diameters lost more of their cold SGV when transferring to hot SGV during the process. Layers of fine particles more readily deform than nuclei particles. 6 Thus, it is thought that larger layers display more deformation and bed collapse when transferring from cold to hot SGV. This matches the findings of Zhou et al., 27 where it was shown that increasing the granule layer thickness increased the layer deformation and decreased the bed voidage.
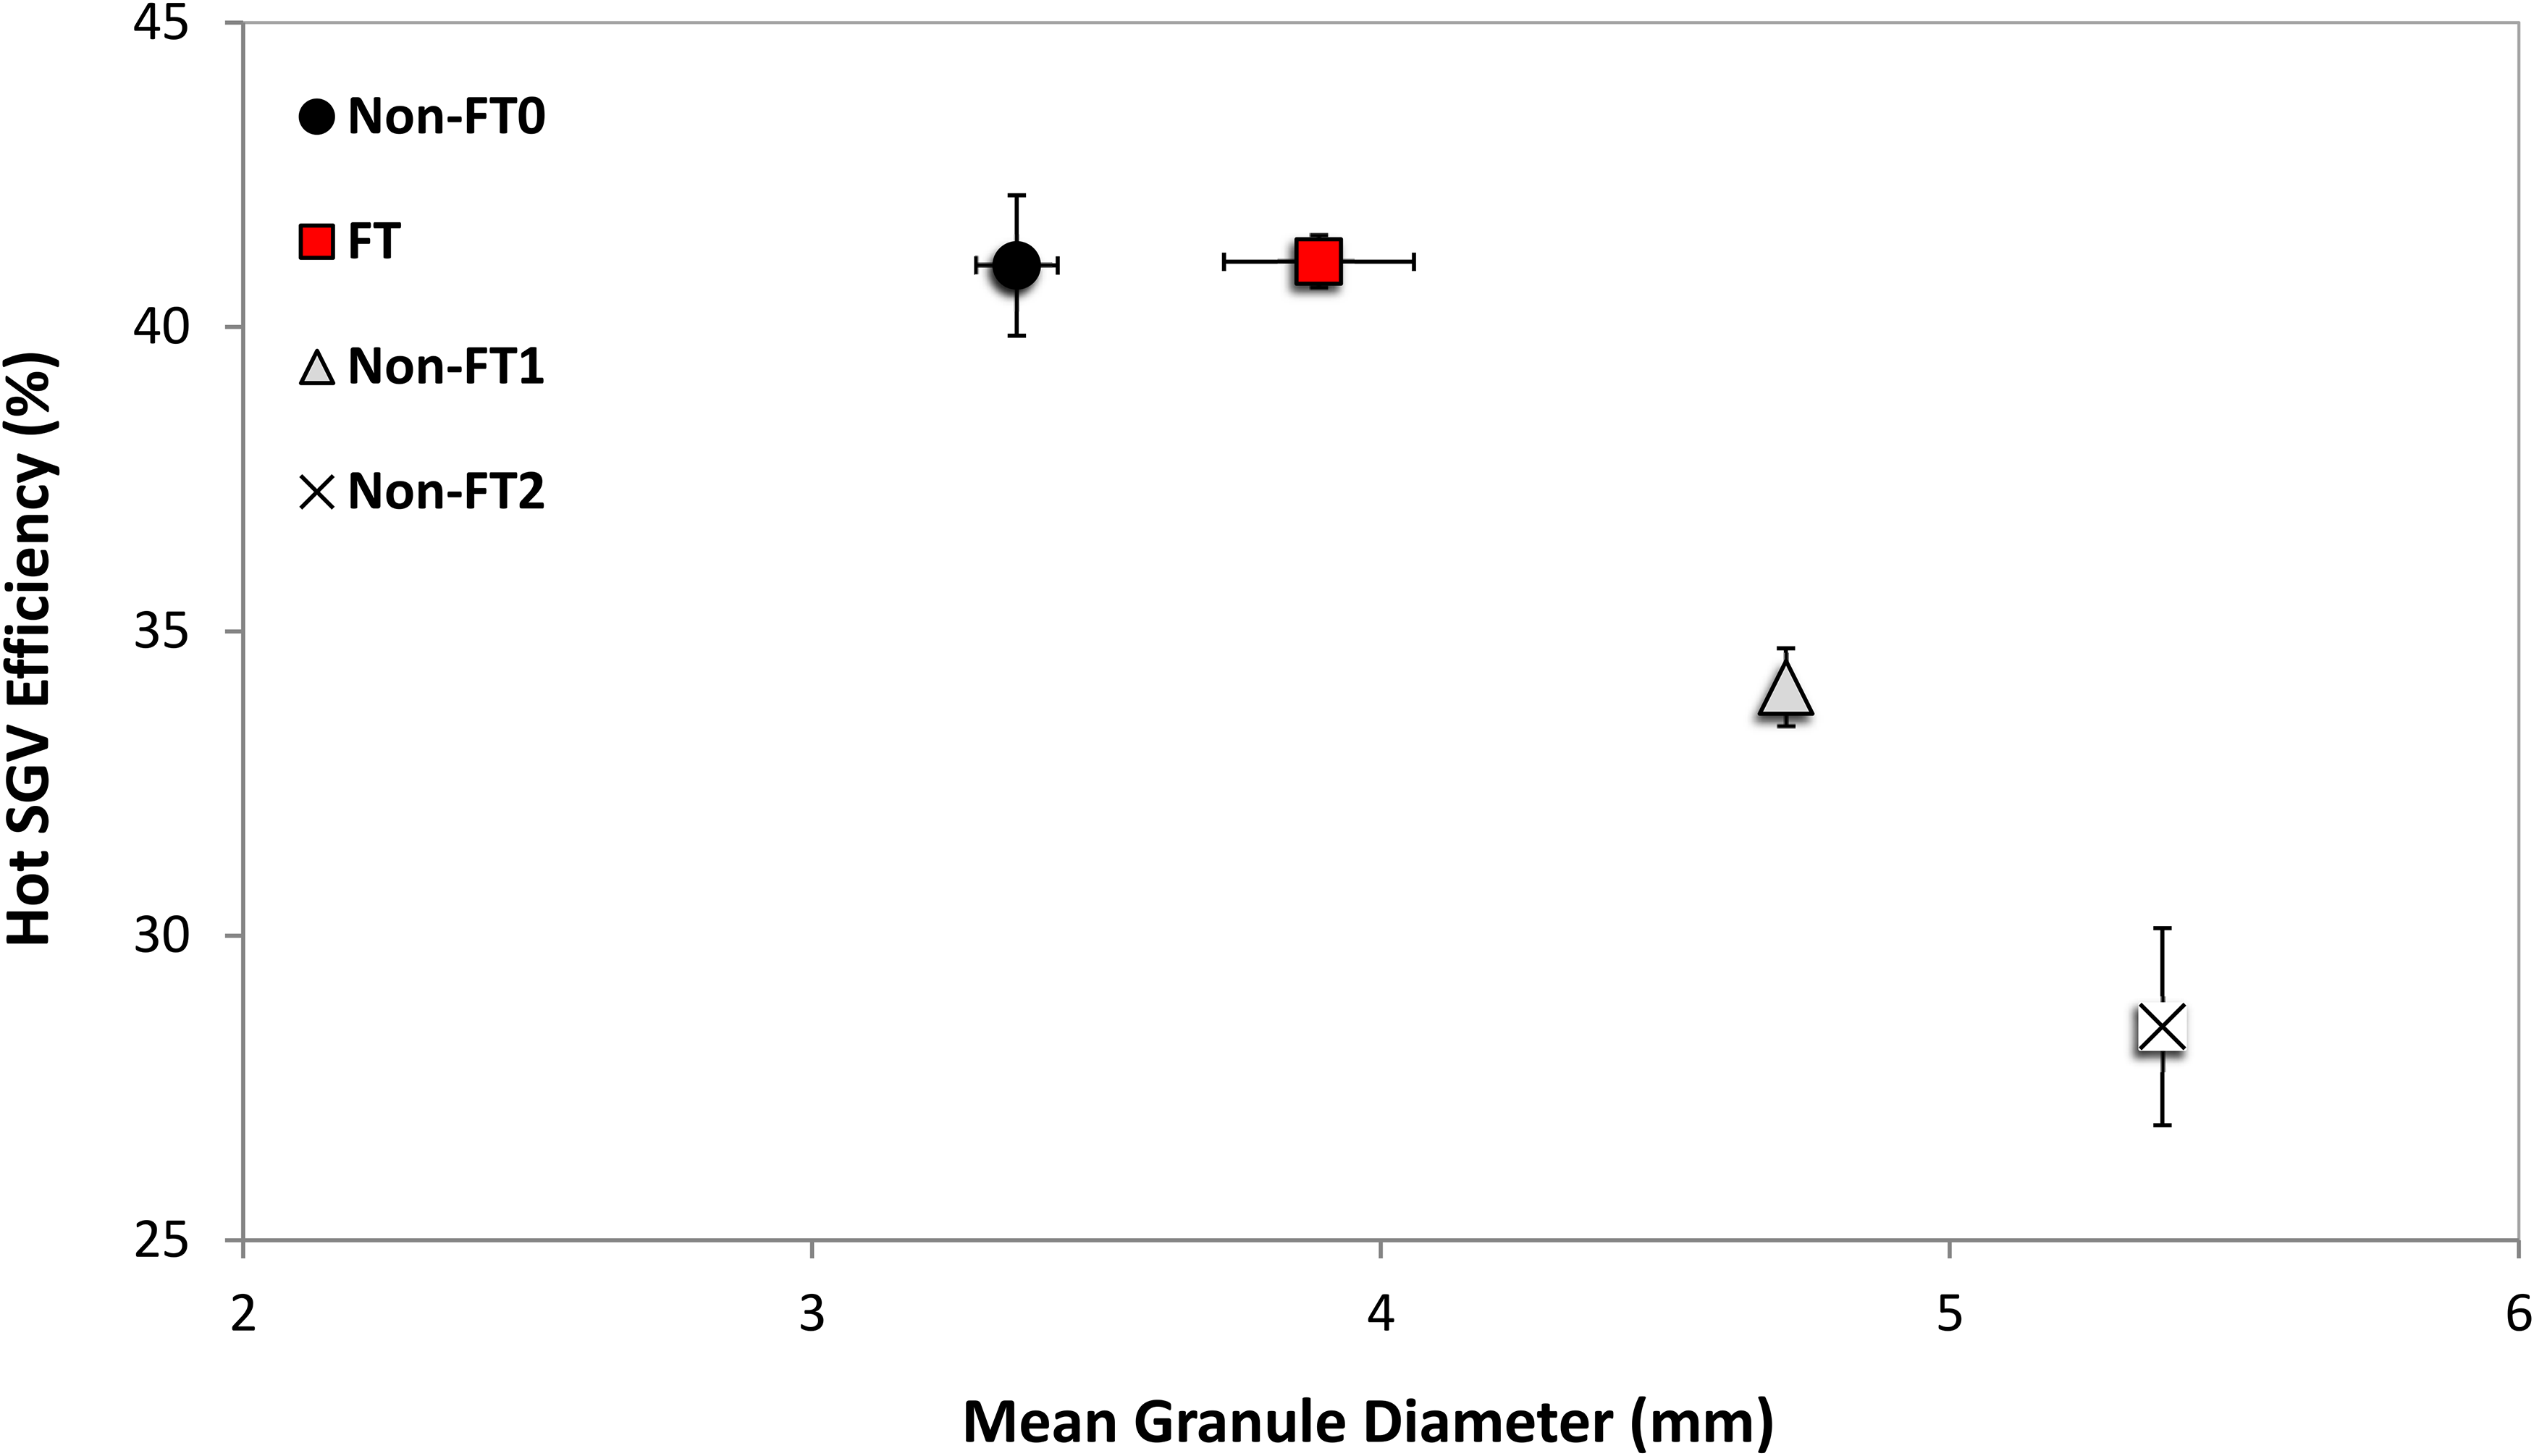
Relationship between hot SGV efficiency and mean granule diameter for bimodal blends in Table 4.
However, there was an anomaly to this trend, which was the blend designed to the FT equation (FT). The FT blend showed enhanced hot SGV efficiency compared to the other blends (Figure 12). The trend in Figure 12 showed that decreasing mean granule diameter correlated with increasing hot SGV efficiency, but it can be seen that the mean granule diameter of FT was greater than for non-FT0. The result suggested that the FT blend provided greater resistance to SGV losses when transferring from a cold to a hot bed.
With the blends investigated the FT blend created the layer PSD spread that gave the best compromise between mean granule diameter for cold SGV and layer coherence to maintain to hot SGV. This was unlike the other blends studied, which provided only cold SGV (non-FT1 and non-FT2) or hot SGV efficiency (non-FT0).
Industrial application of Fuller–Thompson blend design
IS blends were evaluated against blends designed to the FT equation (Table 5; IS1–IS3 and FT1–FT3). These blends have increasing masses of layering particles (−0.5 mm wt-%), which are similar to those of sinter plant operations. The aim was primarily to assess whether blends designed to the FT equation could create greater SGV and shorter sintering times than IS blends at equal layering particle proportions. Then further, allow evaluation of whether blends designed to the FT equation allow the incorporation of more finer or layering particles in the blend without impacting SGV or sintering time.
Cold SGV
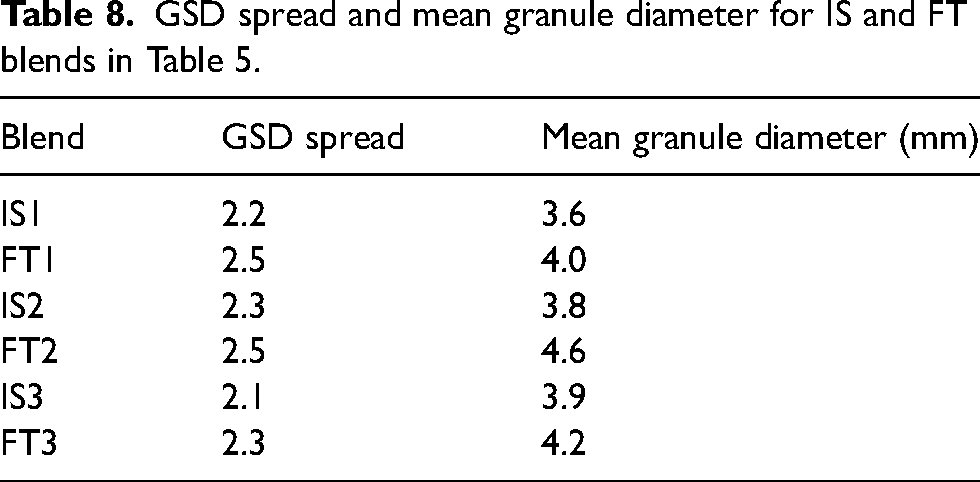
Figure 13 shows the comparison of the cold SGV of the IS and FT blends at the layering particle proportions shown in Table 5 (1 = 46 wt-%, 2 = 48 wt-% and 3 = 50 wt-%). The cumulative GSD of the blends is shown in Figure 14 and Table 8 identifies the mean granule diameters and GSD spreads. Figure 13 showed that increasing the layering material from 46 to 48 wt-% did not reduce the cold SGV significantly enough to be outside the 95% confidence intervals (IS1–IS2 and FT1–FT2). However, when increasing the layering material from 46 to 50 wt-% a decrease in cold SGV was observed (IS1–IS3 and FT1–FT3). The blends could not incorporate 4 wt-% more layering particles without reducing cold SGV.
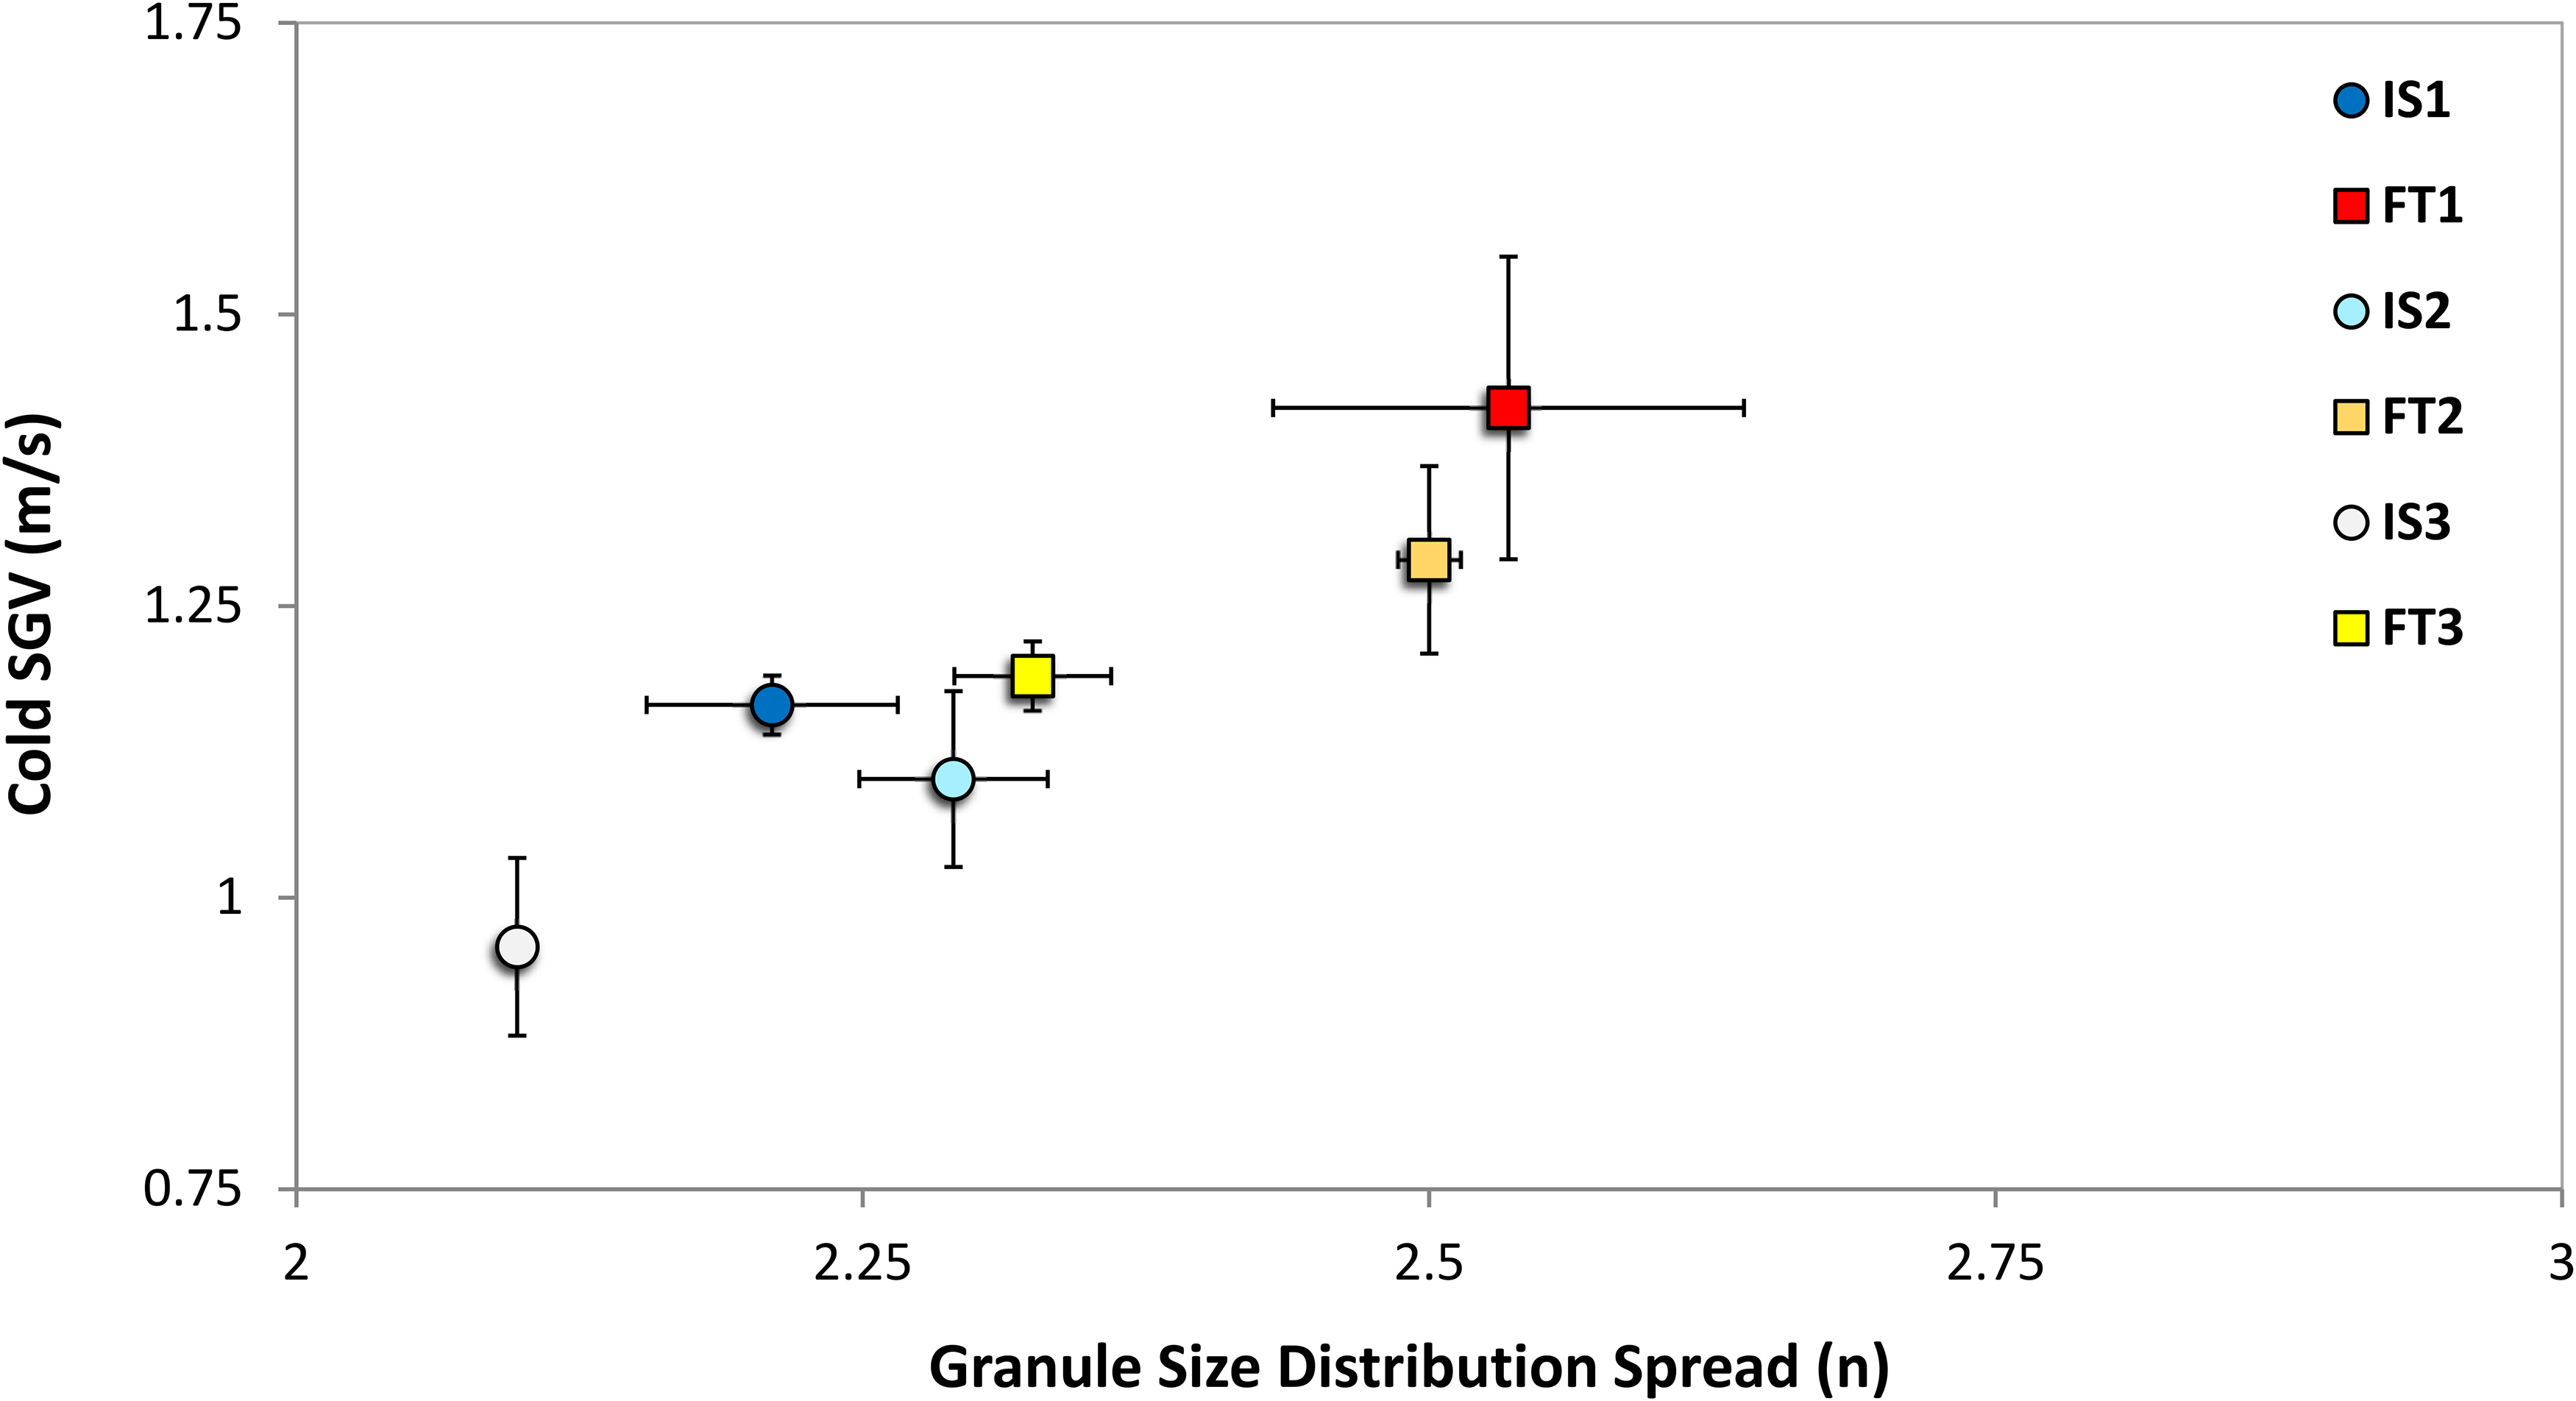
Cold SGV and GSD spread for IS and FT blends in Table 5.
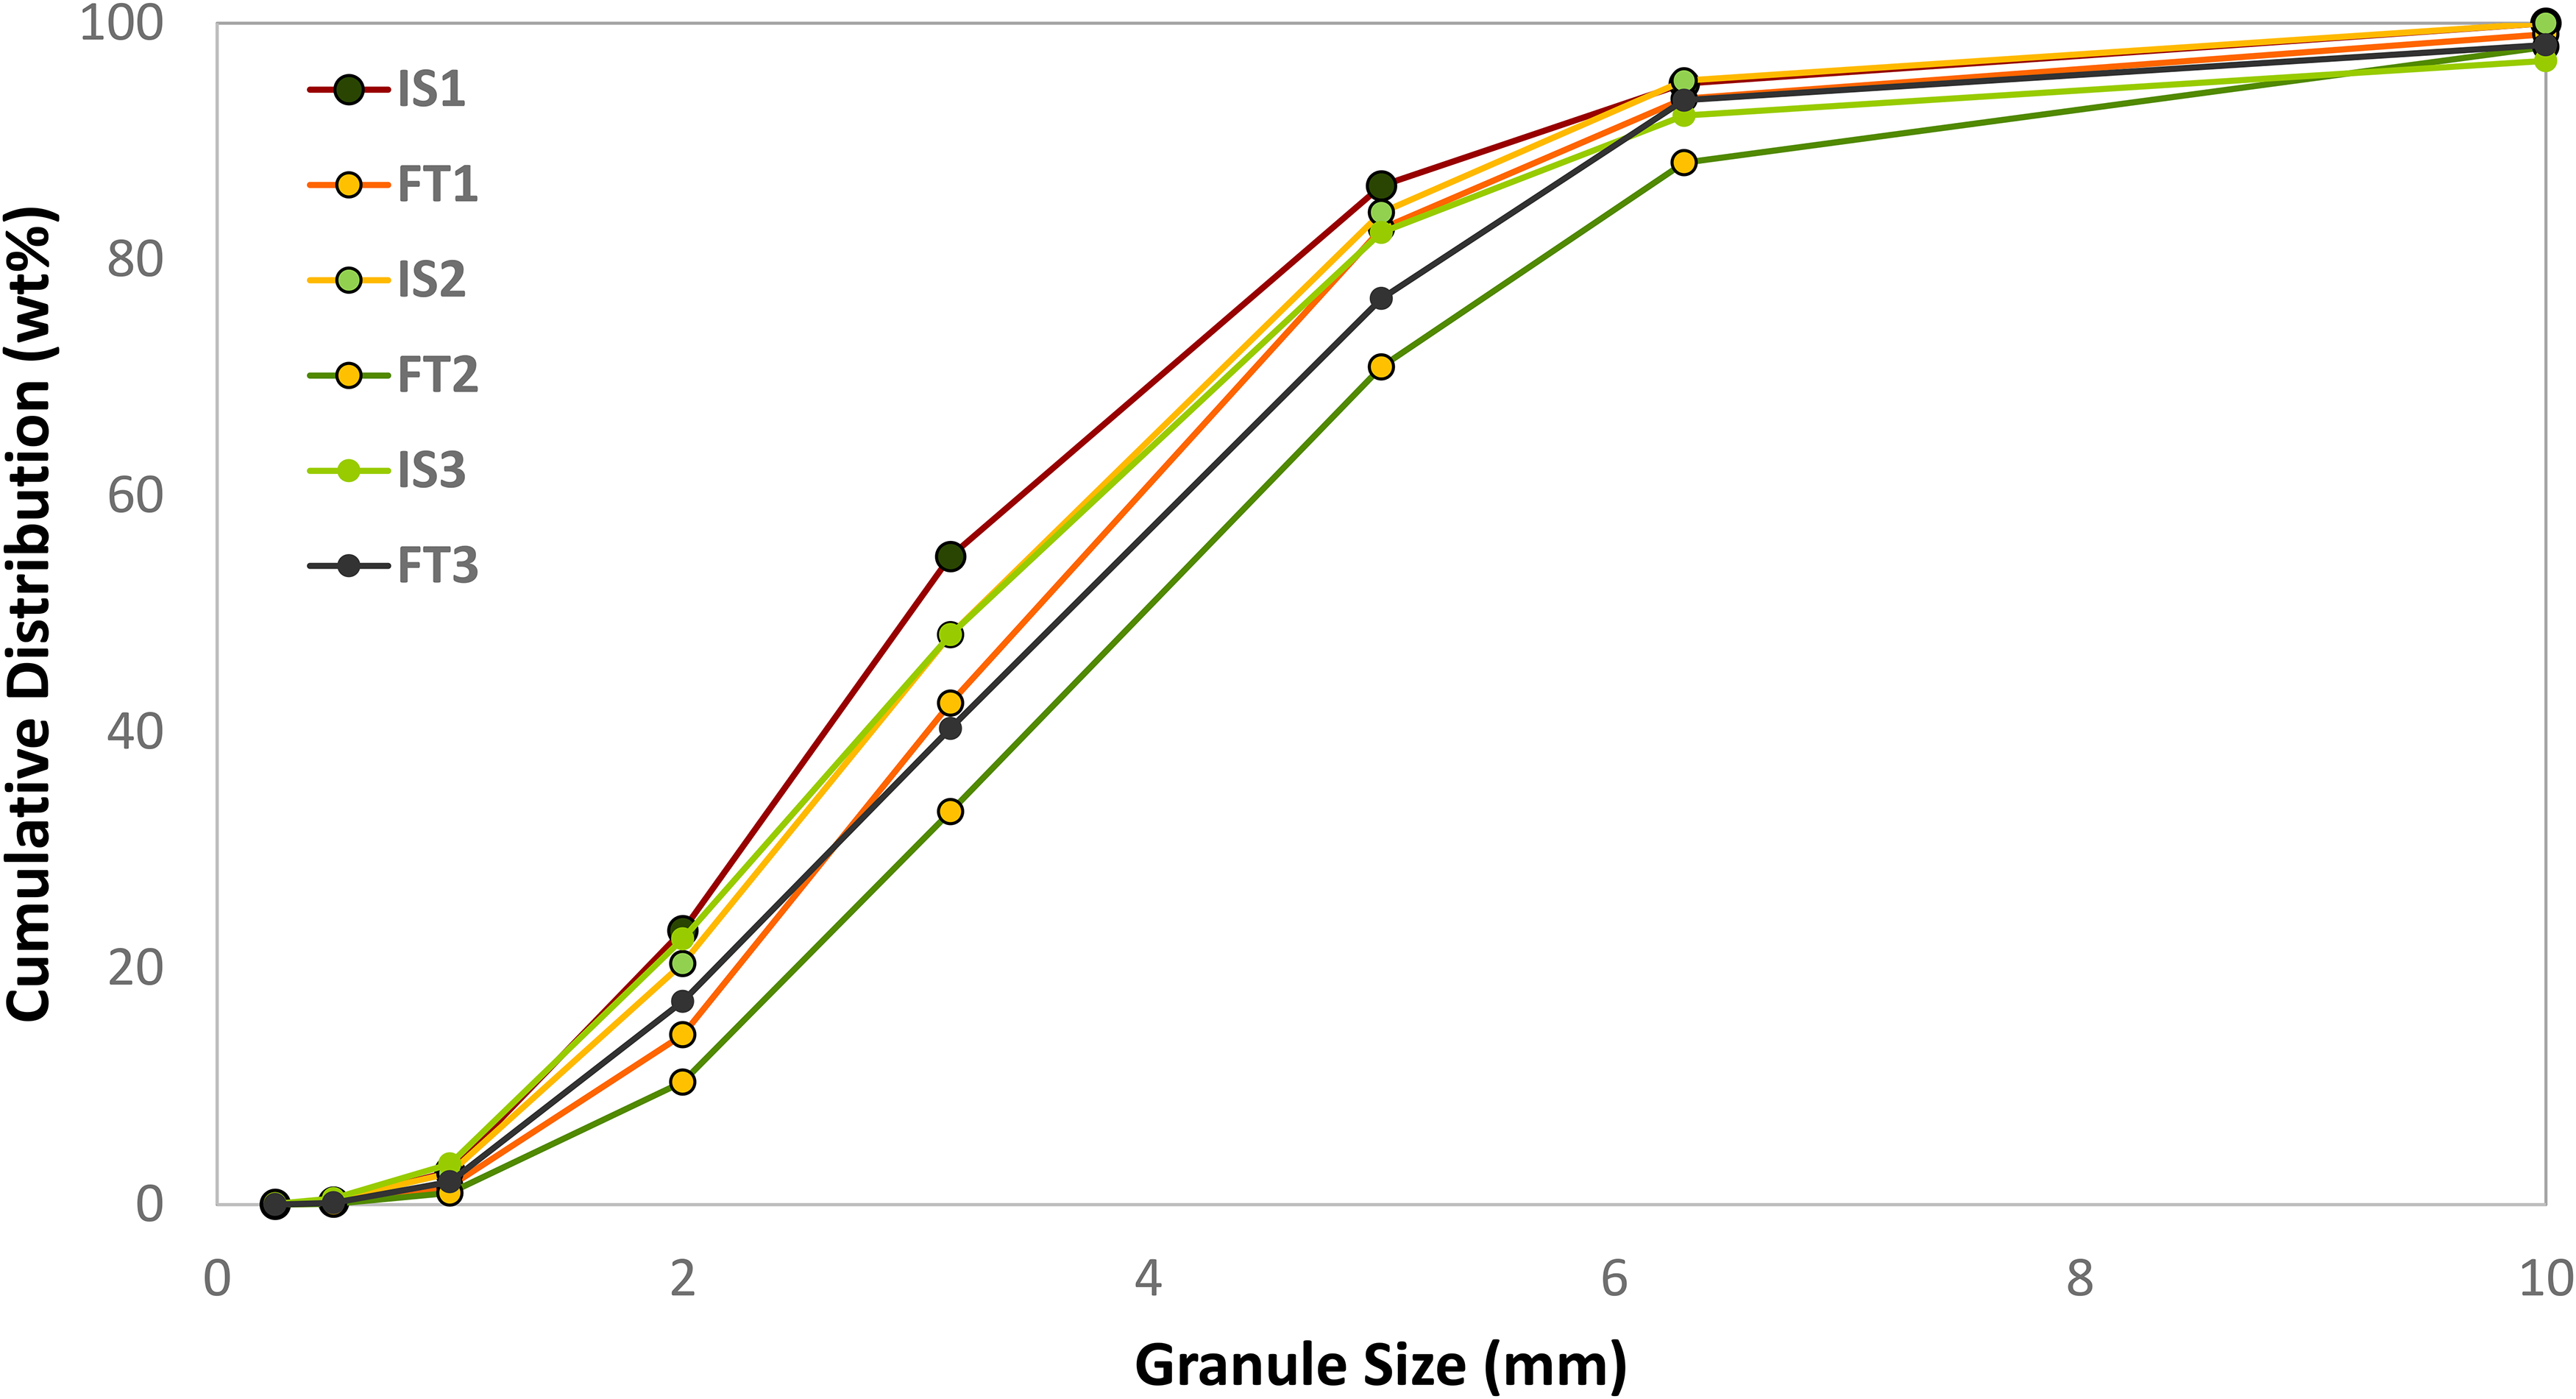
GSD measurements for IS and FT blends in Table 5.
GSD spread and mean granule diameter for IS and FT blends in Table 5.
When comparing the IS and FT blends in Figure 13, the FT blends provided enhanced cold SGV at equal layering particle proportions. It was realised from Figure 13 that the FT blends could incorporate 4 wt-% more layering particles and exhibited cold SGV results that were inside the 95% confidence intervals of the IS blend (IS1–FT3).
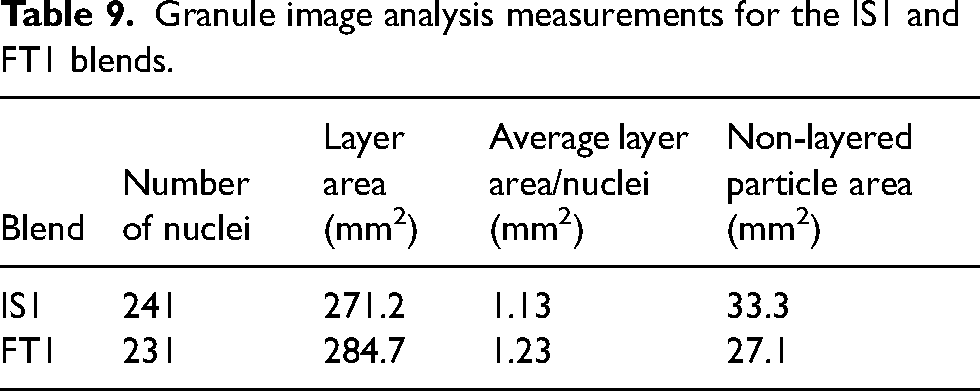
Where increased cold SGV was exhibited in Figure 13 the blends created a narrower GSD spread (larger n). It was shown in Figures 7 and 8 that wider layer PSD spreads (smaller n) produced increased cold SGV due to narrowing GSD spread (increasing n) and increasing mean granule diameter. The FT blends created narrower GSD spreads (larger n) than the IS blends as they had a wider layer PSD (n = 0.8 for FT and n = 1–1.2 for IS), thus increasing cold SGV. In the case of IS1 and FT1 this was verified by granule image analysis. It can be observed from Tables 8 and 9 and Figure 15(a)–(d) that FT1 had a larger mean granule diameter and layer area per nuclei, and a smaller mass and area of ‘non-layered’ particles compared to IS1. This corresponds with Figures 7 and 8 where wider layer PSD spreads were able to layer a greater mass of particles, consequently increasing mean granule diameter and narrowing the GSD spread.
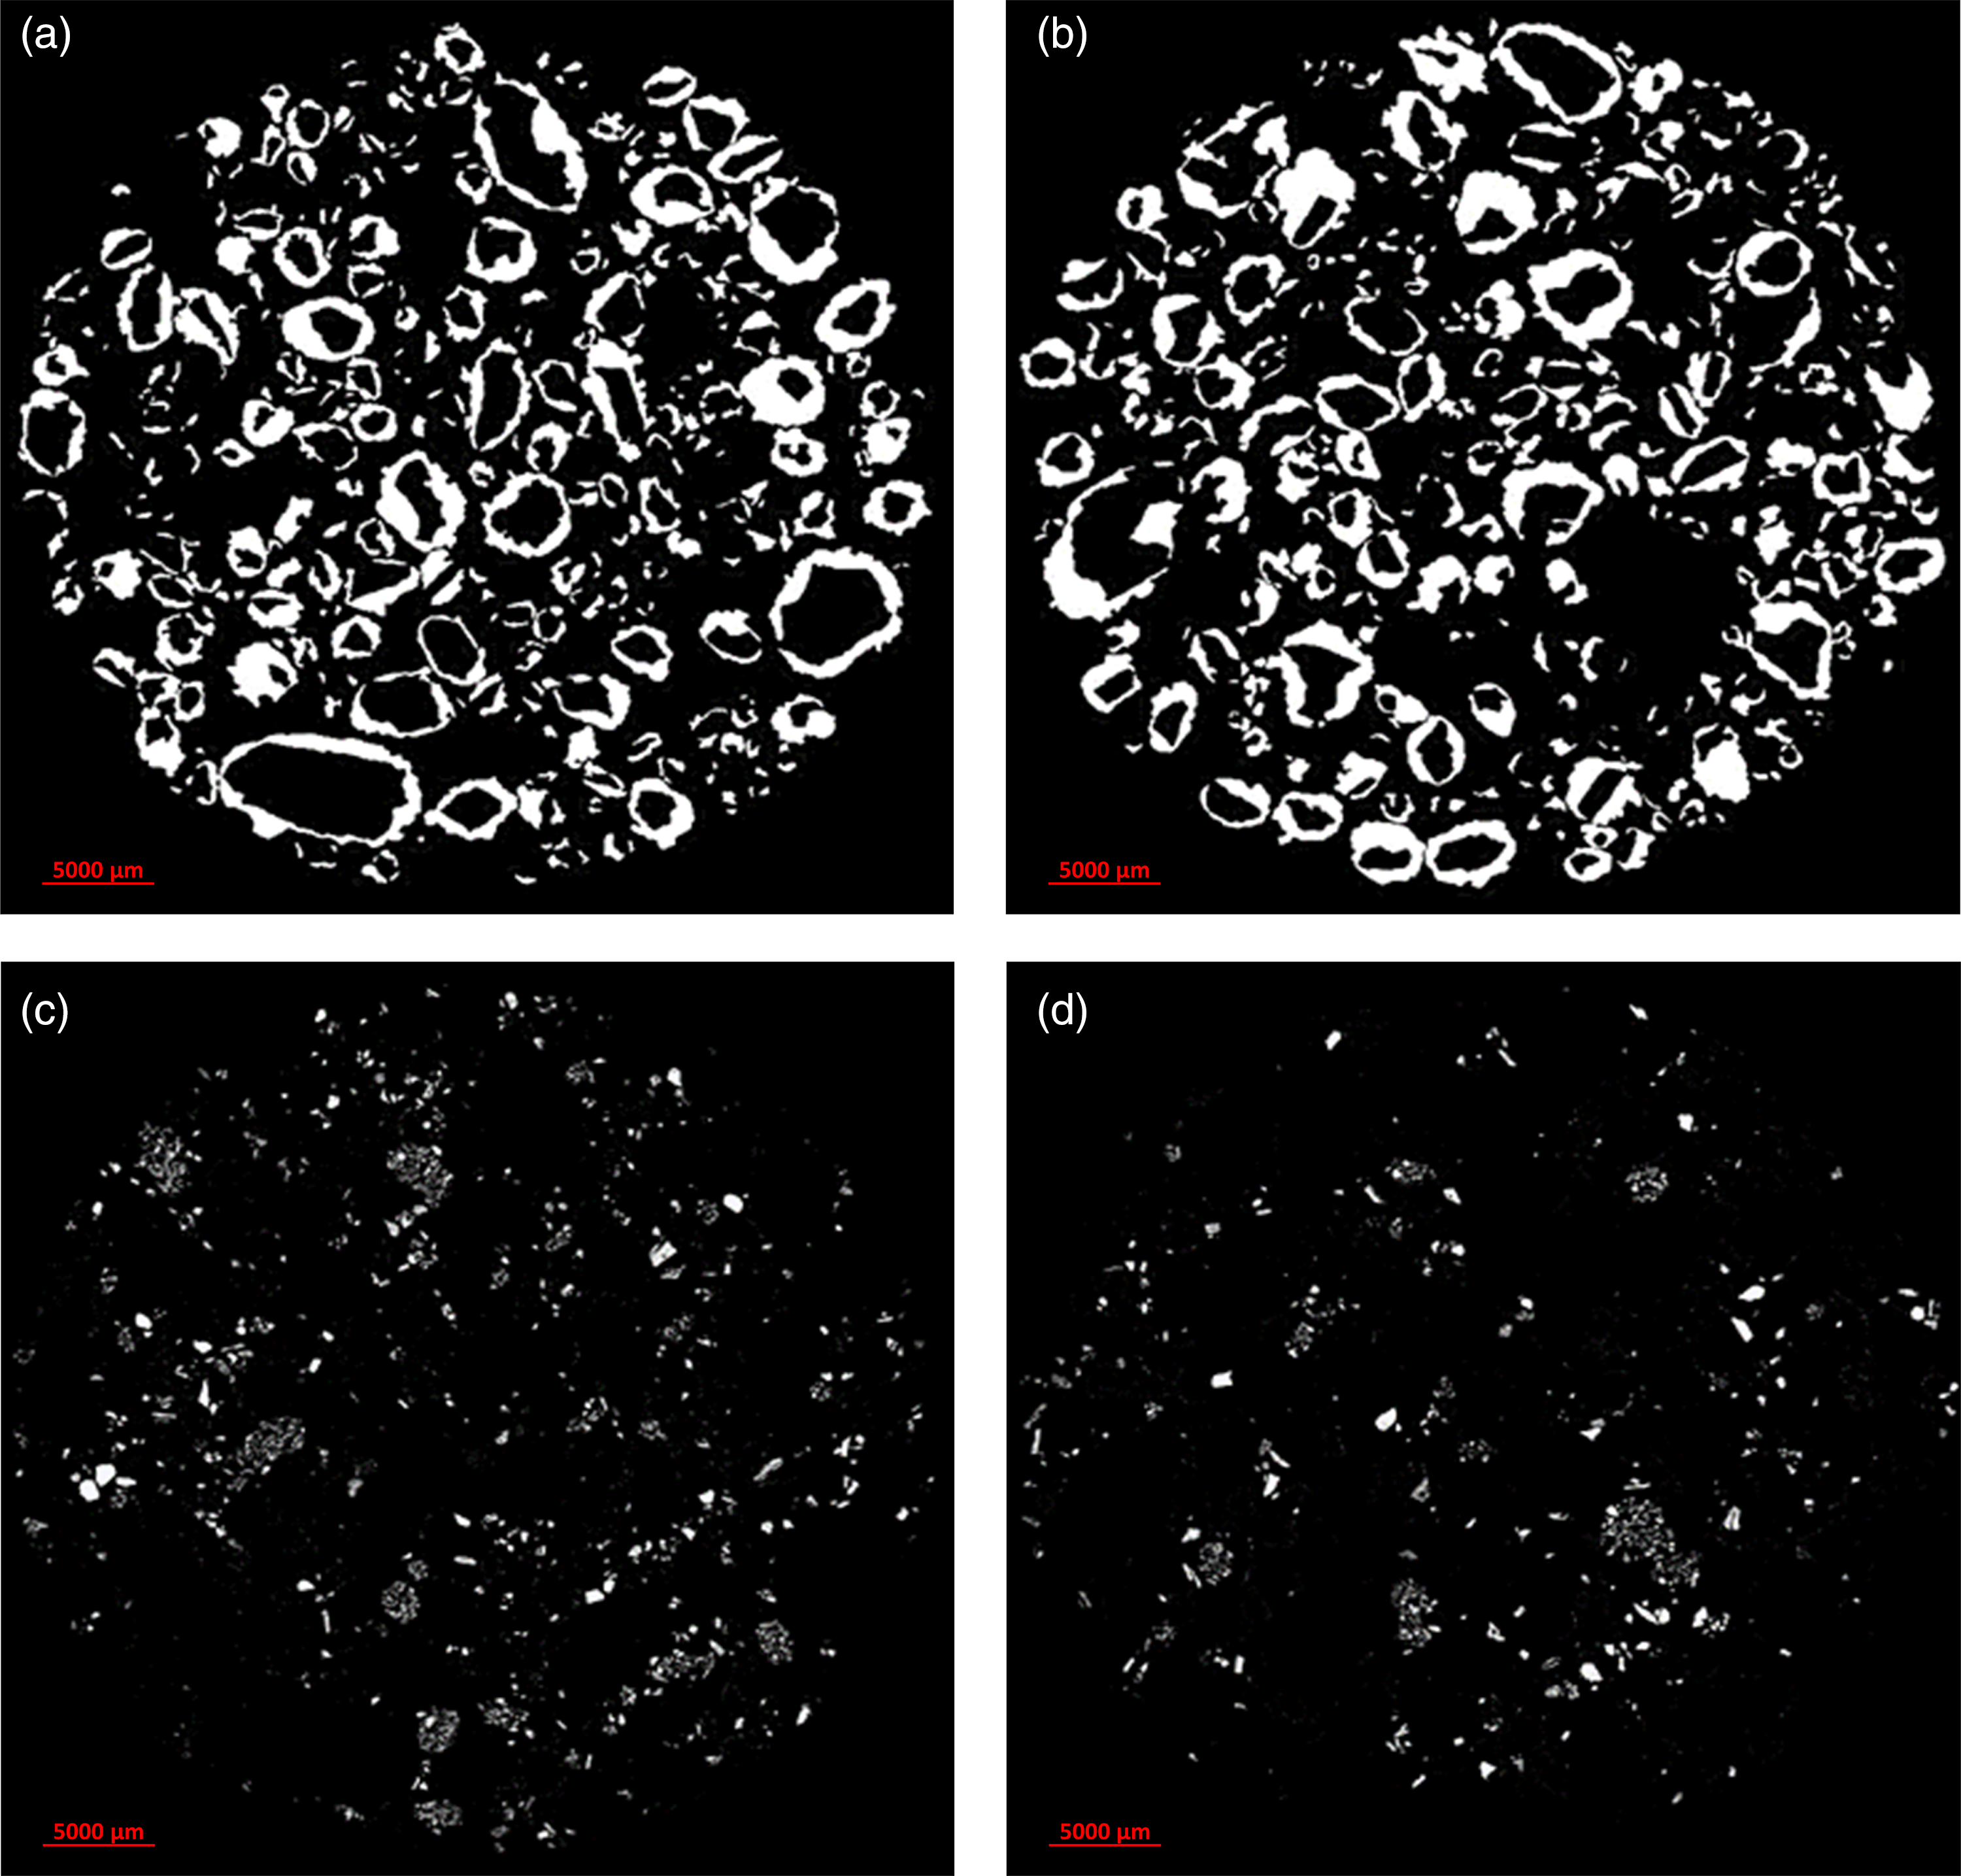
Filtered microscopic images after image analysis of layered and non-layered material for the IS1 and FT1 blends: (a) IS1 layer material; (b) FT1 layer material; (c) IS1 non-layer material; (d) FT1 non-layer material.
Granule image analysis measurements for the IS1 and FT1 blends.
Hot SGV and sintering time
Figure 16 shows the hot SGV and sintering time results for the IS and FT blends at the layering particle proportions presented in Table 5 (1 = 46 wt-%, 2 = 48 wt-% and 3 = 50 wt-%). Similar to Figure 10 there was a direct relationship between hot SGV and sintering time. Increasing hot SGV correlated with decreasing sintering time. The FT blends provided shorter sintering times than the IS blends at the same layering particle proportions. The largest decrease in sintering time at equal layering particle proportions was 9.5% (IS1–FT1). The results in Figure 16 indicated that designing the layering proportion of sinter blends (−0.5 mm) to the FT equation provided a layering PSD that gave improved hot SGV and sintering times when compared to the IS blends at equal layering particle proportions. Further, the FT blend incorporated 4 wt-% more layering particles and still exhibit sintering times that were within the 95% confidence intervals of the IS blend (IS1–FT3) demonstrating a means to increase the finer or layering particle proportions in FT blends.
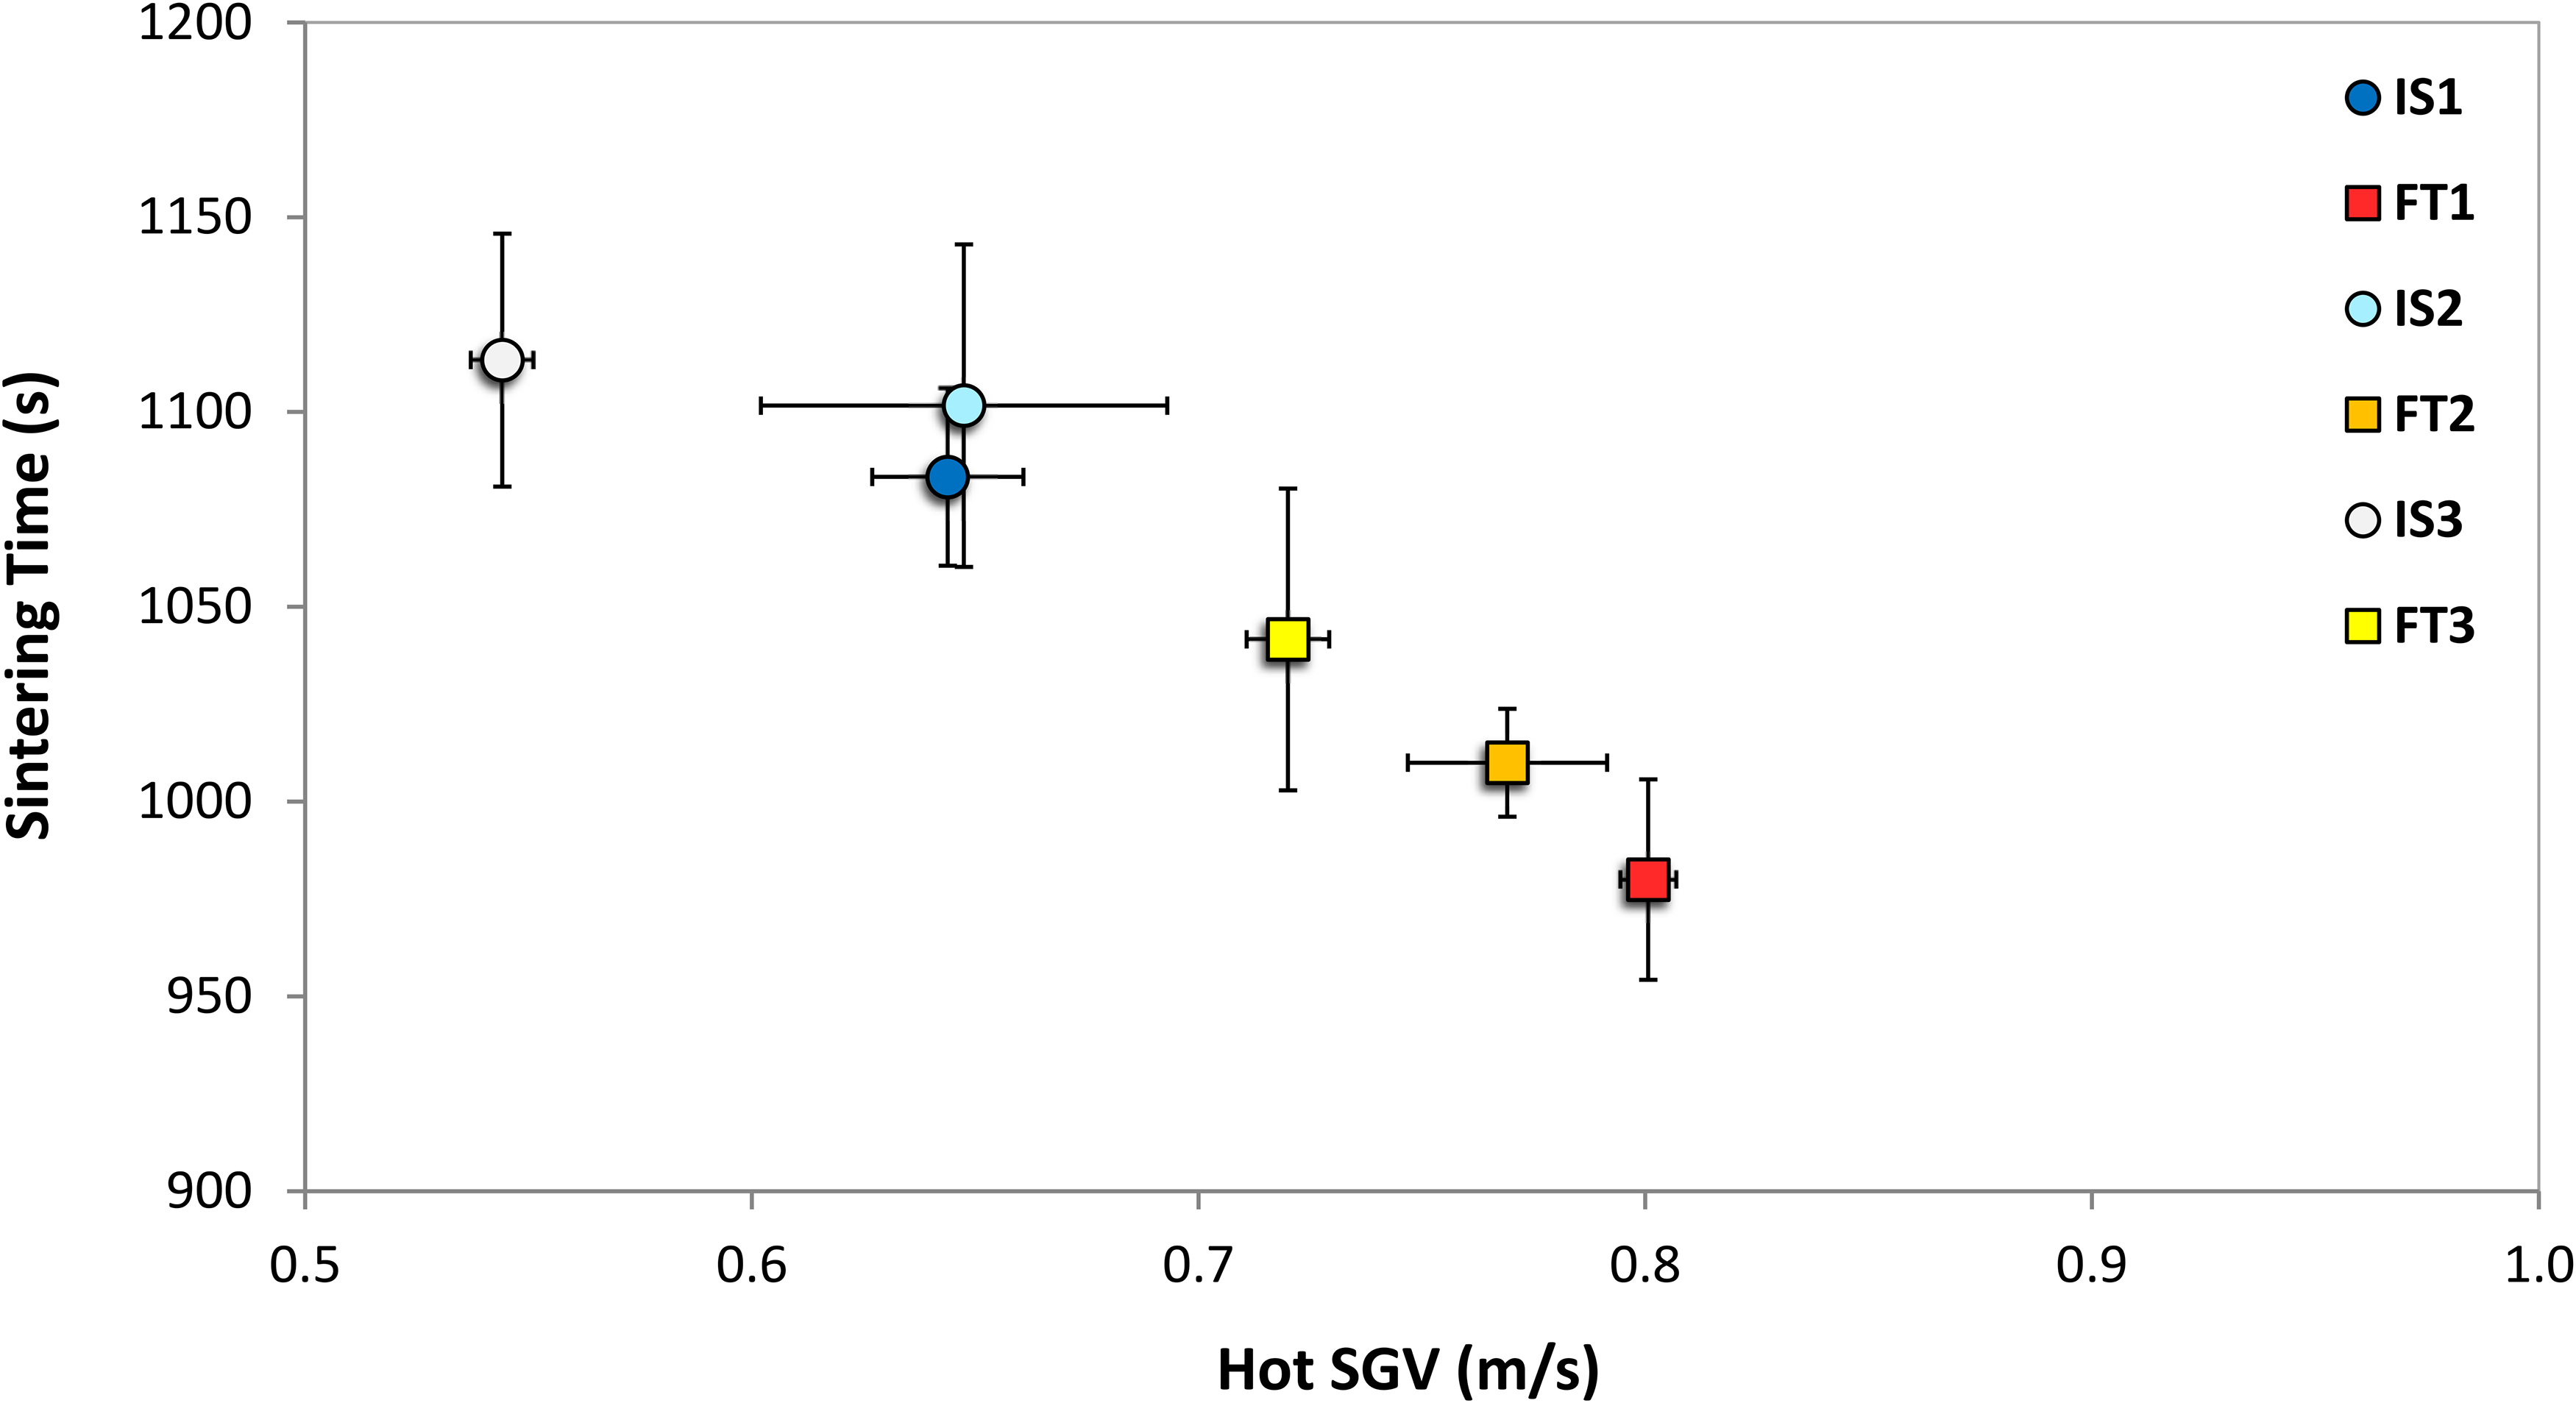
Hot SGV and sintering times for IS and FT blends in Table 5.
The reason behind the increased hot SGV relates back to hot SGV efficiency. In Figure 17 it can be seen that the maximum sintering temperature measured for the blends are the same within the 95% confidence intervals. This means that differences in hot SGV were not related to differences in sintering temperatures. In Figure 18 the hot SGV efficiency results for the blends are also the same within the 95% confidence intervals. As the FT blends were shown to provide increased cold SGV (Figure 13) this was therefore transferred through to increased hot SGV and shorter sintering times. It was shown previously that the increase in mean granule diameter due to larger layers created around nuclei resulted in the narrowing of the GSD spread, which increased cold SGV and decreased hot SGV efficiency. The FT blends did not follow this trend, as no difference between in the hot SGV efficiency could be distinguished between the IS and FT blends, even with the increased mean granule diameters of the FT blends (Table 8). This was the same as the trend seen in Figure 12 with the non-FT0 and FT blends.
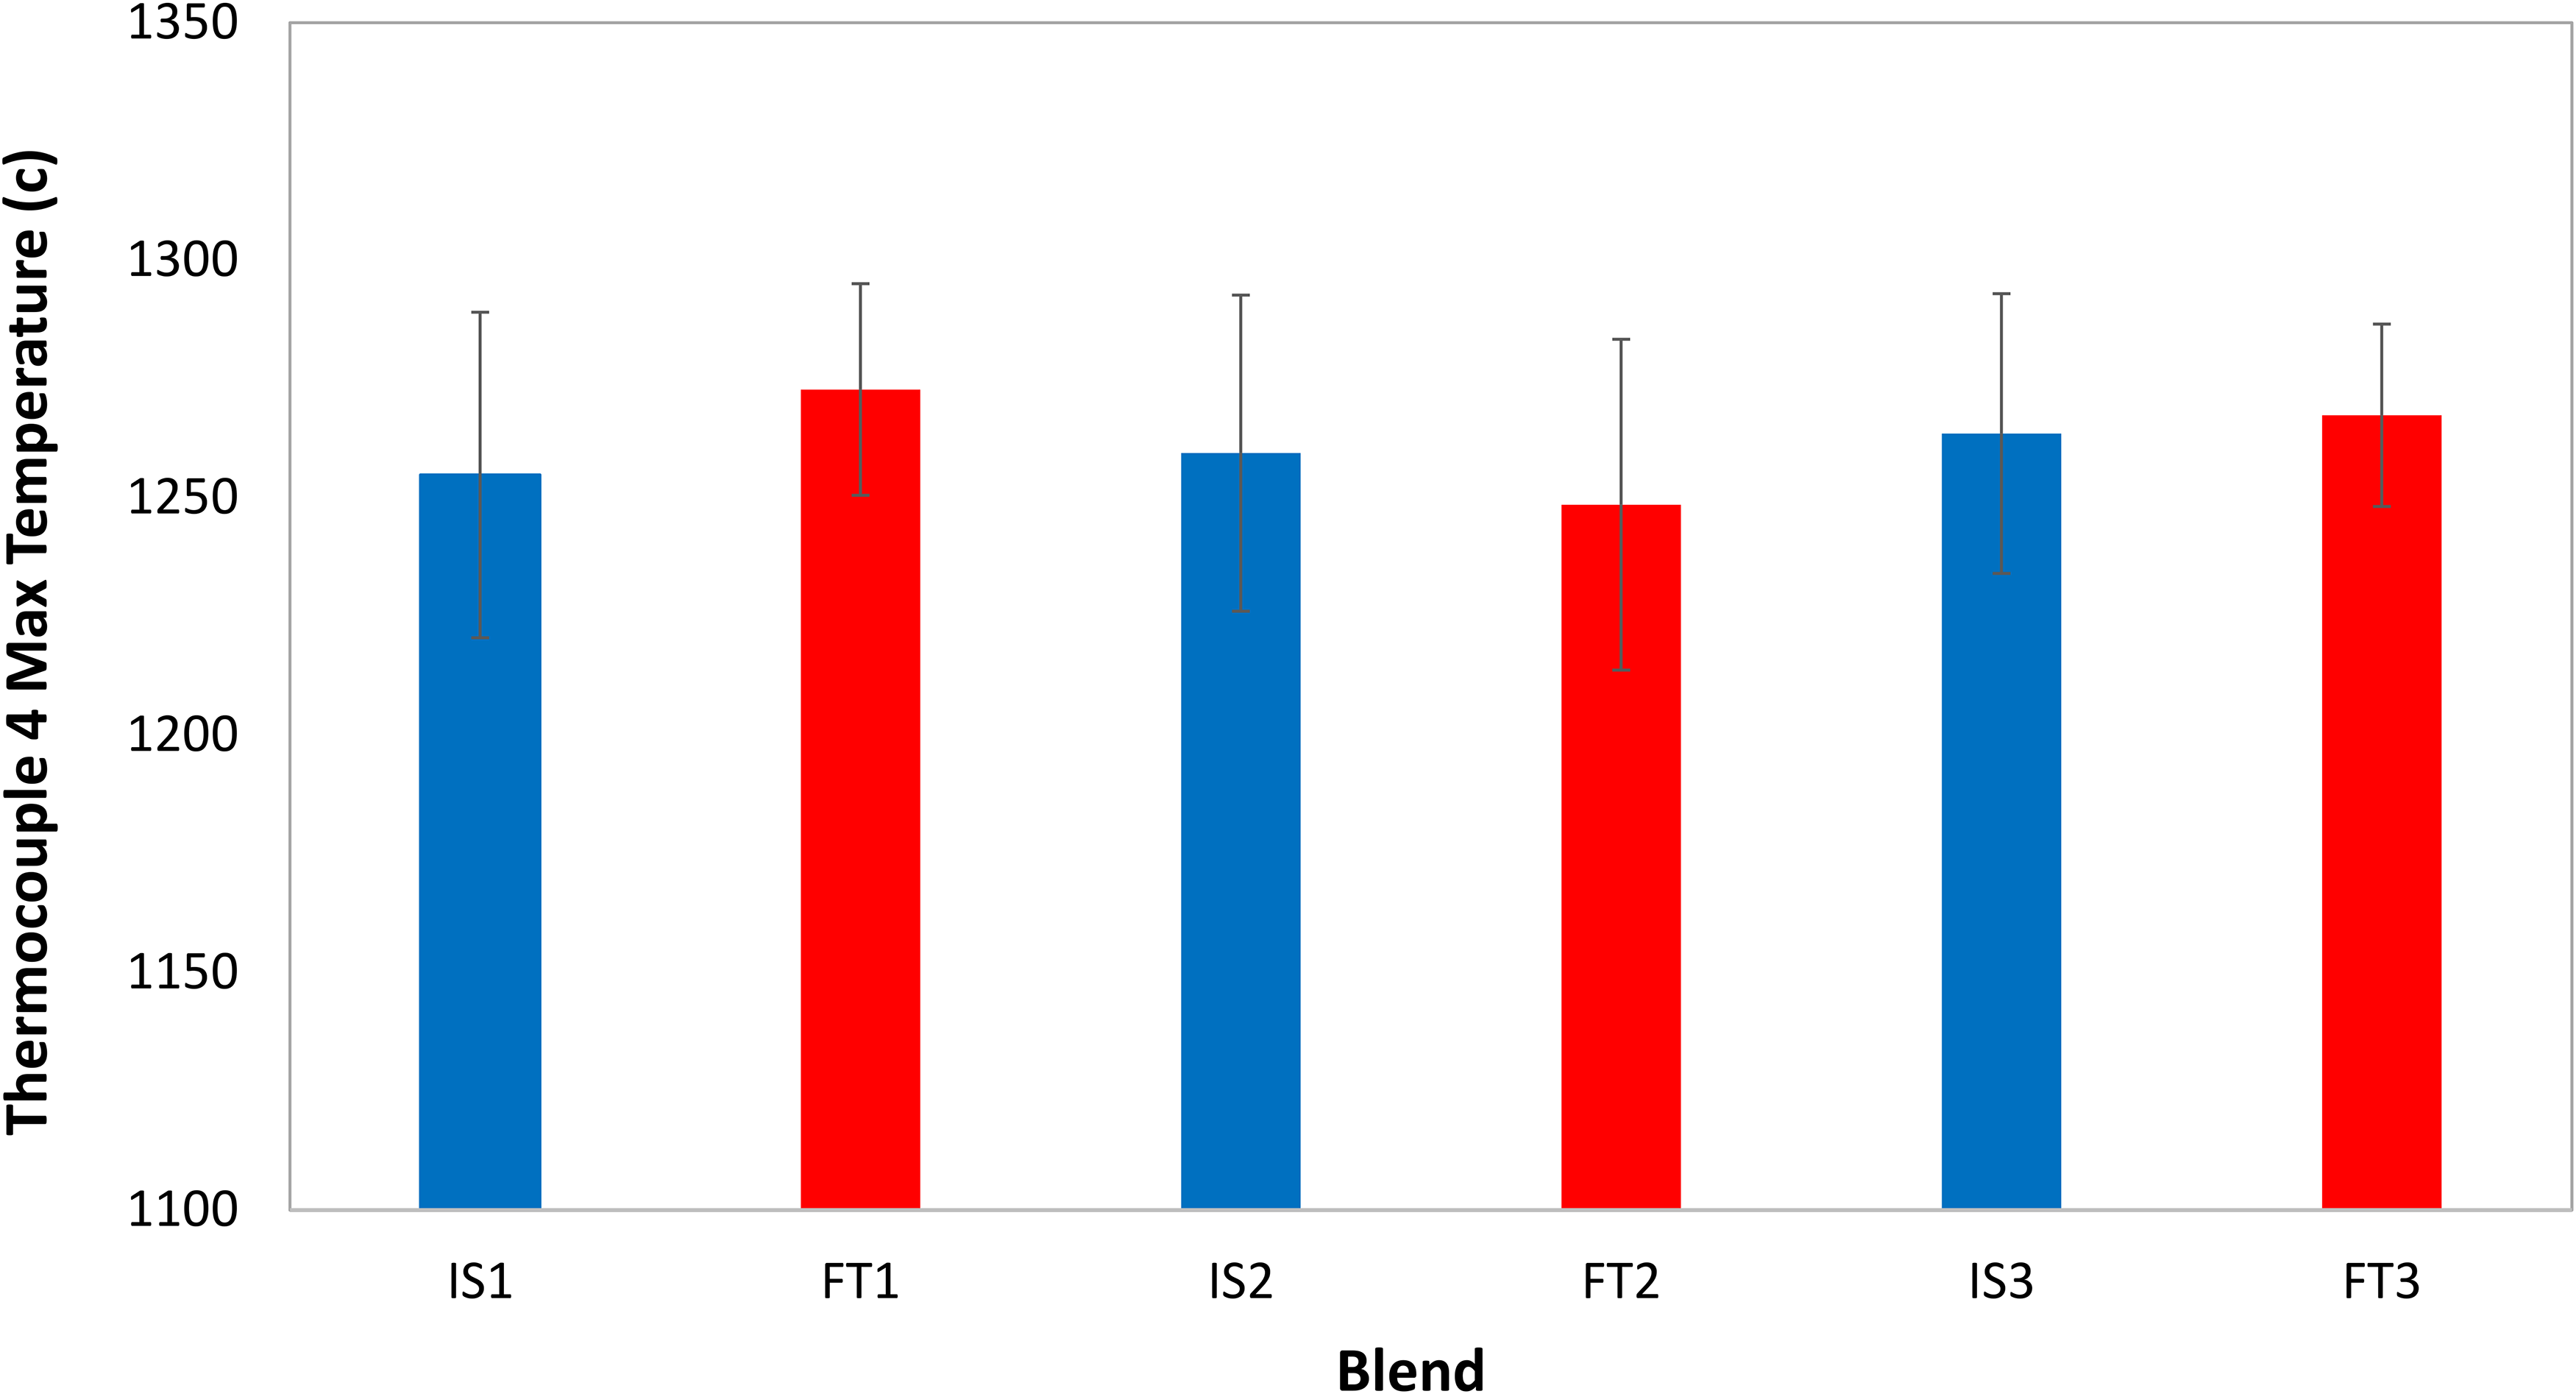
Maximum sintering temperature measured by thermocouple 4 for IS and FT blends in Table 5.
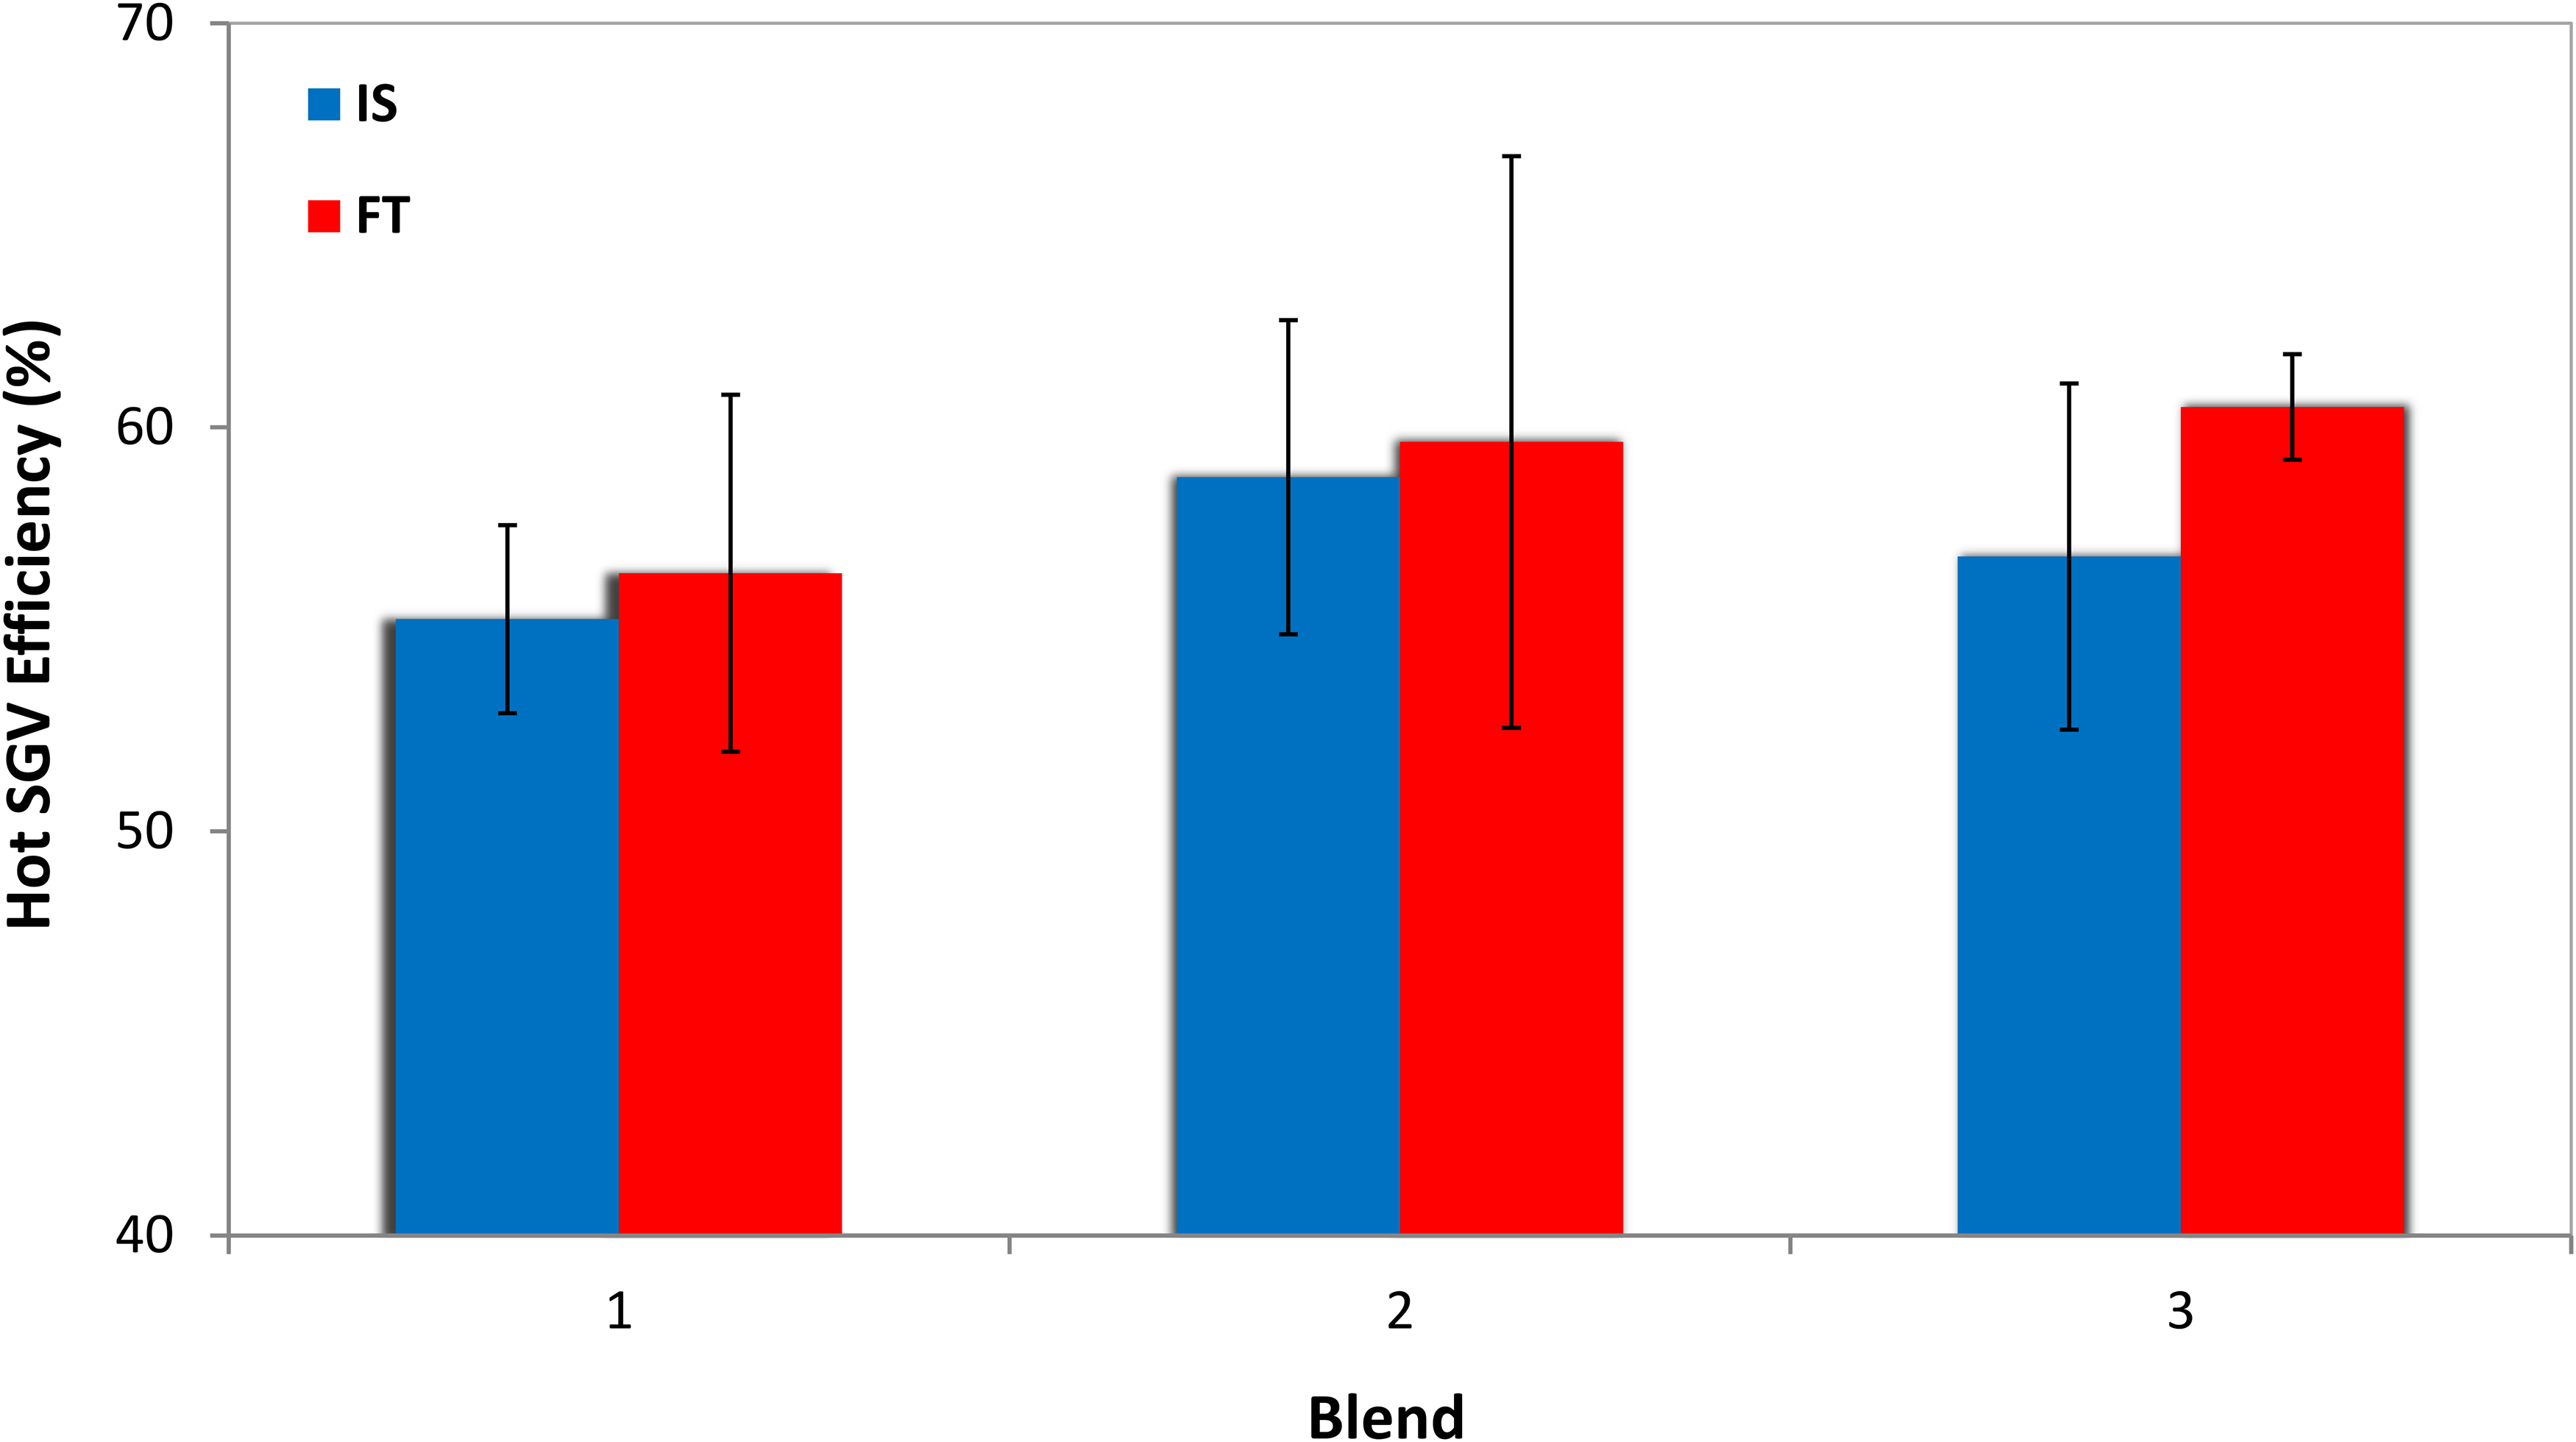
Hot SGV efficiency for IS and FT blends in Table 5.
Conclusions
This study focused on the influence of the PSD and more specifically the layering proportion of sinter blends on sinter bed SGV and productivity. A novel application of the FT equation was developed in sinter blend design to provide enhancements in bed SGV and process productivity for plant operations. Blends designed to the FT equation were compared with typically used industrial blends.
Widening the layer PSD spread in blends increased mean granule diameter and narrowed the GSD spread, which was a result of a greater mass of particles layering and fewer ‘non-layered’ (or ‘non-granulated’) particles in the bed. This led to increases in cold SGV. The measured hot SGV was lower than the cold SGV in all cases. The authors introduce a new term, the ‘hot SGV efficiency’ defined as the ratio of hot SGV to cold SGV (%) as a useful measure of the beds ability to maintain SGV during the process. Generally, an increase in mean granule diameter correlated with a reduction in the hot SGV efficiency. Beds with larger mean granule diameters lost more of their SGV during the process. With the blends investigated the blends designed to the FT equation had a greater hot SGV efficiency than anticipated based on the results from the other blends. Thus, the FT blend had the greatest hot SGV and shortest sintering times. Designing the layering proportion of sinter blends (−0.5 mm) to the FT equation provides a rationale and methodology to not only increase bed SGV and reduce sintering times but also incorporate a larger proportion of finer or layering particles in blends. Blends designed to the FT equation enabled the incorporation of 4 wt-% more layering particles and still exhibit the same or improved cold and hot bed SGV and sintering times as industrial blends. Designing the layering proportion of sinter blends (−0.5 mm) to the FT equation showed reductions in sintering times of up to 9.5% at equal layering particle proportions. This was attributed to an increased hot SGV, which was a result of increased cold SGV and enhanced hot SGV efficiency than expected with mean granule diameter. This suggests improved layer properties when designing to the FT equation, as they were able to maintain the same proportion of the SGV with larger mean granule diameters.
This study also highlights the requirement for the development of a standard protocol for accurate and repeatable laboratory sinter quality testing. Future studies would benefit from testing the blends at optimum moisture and also maintaining a similar sinter chemistry.
Footnotes
Acknowledgements
Thanks to Cardiff University School of Engineering for the opportunity to conduct an Engineering Doctorate degree and the resources they provided. Without the support of Tata Steel UK and Tata Steel Europe, and funding through EPSRC, this study would have never materialised. Access to R&D facilities and industrial experts enabled a new research idea to be developed, and the knowledge gained implemented within the business for future utilisation.
Declaration of conflicting interests
The authors declared no potential conflicts of interest with respect to the research, authorship and/or publication of this article.
Funding
The authors received no financial support for the research, authorship and/or publication of this article.