
Abstract
Tea plant in East China usually suffers from frost damage due to sudden low temperature under late spring coldness. A fan is a frost protection device that can blow the warmer air aloft to the tea canopy level under radiative frost meteorological event with temperature inversions. In this study, the flow fields and the temperature distribution downstream a fan were numerically simulated. It is found that the flow structure downstream the fan is divided into two flow regimes: one is the jet flow that blows the warmer air aloft downward and the other one is vortex ring that enhances turbulence at the tea canopy level. The jet and the vortex characteristics are nearly independent on the shaft rotation speed. However, the heat transfer process is obviously related to the flow structures, and the temperature distribution on the tea canopy plane coincides with the vortex characteristics. The temperature peak is near the core of the flow vortex, and the high-temperature zone coincides with the vortex ring regime.
Introduction
Late spring coldness is a meteorological event that usually occurs in East China, and crops and other plants may experience frost injury. Figure 1 shows a tea plant in Zhejiang province covered by severe snow under such a climate in early March 2016, in which the sprouting bud might be caused damage or death. Therefore, various measures were suggested to be adopted to protect the plants from frost injury. Frost was defined as falling into two categories: “advective” and “radiative.” Advective frosts are associated with large-scale incursions of cold air with a well-mixed, windy atmosphere and a temperature that is often sub-zero, even during the daytime. Radiative frosts are associated with cooling due to energy loss through radiant exchange during clear, calm nights, and with temperature inversions (i.e. temperature increases with height). 1 Fans are non-expensive devices to protect plant from radiative frosts and suitable for temperature inversions between a height of 2.0 and 10 m with at least 1.5°C or greater on most frost nights. Fans blow air to mix warmer air aloft with cooler air near the surface. They also break up microscale boundary layers over plant surfaces to improve sensible heat transfer from the air to the plants. However, each plant has its own critical damage temperature. Both higher and lower blow velocity might influence the frost protection role or even have negative effect. Therefore, the detailed flow characteristics downstream the fan and the temperature evolution are more critical and useful and need to be carefully investigated.

A tea plant covered by snow in early March 2016.
Various kinds of fans are applied depending on the specified purpose. For example, fans are used for cooling small electronic devices such as home appliances and personal computers,2,3 which are typically the apparatus that improve temperature distribution by blowing air. Because the traditional design algorithms for fans depend strongly on the designer’s skills and experiences, some improved design methods were developed, and numerical analysis as a supplement was extensively performed to validate the design efforts and decrease the trial-and-error time.3,4 Most of the numerical simulations focused on the flow fields near the impeller.2,4–6 In addition, more and more work-concerning noise was also carried out recently.7,8 In this article, we mainly addressed the flow characteristics downstream the impeller and the temperature variation near the plants.
Formation of temperature inversion and boundary conditions for computation domain
Radiation frosts are common occurrences. They are characterized by a clear sky, calm or very little wind, temperature inversion, low dew-point temperatures, and air temperatures that typically fall below 0°C during the night but are above 0°C during the day. Under clear night-time skies, more heat is radiated away from the surface than the heat received, so the temperature drops. The temperature falls faster near the radiating surface causing a temperature inversion to form. As there is a net loss of energy through radiation from the surface, the sensible heat content of the soil surface and air near the surface decreases. There is a flux of sensible heat downward from the air and upward from within the soil to the surface to replace the lost sensible heat. This causes the temperature to decrease aloft as well, but not as rapidly as at the surface. The depth to the top of the temperature inversion is variable depending on local topography and weather conditions. Figure 2 shows the development of an inversion over our tea plant at Danyang city, and the data were measured in early April 2015, showing obvious temperature inversion. It is noted that the temperature begins to decrease with the height near 4 m. The level where the temperature profile changes from an inversion to a lapse condition is called the ceiling. Therefore, the fan was mounted about 1.5 m higher than the ceiling so that it can blow the warmer air near the ceiling stream downward. Figure 3 shows the computation domain, and the size of the cubic configuration is roughly determined by our experience that the fan investigated later processes the blowing capacity no more than the range defined by the cubic block. The boundary conditions of temperature for the computation domain were determined according to the temperature measured at 1 o’clock as shown in Figure 2 and listed in Table 1. It can be seen that the temperature difference between the ceiling and the canopy level is 2.7°C and therefore it is a suitable case for fan adoption.

Temporal and spatial distribution of temperature inversion.

Computation domain.
Temperature distribution at 1 o’clock for computation.

Incidentally, there are two subcategories of radiation frosts. A “hoar frost” shown in Figure 4 occurs when water vapor deposits onto the surface and forms a white coating of ice that is commonly called “frost.” A “black” frost occurs when temperature falls below 0°C and no ice forms on the surface. If the humidity is sufficiently low, then the surface temperature will not reach the ice point temperature and no frost will form. When the humidity is high, ice is more likely to deposit and a “hoar frost” can occur. Because the heat is released during the ice deposition process, hoar frosts usually cause less damage than black frosts. In addition, the dew-point temperature mentioned before is the temperature reached when the air is cooled until it reaches 100% relative humidity, and it is a direct measure of the water vapor content of the air. Therefore, efforts of water atomization and spray are sometimes adopted to increase the dew-point temperature.9,10 Investigations concerning dew-point temperature involve two-phase flow and phase change and will be not concerned, and subsequently only the air flow fields and the temperature distribution will be studied in this article.

Hoar frost.
Numerical simulation
Fan description
The fan studied here is one of our fan arrays used in Danyang city as shown in Figure 5, 11 and Table 2 lists the configuration parameters. The angle between the fan shaft and the horizontal level is 15°.

Fan array in Danyang city.
Parameters of fan.

Governing equations
The equation for mass conservation, or continuity equation, can be written as follows

S
m source is the mass added to the computation domain, and in this case, the mass in the domain is assumed unchangeable. In addition, it is assumed that the flow velocity is low enough that the density

Conservation of momentum in an inertial reference frame is described by

Supposing the flow velocity and the pressure are steady after the fan starts to run, therefore equation (3) is simplified as
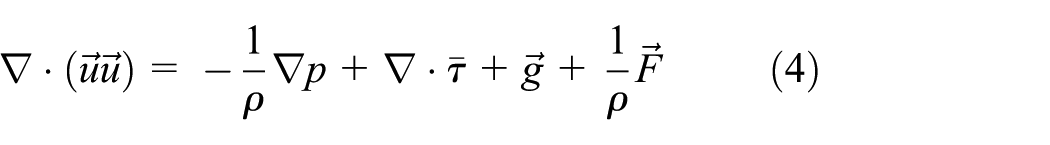
where
According to the first law of thermodynamics, the conservation of energy expressed in terms of temperature
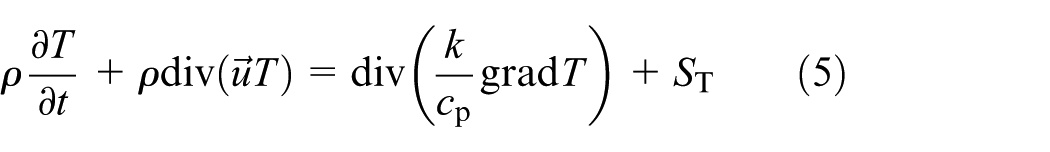
where T is temperature, k is thermal conductivity, cp is specific heat at constant pressure, and ST is inner heat source.
Solver
The commercial Reynolds-averaged Navier–Stokes (RANS) code (ANSYS Fluent 14.5) is used to solve the viscous, incompressible flow. The conservation equations for mass and momentum are solved in integral form using a finite volume method (FVM). The integrals are approximated using the midpoint rule and the simple algorithm which couples pressures and velocities. The RANS method is modeled using the shear stress transport (SST) k–ω turbulence model. Time is discretized using an implicit Euler scheme.
Both on the six faces of the computation domain shown in Figure 3 and the fan surface, a no-slip condition is applied using a wall function.
Grid generation and independence verification
Unstructured grid system is employed as shown in Figure 6. To find the optimum number of grids, grids dependency test has been carried out and nearly 9.5 × 10⁶ has been selected as the optimum number of grids. Figure 7 shows the results of grid dependency test, in which the temperature is along the intersection line of the plane y = 5 m and z = 1.2 m in the coordinate system shown in Figure 3.

Computational mesh: (a) fan, (b) fan domain, and (c) computation domain.

Grid-dependency test.
Results and discussions
The steady flow fields were first calculated to get the velocity distribution of the computation domain and then the temperature profile was calculated based on the velocity characteristics. The streamline and the velocity fields are shown in Figure 8, and it is clear that the flow structure downstream the fan involves two flow regimes, one is jet flow and the other one is triangular-like vortex ring.

Flow pattern downstream the fan: (a) fan downstream vortex ring, (b) velocity distribution on plan y = 5 m, and (c) sketch of flow regimes.
The jet flow intensified by the fan is to blow the warmer air aloft downward, and the vortex ring is to enhance turbulence at the tea canopy level. The flow structure of the vortex ring is of utmost interest because it determines how and to what extent temperature distributions could get in heat transfer events. In order to depict the flow characteristics, the flow structure downstream the fan is schematically profiled in Figure 8(c) that involves two flow regimes and three geometric variables. Figure 9 shows the three variables against the shaft rotation speed. It is interesting that the flow patterns downstream the fan is nearly independent on the rotation speed, in which B is approximately 4.3 m, and the horizontal distance between the fan and the vortex core (L/cos15°−Rsin15°) is also about 4.3 m. Another one important geometrical variable, which is not shown in Figure 8(c), is the side length of the triangular-like vortex ring and is nearly 5.5 m. Maybe the flow structures are related to the design of the fan and the computation domain boundary that are needed further study.

Vortex characteristics against rotation speed.
Figure 10 shows the temperature distribution on the canopy plane (z = 1.2 m), the temperature is between 0.5°C and 1.5°C, and it is obviously higher than the original temperature of −0.2°C. Similar to that of Figure 9, the temperature distribution is nearly independent on the rotation speed, where the independency somehow implied that the fan worked with high efficiency. Therefore, only a few cases were illustrated here for clarity. Due to the effect of the jet flow, the horizontal distance between the fan and the temperature peak is about 4.9 m as shown in Figure 10(b), which is a little farther than that of the vortex core. And the high-temperature zone indicated by the hump in Figure 10(b) matches with the vortex extent shown in Figure 8(c). However, the temperature distribution in the y-direction as shown in Figure 10(c) is flatter and coincides with the side length of the triangular-like vortex ring.

Temperature distribution under various shaft speeds: (a) temperature distribution on canopy plane (n = 975 r/min), (b) temperature distribution along line (y = 5 m, z = 1.2 m), and (c) temperature distribution along line (x = 10 m, z = 1.2 m).
Both Figure 10(b) and (c) also show the tested data indicated by the solid circles. For clarity, only the tested results at n = 600 r/min were presented. It shows that the tested data have a good agreement with the simulated ones. Nevertheless, at the high-temperature region, there exists a discrepancy between the two sets of results. The test was also performed at the time about 1 o’clock in the morning, so there had numerous droplets dispersing in the atmosphere due to the high humidity. The wind produced by the fan blew the droplets and some of them evaporated and therefore absorbed latent heat from the ambience. And higher the velocity is (higher the temperature is) the higher the temperature differences are. So droplet evaporation and latent heat ought to be considered to improve the simulation fidelity.
Conclusion
Both flow field and temperature distribution downstream the fan were numerically simulated to investigate the fan role of frost protection. It is demonstrated that the fan can sufficiently improve the temperature distribution on the tea canopy plane:
The flow structure downstream the fan is divided into two parts: one is the jet flow that blows the warmer air aloft downward and the other one is vortex ring that enhance turbulence at the tea canopy level.
The jet flow as well as the vortex ring were schematically described that they are nearly independent on the shaft rotation speed. Maybe the flow structures are related to the design of the fan and the computation domain boundary that need further study.
The temperature variation is obviously close to the flow characteristics. The temperature peak is near the core of the flow vortex, and the high-temperature zone coincides with the vortex ring regime on the tea canopy plane.
The humidity, vapor fraction, dew-point temperature as well as phase-change process may also affect the heat transfer of the tea plant under late spring coldness, and all the factors need further study.
Footnotes
Appendix 1
Academic Editor: Oronzio Manca
Declaration of conflicting interests
The author(s) declared no potential conflicts of interest with respect to the research, authorship, and/or publication of this article.
Funding
The author(s) disclosed receipt of the following financial support for the research, authorship, and/or publication of this article: This work was financially supported by the National Natural Science Foundation of China (Grant No. 51209108) and Jiangsu Provincial Natural Science Foundation of China (Grant No. BK20151342).