
Abstract
Transit priority is considered as an effective way to relieve traffic congestion. As an efficient measure of executing transit priority, the exclusive bus lane design problem has become a research hotspot in the field of urban transportation planning. The aim of this study is to find the optimal combination of bus lane infrastructure planning (such as exclusive bus lane layout) and bus operation management (such as bus frequency). This combinatorial optimization problem is formulated in the form of a multi-objective bi-level programming model that minimizes system travel time, total pollutant emission, and bus operating cost simultaneously. A solution framework that implements a non-dominated sorting genetic algorithm is developed to efficiently solve the model. With an example network which is based on a part of Beijing’s road network, the proposed methodology is tested and its efficiency is verified by the numerical results.
Introduction
Traffic congestion has become a challenge facing transport networks in large urban areas of China when continuing to increase capacity in the form of new roads or lanes to accommodate the ever-rising travel demand is no longer feasible due to the limited land resources. With a higher capacity for moving people than private cars, public transit vehicles have been widely recognized as a more efficient way for trips in megalopolis. So, giving priority to public transit would be an effective solution to relieve traffic congestion and improve mobility. 1 While the sources to add new lanes to road network are limited in many cities, reallocation of space on the existing road network between private cars and transit vehicles, which is known as road space allocation (RSA), 2 such as providing exclusive lanes for transit vehicles would be considered as one of efficient and promising measures of executing transit priority.
Therefore, how to design the exclusive bus lanes is very important. In recent years, many researchers have made efforts to study this problem, which can be classified into two categories:
Impact evaluation. It mainly focused on evaluating the impact of exclusive bus lane on an individual link or a whole network;
Strategic planning. It concerned the optimization method or model for seeking the best set of exclusive lanes in a transit network.
A range of studies have focused on a link that falls into evaluation studies at the local level. Surprenant-Legault and El-Geneidy 3 evaluated the impact of adding an exclusive lane on the running time and on-time performance of two parallel bus routes by the statistical model. Li and Ju 4 presented a multi-mode dynamic traffic assignment (DTA) model for the impact analysis of the bus lane introduced on an arterial. Currie and Lai 5 explored the impacts of implementing an intermittent bus lane including travel time, travel time variability in a local priority project. Shalaby and Soberman 6 studied the effect of an urban reserved bus lane on bus travel time on individual segments.
At the network level, Waterson et al. 7 provided a framework to evaluate the impact of bus priority measures in an urban network. Liu et al. 8 applied a traffic micro-simulation model to the evaluation of the introduction of bus lanes in a sub-network of Leeds. Sakamoto et al. 9 identified the effectiveness of bus priority by assessing the operation performance of network with bus lane in Shizuoka City. Chiabaut et al. 10 developed an extended kinematic wave model to evaluate the feasibility, costs, and benefits of bus lanes with intermittent priority in a network.
Many optimization methods and models have been proposed in the strategic planning field. Zhang and Li 11 suggested an optimization approach for designing bus lane network based on multi-mode traffic flow assignment model. Michael and Matthew 12 presented the design features of bus lane system and analyzed the optimization process of bus-only lanes network by taking the city of San Francisco as an example. Mesbah et al. 13 put forward a framework to find the optimal combination of exclusive lanes at the network level. Mo et al. 14 proposed an optimization method to search bus lane under some specified conditions and optimize the bus lane network with the setting principles in China’s metropolises.
But most of these approaches can be applied only in a given network, that means evaluating or optimizing the exclusive bus lanes in a definite transit network in which all characteristics such as transit routes, stops, frequencies, and timetables are predetermined and not changed with the introduction of exclusive lanes. These studies did not take into account the impact of the whole network after the exclusive lane introduced on some road sections. It is well known that providing exclusive lanes will give the right-of-way to transit vehicles, thereby changing the running conditions of vehicles and the characteristics of transit network. Therefore, it is a practical approach to include the optimization design of exclusive bus lanes in the context of transit network design problem, that is, to seek the optimal combination of exclusive lanes during the optimization process, as well as determining some transit network characteristics involving transit route planning, frequency optimization, and transit stop location setting. At present, transit network in most metropolises has been well established. Redesign of transit routes or stops requires significant cost. Under this consideration, only variable bus frequency can be taken into account during the design of exclusive bus lanes, while the routes and stops are predetermined.
Therefore, the purpose of this article is to present a new mathematical framework for the optimization design of exclusive bus lanes with variable bus frequencies considered. The remainder of this article is organized as follows. Section “Mathematical model” presents the model formulation of this specific exclusive bus lane design problem, in which the related parameters and constraints are elaborated. In section “Solution algorithm,” a solution framework based on the non-dominated sorting genetic algorithm-II (NSGA-II) is proposed. A case study based on a real-world road network is carried out in section “Numerical example” to demonstrate the performance and applicability of the proposed model. Finally, in section “Conclusion,” a summary concludes this article.
Mathematical model
Outline of the model
The purpose of this study is to propose a mathematical model to support the combinatorial optimization of bus lane infrastructure planning and bus operation management. This specific problem can described as follows: given an urban road network and corresponding OD travel demands which include private vehicle users and public transport users, design the layout of bus lane on this network and determine the frequency of each bus line to achieve the maximum system benefits. This combinatorial optimization problem is a Stackelberg game, 15 which can be described as a multi-objective bi-level programming model. The upper level is an optimal decision-making problem, which determines an optimal combined set of exclusive lane and bus frequency to achieve system optimal. Thus, the detailed objective function can include a combination of network performance measures that represent the impacts of transit priority scheme. The lower level is a multi-modal transportation network equilibrium model, which is designed to formulate the users’ route choice behavior. The users in the network are classified into transit users and private car users. Based on the decision variables determined at the upper level, both the users try to choose their best-perceived routes to minimize their own travel costs. The formulation of the lower level is discussed in the subsequent sections.
Assumptions and notations
In this study, the following assumptions are made:
The travel demand between any origin and destination node pair (OD matrix) is fixed and remains the same during the analysis period.
Road network layout, link characteristics, cost functions, and control details are known.
Only two modes of traffic (buses and private cars) are contained in the network.
To formulate this question, road network and transit network are taken into account simultaneously, which are represented in Table 1.
Notation definitions.

Network performance indicators
Several parties of different interests exist in the integrated system, including an infrastructure system planner, transit enterprises, and individual travelers. Therefore, three indicators—total travel time, total pollutant emission, and bus operating cost—are considered to assess the network performance. These three indicators can be calculated as follows.
Total travel time
The introduction of exclusive bus lane can make a considerate influence on the network performance. When a link is not equipped with an exclusive lane, cars and buses will run in a mixed pattern on this link. Under this condition, the link travel time is decided by the total flow volume of the two modes. When an exclusive lane is set on a link, the bus flow and car flow are spatially separated and the link travel times of users by car and bus will be independent of each other. Depending on the placement of exclusive lane decision variable
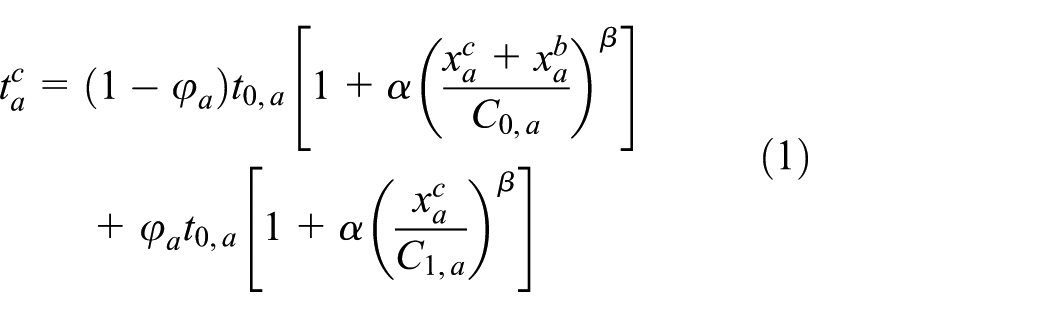

Thus, the total travel time T is the sum of travel time for all users of the network, which can be written as follows

Pollutant emission
The calculation of pollutant emission varies among different categories of pollutant. Here, only CO emission is considered. For each link, the following equations are used to compute the CO emission rate 17


Thus, the network total pollutant emissions G can be obtained

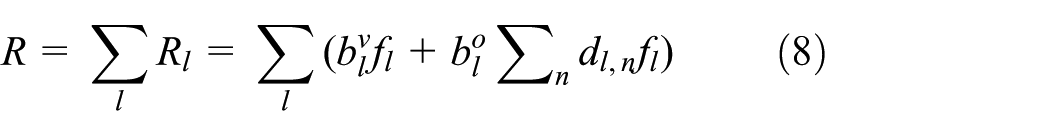
Bus operating cost
Bus operating cost is all the expenses that happen during the bus passenger transport, including fixed cost, variable cost, and marginal cost. 18 Here, for simplicity, only variable cost that varies with passenger transport volume is considered, which can be further divided as the cost relevant to maintenance and salary and the cost relevant to fuel consumption and equipment depreciation

where
Then, the bus operating cost of the whole network R can be calculated as follows
Model formulation
Upper level model
The upper level model aims at formulating a combinational optimization problem, in which bus lane infrastructure planning and bus operations are simultaneously optimized as a whole system in a multi-modal transportation network. Three kinds of performance indicators are adopted in the objective function: total travel time, pollutant emissions, and bus operating cost, which are defined as the traffic externalities and can represent the key impacts of a transit priority scheme on the network. To minimize those three externalities, a problem is formulated to find the optimal combined set of bus lane and bus frequency as the following multi-objective programming model
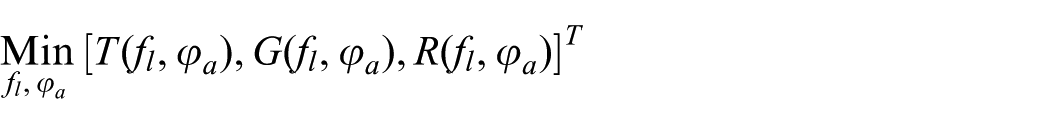
s.t. equations (1)–(8)


The first objective function is total system travel time, the second objective function is the total pollutant emission, and the third is the bus operating cost. Equation (9) specifies the range for a feasible bus frequency for each bus line. Equation (10) defines the binary decision variable. All three objective functions are implicitly defined by the lower level user equilibrium (UE) problem.
Lower level model
The lower level is a self-routing optimization problem, in which all users are free to choose their routes such that their individual total travel costs are minimized. Depending on the decision variables in the upper level, the lower level formulation determines the flow and the corresponding travel time on the links. The lower level formulation includes traffic assignment model and transit assignment model, which are designed to capture the route choice behaviors of transit and private car users, respectively.
The static user equilibrium (UE) 19 based on Wardrop’s principle 20 is proposed for modeling the flow pattern of private cars at the strategic level. The decision variables of the upper level would appear in the constraints, which implicitly express the effect of the decision variables on the flow and travel time

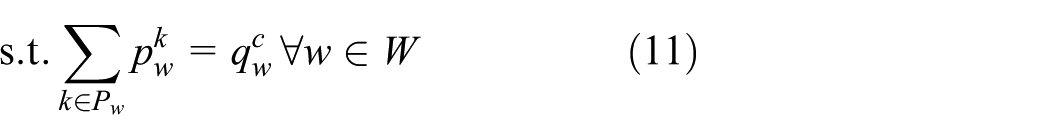


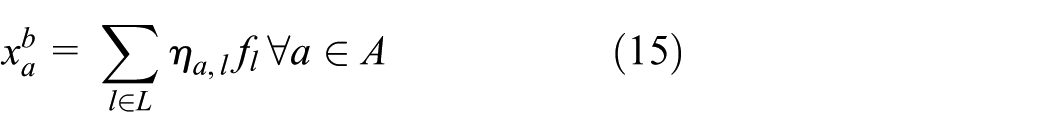

The objective function defines the user-equilibrium traffic condition, which can also be expressed using complementarity constraints or variational inequalities. 21 Equations (11) and (12) are flow conservation and non-negativity constraints. The relation of paths to links is defined in equation (13). Equations (14) and (15), in which the decision variables of the upper level appear, ensure that the appropriate cost functions are used for the calculation of link travel time for car. Equation (16) ensures the non-negativity of the flows.
The second part of lower level model aims at solving the bus demand assignment problem under certain exclusive lane layout and bus frequency which are, respectively, decided by the upper level model. The transit assignment model, based on an optimal strategy theory proposed by Spiess and Florian, 22 is formulated as follows


The objective function represents the total time of all transit users, including the in-vehicle travel time and the total waiting time. The distribution method of node volume is defined in equation (17). Equations (18) and (19) are the transit flow conservation and non-negativity constraints. The cost functions are used for the calculation of link travel time for bus, which is defined in equation (20).
Solution algorithm
In the previous section, an optimization model is proposed to formulate the specific RSA problem, in which the layout of bus lanes and the frequency of each bus line are determined simultaneously. As can be seen, this problem is a variant of traditional equilibrium network design problems. Considering the multi-objective nature of the proposed model, a Pareto optimal solution procedure should be conducted. 23 Here, therefore, the NSGA-II is applied to solve this specific problem. The procedure of the NSGA-II is shown in Figure 1. On each iteration, the UE of the whole network under certain combinatorial design scheme of bus lane and bus frequency is calculated using the CONOPT solver in GAMS, based on which the three objective functions, system travel time, total pollution emissions, and bus operation cost can be further computed.
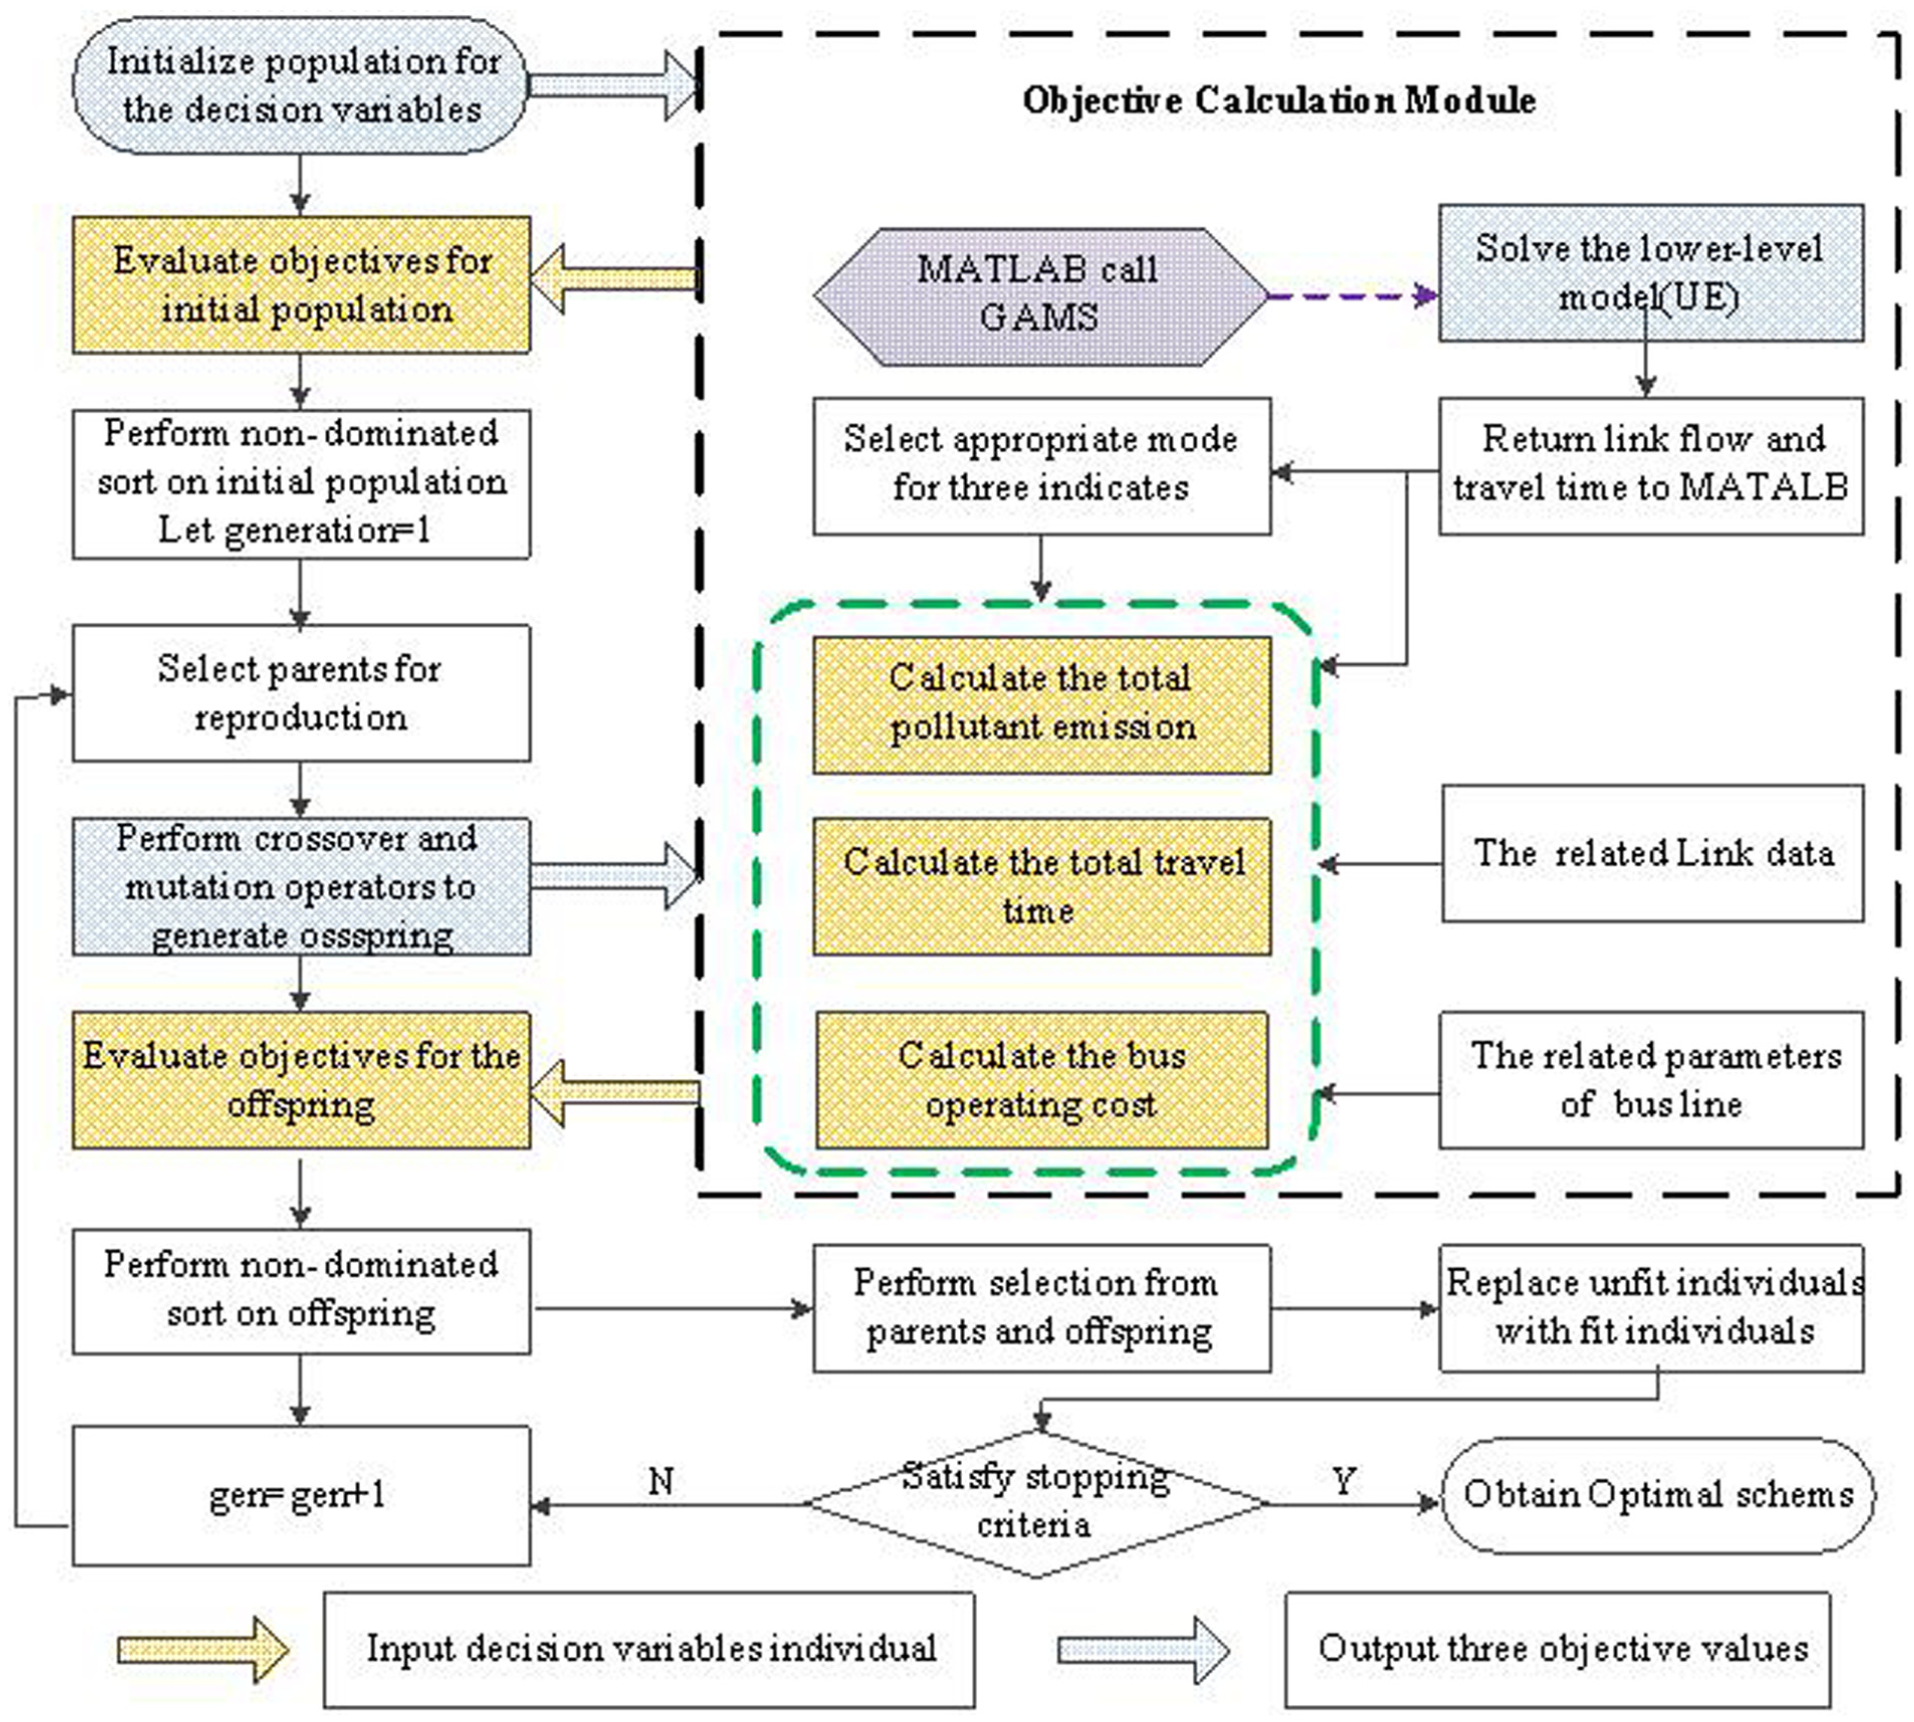
Solution framework based on NSGA-II.
This procedure is conducted in a MATLAB environment which is integrated with GAMS. In the integrated framework, the MATLAB calls CONOPT in GAMS to solve the lower level model (the UE model) and return the link travel time and link flow distribution to the input database. Based on this database, the objectives (pollution emission, total travel time, and operating cost) of the upper level model can be calculated. After that, the NSGA-II algorithm is implemented to search the optimal scheme. During that process, the two databases are constantly updated to reflect the variation of traffic distribution pattern under different bus lane configuration and bus frequency.
Numerical example
Example network configuration
In this section, the proposed approach is applied to an example network, which is obtained by simplifying the road network of Haidian District of Beijing and shown in Figure 2.

Example network.
The network is processed as follows. (1) Two kinds of origin–destination nodes are adopted, those that represent the demand of specific traffic demand zones inside the network and those that represent the demand whose origin or destination is outside the network but flow joins the network through certain node. The demand of both kinds of nodes is distributed to a certain node in the network. (2) The set of road sections on which the exclusive lanes are possible is defined according to the practical road condition, that is, the set

Processed example network.
Route of bus lines.

Sensitivity analysis
The performance of NSGA-II algorithm depends largely on the value of control parameters, which include population size, maximum iterations, probabilities of crossover and mutation, and distribution indices for crossover and mutation operators. In order to improve the quality and efficiency of solution procedure, the control parameters should be calibrated through aforehand sensitivity analysis. Here, through sensitivity analysis, the value of population size, iterations, crossover probability, and mutation probability is found to be 200, 300, 0.85, and 0.05, respectively, and the distribution indices for crossover and mutation operators are both 20.
The population size of set of Pareto non-dominated solutions varies with iterations, as shown in Figure 4. After about 230 iterations, the population size of optimal solution set becomes stable and 125 optimal solutions are included, as shown in Figure 5. As can be seen, there is no dominance relation between these solutions, which are uniformly distributed in the objective space and represent the 125 non-dominated optimal schemes.

Population size of non-dominated solution set.

Distribution of Pareto optimal solutions in the objective space.
Numerical results
Four schemes selected from the set of Pareto non-dominated solutions are denoted s1–s4, respectively, whose resulting system performances are presented in Table 3. As can be seen from the table, the value of each objective function varies among these schemes. Under s1, the pollutant emission is lowest while the total travel time is relatively high. s2 leads to a significant improvement in bus operating cost, at the price of efficiency and environment. s3 reduces the total travel time dramatically but is not environmental friendly or economical. By contrast, s4 has a more balanced performance. Compared with s1, s4 reduces bus operation cost and total travel time by 4.81% and 1.04%, respectively. Compared with s2, s4 yields a decrease of 1.46% in pollutant emission and a decrease of 7.02% in total travel time. Compared with s3, s4 makes a slight sacrifice in environment and efficiency for an obvious reduction in bus operation cost by 7.01%. To summarize, s4 has relatively good performances in each aspect. Therefore, it is considered as the optimal scheme and used for later study.
Solutions for the selected schemes.

As elaborated above, the advantage of the proposed model, which is labeled Case B in this article, is that it considers the layout of exclusive lane and bus frequencies simultaneously. In order to demonstrate this with this numerical example, three different cases are considered here:
Base case. No exclusive bus lane is introduced and the frequency of each bus lane is permanent.
Case A. Design of exclusive bus lanes is considered with the frequency of each bus lane permanent, as modeled in Mesbah et al. 13
Case B. Optimization design of both exclusive bus lanes and bus frequencies is considered.
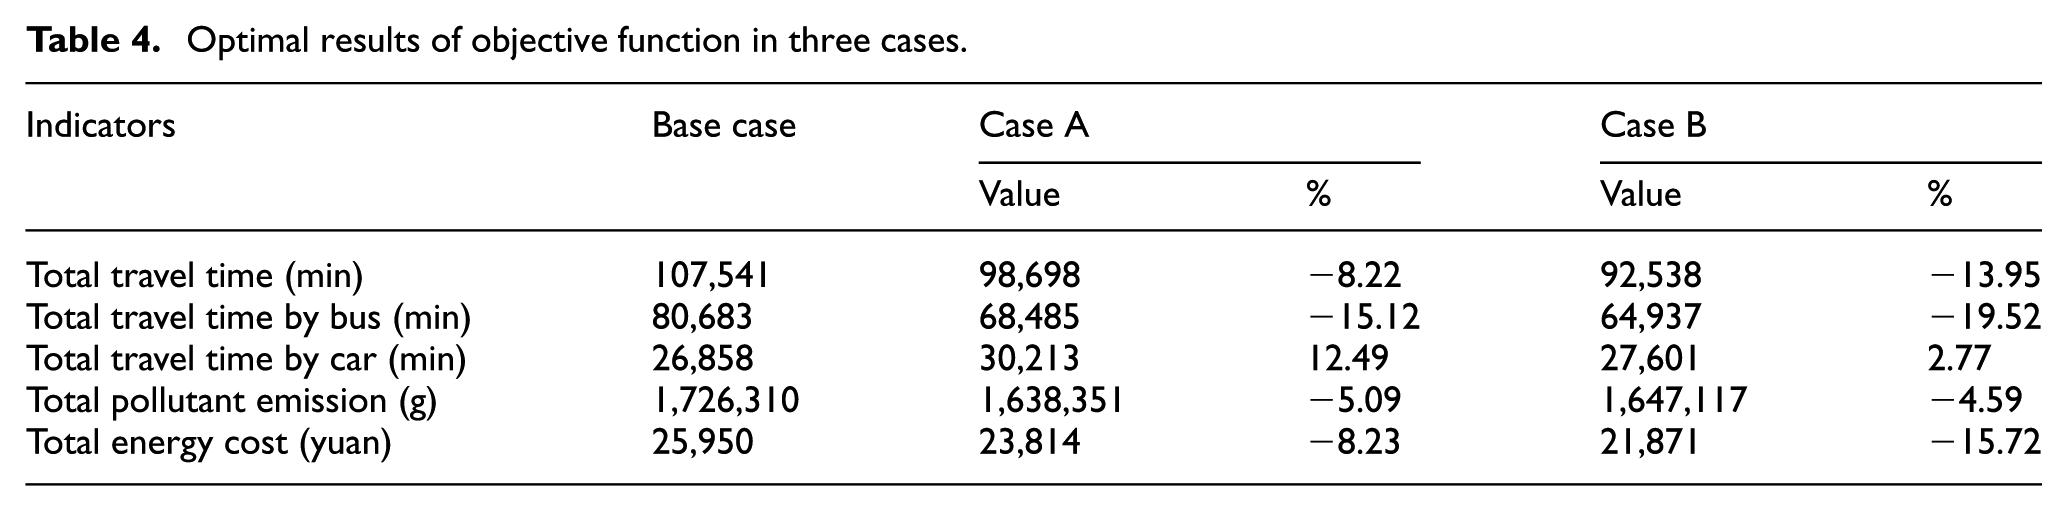
As shown in Figure 6, the optimal layouts of bus lanes by case A and case B are compared. The performances of three different cases are plotted in Table 4. Compared with base case, the total travel time, pollutant emission, and operating cost decline remarkably in case A and case B which demonstrates the benefit of introducing exclusive bus lane. At the same time, the better objective value in case B can reflect that considering bus frequency design is necessary when designing the layout of exclusive bus lanes and the model proposed in this article is reasonable and useful.
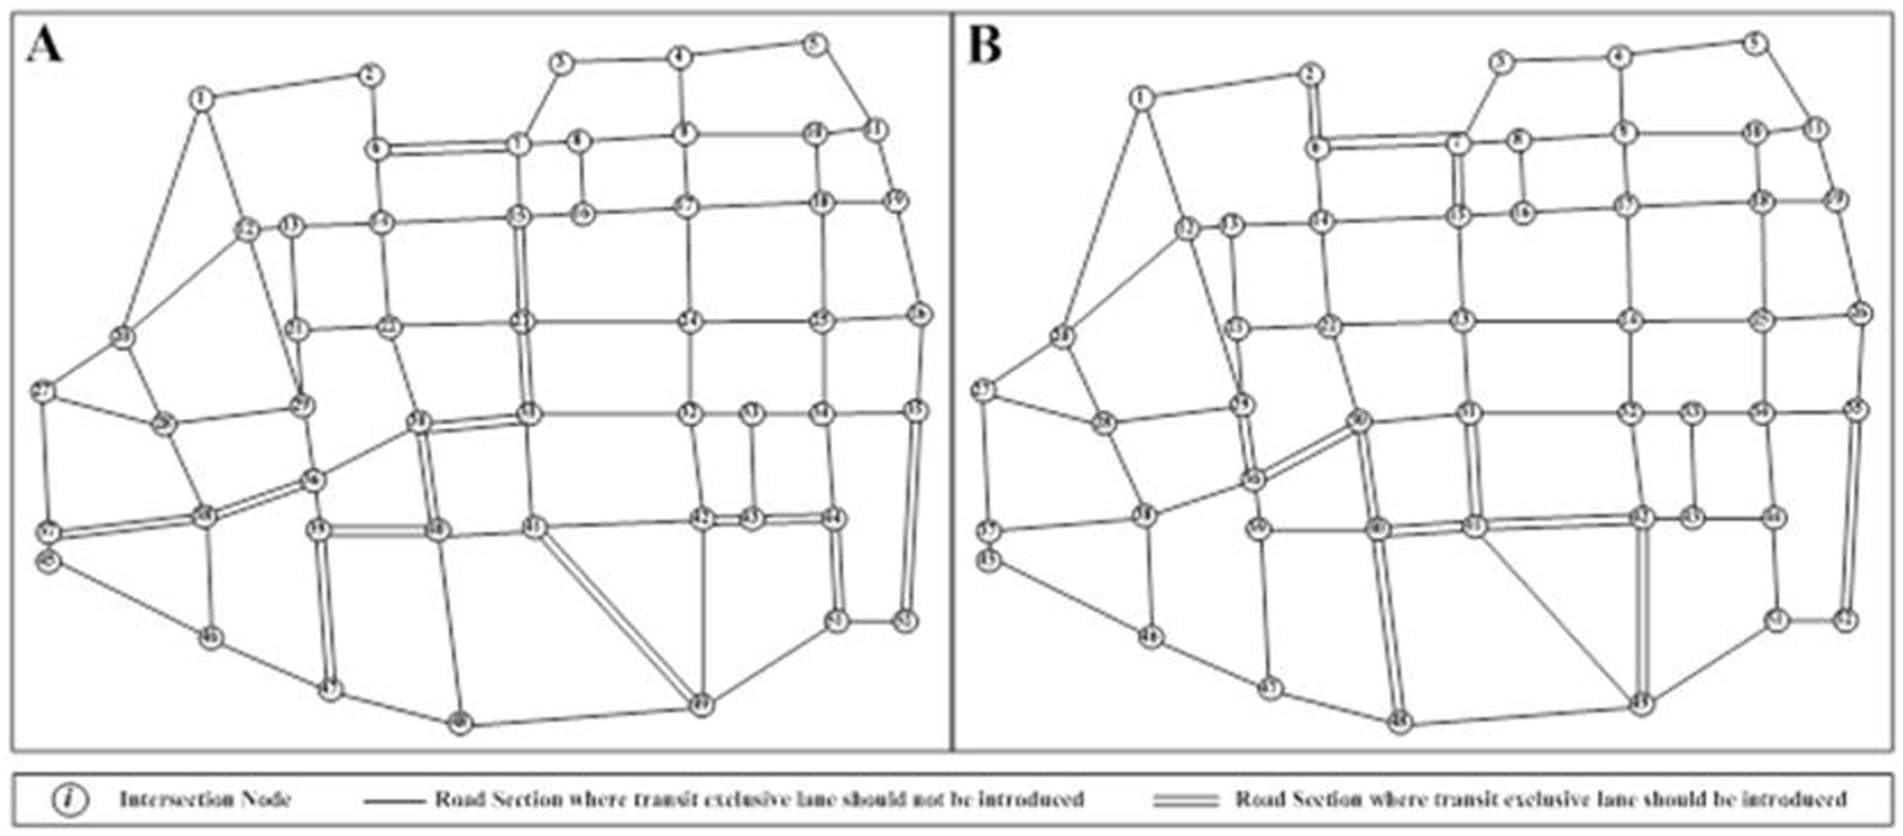
Optimal bus lane layouts by case A and case B.
Optimal results of objective function in three cases.
In addition, in order to make more clear the benefit of considering variable bus frequencies during exclusive bus lane design, the split shares of buses and the total system costs with three cases at different demand levels are compared, which is shown in Figure 7. It reveals that combinatorial optimization of exclusive bus lanes and bus frequencies, that is, case B, results in a lower total system cost than base case and case A. The improvement effects are more obvious at a higher traffic demand. As can be seen, though both case A and case B can achieve an improvement in the split shares of buses and total travel time, the improvement effect of case B is larger than that of case A. And the advantage of case B becomes more obvious when it comes to a higher demand situation.
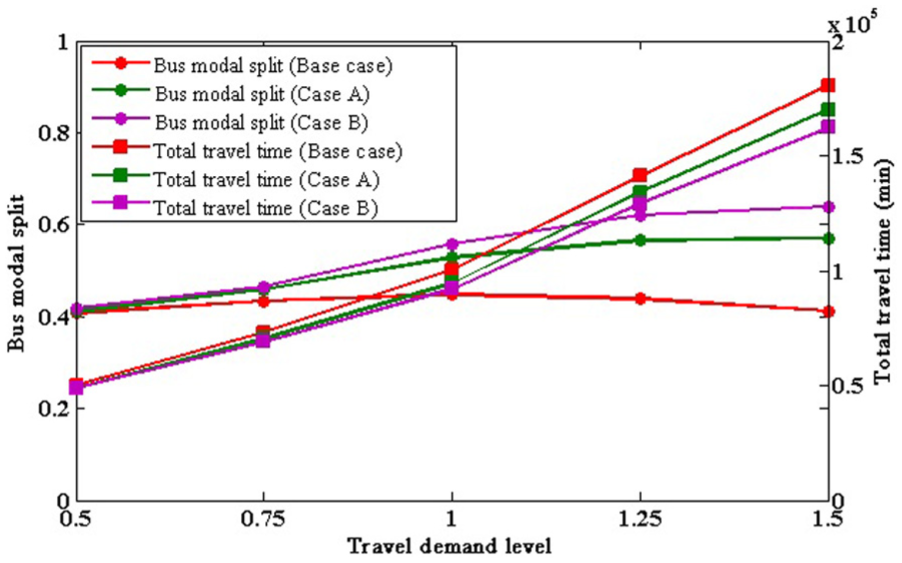
Split share of bus and travel time for three cases with different demand levels.
In addition, in order to make more clear the benefit of considering variable bus frequencies during exclusive bus lane design, the objective values under different bus lane numbers in case A and case B are compared, as shown in Figure 8. With the same number of bus lanes introduced, a better objective value can obtained in case B, which demonstrates that incorporating bus frequency design in the design of bus lane is, to some extent, necessary. At the same time, the optimal number of bus lanes in case B is 12, whereas the number in case A is 14, indicating that the design of bus frequency makes a significant supplement to the design of exclusive lane and can achieve a better objective value with less exclusive bus lanes introduced. Besides, the gap between objective values of case A and case B declines gradually with the increase in bus lane number after the number exceeds 14, which shows that the influence of bus frequencies is limited when too many exclusive bus lanes are introduced.

Variation of objective function with bus lane number in case A and case B.
Conclusion
Inspired by the traffic flow reallocation effects of bus exclusive lane, this study proposed a new mathematical framework for optimizing bus lane with variable bus frequencies considered to achieve better efficiency, economy, and environmental sustainability on a traffic network. The combinatorial optimization problem is modeled in the form of a multi-objective bi-level optimization program. The upper level is an optimal decision-making model for setting exclusive lane and bus frequency with a minimization objective in terms of system travel time, total pollution emissions, and operating cost, and the lower level is a multi-modal transportation network equilibrium model. A solution framework was proposed to solve the model, which integrates a genetic algorithm procedure in MATLAB and a commercial solver in GAMS. Based on a real-world case study, significant benefit may be gained from the integration of bus lane with bus frequency. The approach presented can be used as a tool to help transport managers make transit priority policies while considering a network perspective.
Future research will consider incorporating uncertainties, such as uncertain future demand and user behavior, into a stochastic model, in which case the proposed model may serve as a scenario-dependent sub-model. Another research direction from numerical perspective is to consider converting the proposed models to a single model by imbedding the KKT conditions of the sub-models, in which case a solution algorithm taking advantages of recent progress in mixed-integer programming and mathematical program with complementarity constraints shall be developed.
Footnotes
Academic Editor: Hai Xiang Lin
Declaration of conflicting interests
The author(s) declared no potential conflicts of interest with respect to the research, authorship, and/or publication of this article.
Funding
The author(s) disclosed receipt of the following financial support for the research, authorship, and/or publication of this article: This work was supported by the National Natural Science Foundation of China (nos 51408190 and 71501061), the Natural Science Foundation of Jiangsu Province (no. BK20150821), and the Fundamental Research Funds for the Central Universities of China (grant no. 2015B11714).