
Abstract
Few researches have focused on the comprehensive efficiency of tunnel lighting, which plays a role in improving the tunnel lighting efficiency. This article defined visual recognition time as the representation of visual performance. Three indices, visual performance, light efficiency, and production cost, were proposed to study the visual performance of test drivers, when drivers recognized an obstacle in LED lighting environment with different characteristics. A total of 15 light combinations were designed in the middle section of tunnel, composed by 5 color temperatures and 4 color rendering indices under 8 different kinds of light brightness. A total of 12 test drivers were selected to conduct the static recognition experiment in different lighting environments. Recognition time, lighting performance, and production cost were normalized, and K-means clustering was applied to analyze these indices to obtain the values of comprehensive efficiency of LED with different characteristics. The results indicated that increasing the light color rendering can improve the visibility without increasing the light power. The following combinations of color temperature with color rendering, 6500 K with 70, 5700 K with 70, 5700 K with 80, 3000 K with 80, 3000 K with 70, and 4000 K with 70, performed better comprehensive efficiency, showing better visual performance, higher light efficiency, and lower production cost.
Introduction
With the increasing construction of expressway tunnel, more traffic accidents resulted from unreasonable tunnel lighting settlements. Much higher the operation and maintenance of the tunnel lighting cost, more remarkable the contradiction between lighting saving and traffic safety is. The effect of tunnel lighting must depend on a reliable lighting source, which can provide a comfortable and safe driving environment, reduce energy consumption, and promote lighting efficiency. High-pressure sodium lamp and LED lamp are two ordinary types of expressway tunnel lighting resources. Many researchers and organizations dedicated to study the new energy-saving technologies and productions in order to reduce energy consumption and production costs. Ylinen et al. 1 studied the advantages of LED for road lighting. KR Shailesh et al. 2 compared the advantages and disadvantages between high-pressure sodium lamp and LED lamp for road lighting. Kimura et al. 3 proposed that the visibility in tunnel can be improved by increasing the evenness degree of brightness of LED under the same value of brightness, which can also save about 20% energy. Moretti et al. 4 evaluated the schemes of lighting system using lifecycle cost and suggested that improving pavement material reflection effect can reduce power consumption. Morrison studied lighting calculation model to compare various lighting products and found the most energy-efficient design for every lighting product. Many researches in China showed that LED lamp irradiated much wider than high-pressure sodium lamp, which made the brightness of pavement more uniform. 5 LED light has high luminous efficiency, high color rendering, and long lifecycle (50,000–100,000 h), and more light colors of LED light sources can be chosen and LED can simulate the natural light color.6–9
Researches of new energy-saving light sources of tunnel lighting, in order to reduce energy consumption and cost, have mainly been based on comparing aspects of the lighting effect, operation cost, and environmental protection between LED light source and high-pressure sodium light source. Research results indicated that LED light source is better than high-pressure sodium light source in all aspects. With the development of technologies for LED light, LED light source is adopted much more frequently in expressway tunnel lighting system. However, there are lacks of evaluations on safety, economy, and comprehensive energy efficiency of LED light resource with different characteristics, which would be hard to choose more suitable LED light resource of expressway tunnel for designers and managers. For the analysis mentioned above, this article studied on visual cognition effect of test drivers under different light environment and evaluated the LED light resources with different characteristics combining light efficiency and production cost.
Static visual cognition analysis based on visual performance
Vision is one of the most important channels for drivers to receive information, and drivers complete vision assignments with visual organs. The effectiveness of this cognition process is defined as visual performance, which can be used to quantitatively evaluate the speed and precision of visual cognition ability. 10 Good visual performance can guarantee the drivers to identify obstacles ahead and dangerous positions in time or even earlier. Visual performance is commonly used to evaluate the lighting quality of the artificial light resources. In order to obtain satisfactory visual performance, good visibility is a necessary index to evaluate the recognition of target, such as recognition ease, speed, and accuracy. Not only the personal factors, color temperature, color rendering index, and brightness play crucial role in obtaining good visibility for artificial lighting but also these indices affect the drivers’ abilities of recognizing the targets within effective visual recognition distances directly. Therefore, this article designed drivers’ visual cognition experiments under different light characteristics and analyzed the results of recognition ability and time to study the color temperature, color rendering index, and brightness of tunnel light resources in order to determine the safe and comfortable visual performance.
Driver’s visual cognition experiment
In order to conduct an effective experiment, the lighting environment of the middle section of expressway tunnel was simulated, which has stable light and relatively low brightness and is not affected by natural light. The stopping distance of 110 m is assumed as a safe visual recognition distance when the design speed of the tunnel is 80 km/h. Test drivers were asked to recognize the target in a safe visual cognition distance, and recognition time was defined as the visual performance value under lighting environment with different characteristics. The results of the visual cognition experiment were analyzed to study and evaluate the visual performance.
Experimental environment design
An enclosed environment was established, and the length was 60 m, the width was 3.8 m, and the height was 3.8 m. In order to control the light of the experiment and eliminate the influence of reflective materials on experiment environment, black cloth was used to decorate the top and all sides of the test environment. Modified asphalt waterproofing membrane, a diffuse reflective material which was close to asphalt concrete pavement, was applied to decorate the ground of the test environment. The experimental environment is shown in Figure 1.

Static visual recognition experiment site.
Experimental target object and the height of eye
When the contrast between the color of the target object and the color of the asphalt concrete pavement is similar as much as possible, the most unfavorable recognition condition can be conducted. Considering the recommendation of the target object in Guidelines for Tunnel Lighting, 11 a 20 cm × 20 cm × 20 cm cube with gray target object was selected as shown in Figure 2, and the reflectivity of the surface is 20%. The height of the test drives’ cognition is the height of eye, which is referred to the height between the test drivers’ eye and the ground. The visual field of the car drivers is narrower than that of the truck drivers and faster speed result in a shorter recognition distance, which is more difficult for driver to recognize the obstacle object. Therefore, the height of eye in experiment was 1.2 m determined by the visual cognition height of typical passenger car.

Target recognition object.
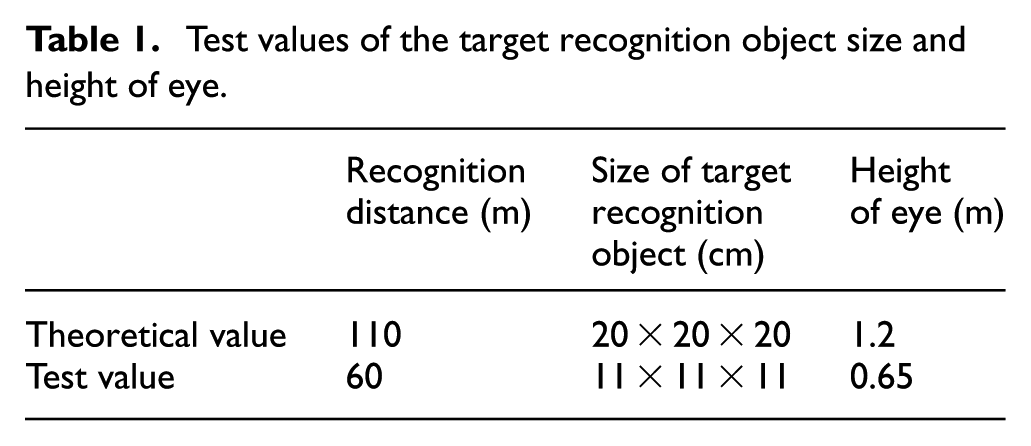
In the actual experimental condition, the effective distance of visual recognition was only 60 m. According to the principles of retina imaging, the size of target object and the height of test driver’s eye reduced in equal proportion. The ratio of recognition distance to the effective recognition distance was 6:11. When the stopping recognition distance was 110 m, the reduced object size and the height of eye in actual experiment were acquired as shown in Table 1.
Test values of the target recognition object size and height of eye.
Experimental light source and light environment condition
The five levels of color temperature were 3000, 4000, 5000, 5700, and 6500 K; four levels of color rendering were 60, 70, 80, and 90. Orthogonal experiment was designed composed by five levels of color temperature and four levels of color rendering. A total of 15 experimental groups were obtained as shown in Table 2, based on safe and comfort driving environment, production cost, and manufacturing feasibility.
Orthogonal experiment groups based on color temperature and color rendering index.

The brightness value of middle section of tunnel ranged from 1.5 to 3.5 cd/m2, according to the Guidelines for Design of Lighting of Highway Tunnel. 11 Considering the comprehensiveness and effectiveness of visual recognition test, eight levels of brightness were designed, 1.5, 2.0, 2.5, 3.0, 3.5, 4.0, 4.5, and 5 cd/m2. On top of the middle section of the simulated tunnel, 60-W led light sources were equally spaced.
Experimental instruments
During the process of experiment, a dynamic eye movement device (iView X 1.05 build 49 HED) with 200 Hz sampling frequency was used to record experiment datum, real-time experiment environment, gazing point, and pupil of test drivers. A spectral radiation intensity of illumination detector (CL-500) and a light intensity detector were used to measure real-time color rendering index and color temperature. The illuminance ranges from 0.1 L× to 100,000 L×, and the value of chromatic is above 5 L×. The accuracy of CL-500 was in the range −2% to 2% compared to the displayed luminance value. A brightness meter (LS-100) was used to measure the real-time brightness of the pavement surface. Interval of rapid sampling time was 0.1 s, and the measure of brightness ranged from 0.001 to 299,900 cd/m2. The accuracy of LS-100 was in the range −2% to 2% compared to the displayed brightness value.
Test drivers’ selection
A total of 12 drivers were selected randomly, who should be healthy and not have cardiovascular disease, heart disease, other serious disease, color blindness, color weakness, and other eye diseases. All test drivers should have a good rest and normal reaction, and they should not drink alcohol or take drugs during the experimental period.
Experimental process
For each test, one kind of light sources was placed in the experimental environment, and then the brightness of the light source was changed. The sites of test drivers and target object were determined and the height of the eye was 0.65 m. Under this condition, the color temperature and color rendering was measured by the illumination detector, and the brightness was measured by the brightness meter where the target object was placed as shown in Figure 3.

Visual recognition of light environment.
Test drivers were asked to wear the dynamic eye movement device, and test personnel calibrated the device using three-point calibration method. In the first place, a black cloth was placed in front of the test drivers, and then, personnel placed target object randomly at the distance of 60 m to test drivers. After the target object was placed, the black cloth was removed and test drivers started to recognize the target object. The visual recognition time was written down, and also the test driver was investigated by three questions as follows: (1) Is there any object? (2) What is the shape of the object? and (3) What is the color of the object?
For each kind of light sources and the corresponding eight levels of brightness, the same test procedure was repeated until the tests for all 12 drivers were finished. Then, for the other 15 groups of light sources, the test process mentioned above was conducted.
Data processing and analyzing
The distribution of visual recognition time of test drivers was analyzed by box plot under every combination of color temperature, color rendering index, and brightness. It was found that visual recognition time of each driver was not different with others. The mean value of visual recognition time was selected as the representative recognition time for each combination. Through calculating and analyzing the visibility test results of 12 test drivers under the light environment of 15 different types of light sources and 8 different brightness levels, the drivers’ reaction time of capturing the target object was obtained. The effective sample size was 1308, and the mean value of visual recognition time of the same light source was calculated. As a result, 117 groups of datum were obtained as shown in Table 3.
Average visual recognition time of different types of light sources.

Analysis of the visual performance of object recognition experiment
Through processing and analyzing the drivers’ visual recognition time under different characteristics of light sources and different brightness levels, the relationship between rendering index of different color temperature and visual recognition time were obtained as shown in Figure 4. With the increase in brightness and color rendering index, the visual recognition time of test drivers was shortened and the visual performance was improved. Therefore, in the actual engineering, improving the color rendering of light source is regarded as an effective energy-saving method, which can improve the driver’s visibility but not increase the power of the light source.

Relationship between rendering index of different color temperature and visual recognition time under different brightness.
Analysis and evaluation of comprehensive efficiency of light source
In order to satisfy the drivers’ visual needs and reduce the lighting consumption and production costs, visual performance, light efficiency, and production cost of light sources with different characteristics were normalized to analyze and evaluate the light sources.
Normalization of the indices
The experimental data of 12 test drivers’ visual recognition time in Table 3 range from 5.75 to 21.3 frames, and the monotonicity of the datum is contrary to the prior definition. Therefore, the visual recognition time was converted by taking the reciprocal value, and then, the reciprocal value was normalized, which was mapped to [0, 1] as shown in Figure 5.

Normalization of the visual recognition time under the different brightness of the different color temperature and color rendering index of light source.
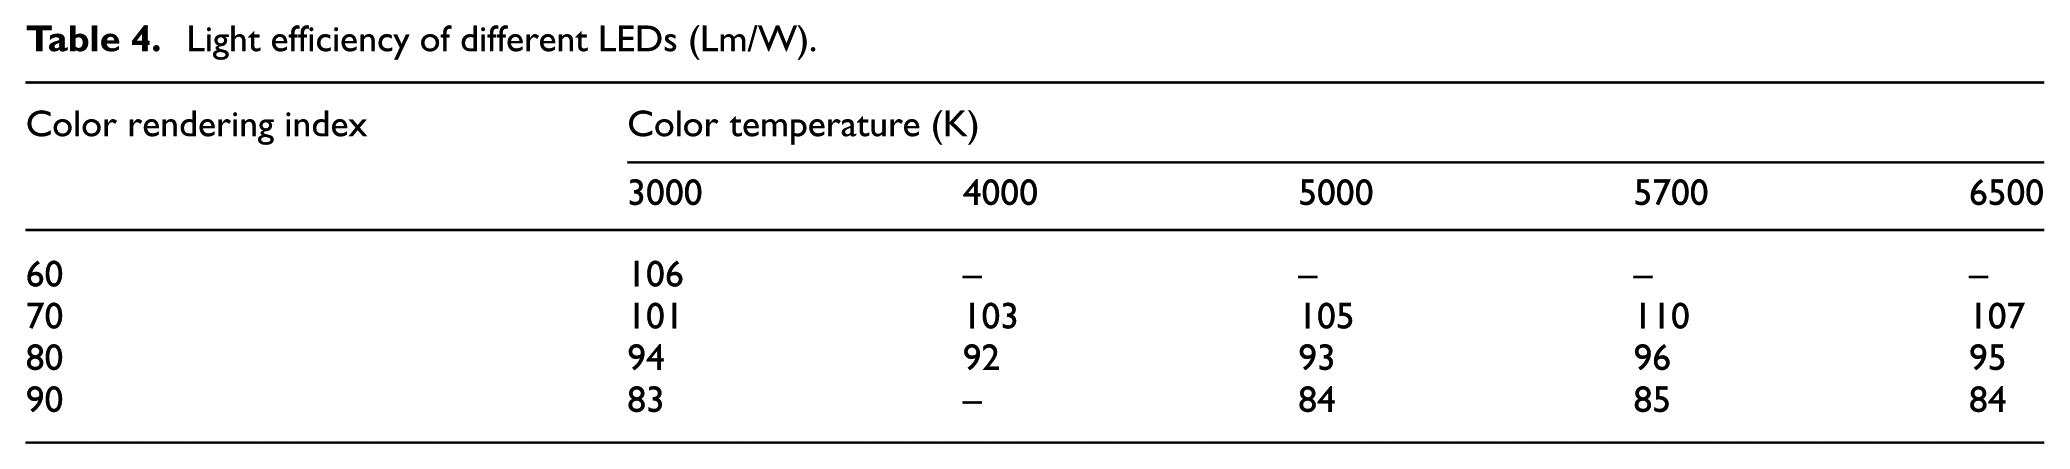
The visual performance results are shown in Table 4, ranging from 83 to 110 Lm/W. With the same attribute, every value was divided by the maximum value to transform the experiment data to [0, 1] as shown in Figure 6.
Light efficiency of different LEDs (Lm/W).

Normalization of the light efficiency with different color temperature and color rendering index.
The production costs of different 60-W LED lights are shown in Table 5, ranging from 1598.7 to 2828 RMB per lamp, and the cost is contrary to the prior definition. Therefore, the production cost was converted by taking the reciprocal value, and then, the reciprocal value was normalized, which was transformed to [0, 1] as shown in Figure 7.
Production cost of the different 60-W LED light source.


Normalization of the production cost of light sources with different color temperature and color rendering index.
Calculation of the comprehensive efficiency of light sources
Dynamic clustering algorithm defines clustering according to a certain distance or similar metrics between samples. The samples similar or close are clustered into one class, and the center of the clustering represents the characteristics of this class. The clustering technique is simple and the hierarchical clustering algorithms converge to the cluster trees rapidly. This method is appropriate to evaluate the comprehensive efficiency of light sources. 12
Each of the selected brightness in the experiment corresponds to a data set, which needs to be clustered with the data set. In order to mine the potential rules from the large data resulted from the visual performance, luminous efficiency, production cost, and the abundant experimental samples are mapped to several sets analyzed integrally, reflecting the substantive characteristics of the data objectively. Therefore, this study utilized the K-means clustering algorithm to evaluate the comprehensive efficiency of different types of LED light sources. The basic thought was that the samples were divided into K classes by iteration and the total deviation was minimized using the mean value of those K classes representing the corresponding samples.
This method took all the samples, three-dimensional samples composed of the normalized values of visual recognition time, luminous efficiency, and production cost, to obtain the three-dimensional vectors. According to the calculation results, each sample level of brightness was assigned to the corresponding number i (i = 1, 2, 3, 4, 5). Then, the number of occurrences of each type of light source in each i-class was summed. The results of the summation are ranked according to each type of centroid, multiplied by the corresponding weight, respectively. Finally, the i-value of each types of light source was summed to obtain the measurable quality index of each types of light source under the same level of the brightness.
In total, five kinds of data under the same brightness were ranked from high to low according to each type of the centroid data, given by the corresponding distance weight: 1, 0.5, 0, −0.5, and −1. Then, the weighted values were taken as the index, calculating the eigenvalue of the different types of LED light source’s comprehensive efficiency. The calculated results are shown in Table 6.
Eigenvalues calculating the eigenvalue of the different types of LED light source’s comprehensive efficiency.

The eigenvalues of the comprehensive efficiency are ranked from superiority to inferiority, as shown in Figure 8. Using MATLAB to process and analyze the eigenvalues of comprehensive efficiency evaluation value, the four-dimensional relationship of the color temperature, color rendering index, the light brightness, and comprehensive efficiency index was obtained, as displayed in Figure 9. The quality of the light source from low to high is characterized by color transition from blue to yellow. It is observed that the comprehensive efficiency of light source with color temperature and color rendering index of 6500 K and 70, 5700 K and 70, 5700 K and 80, 3000 K and 80, 3000 K and 70, and 4000 K and 70 has the advantages of good visual performance, high luminous efficiency, and low production cost, as shown in Figures 8 and 9. The light sources with these characteristics are ideal in the tunnel lighting environment.
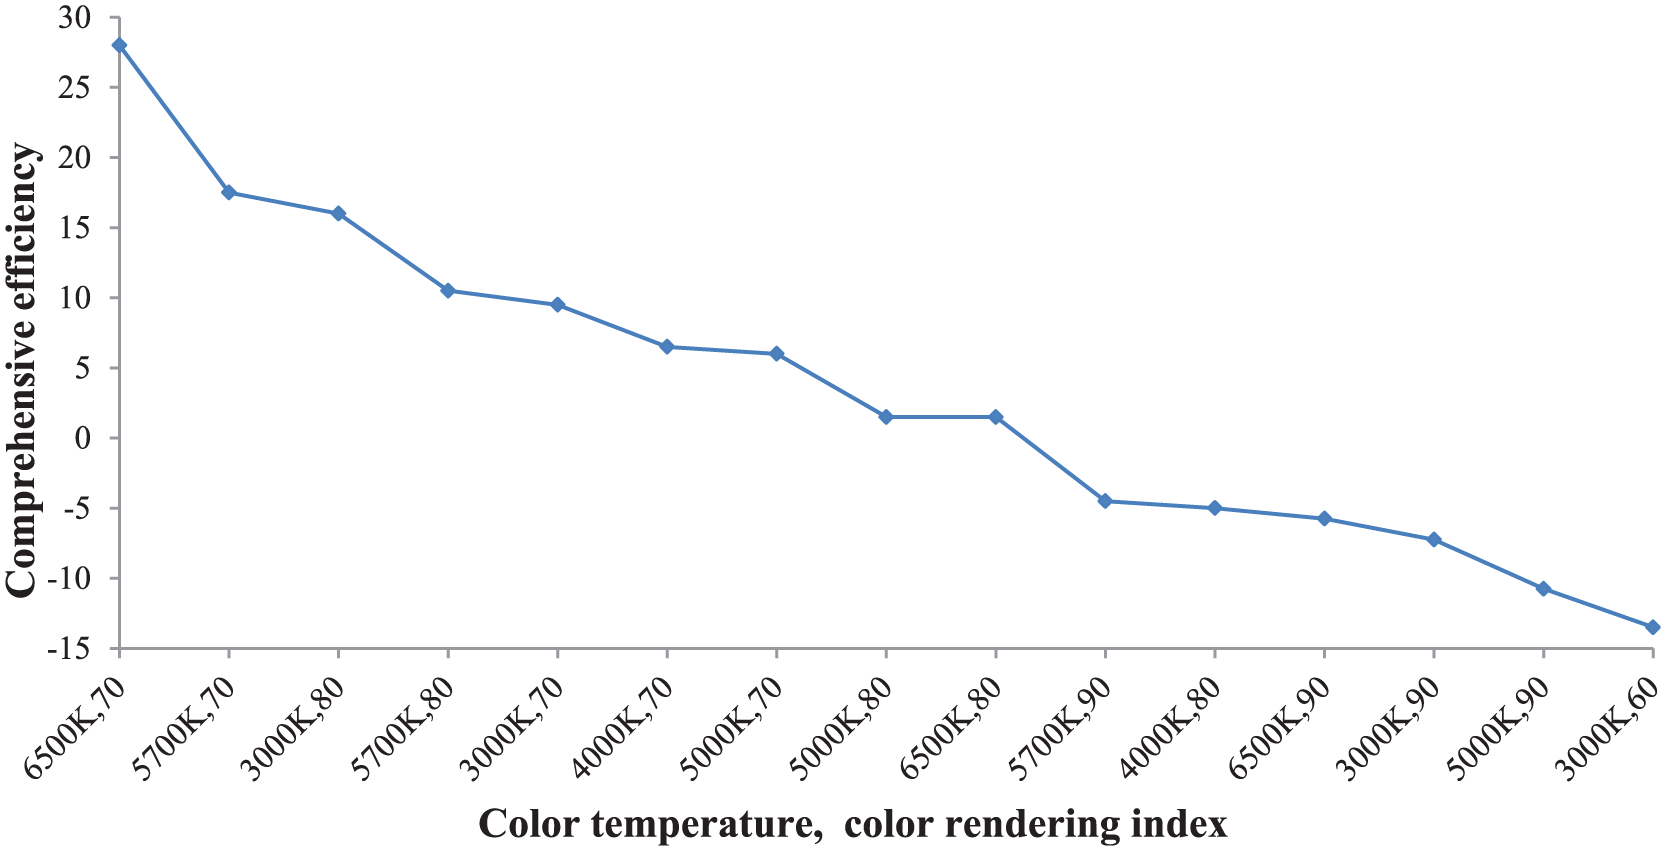
Eigenvalues of comprehensive efficiency’s order from superiority to inferiority.

Index of comprehensive efficiency of light source of different color temperature and color rendering index.
Conclusion
The construction, operation, and maintenance costs of highway tunnel lighting system have been a heavy burden on the highway management department. Lighting efficiency depends on the selection of light source. Therefore, the research on the light source which is energy-saving and improving the driver’s recognition visibility is important for improving the lighting environment of expressway tunnel. This article designed experimental scheme and analyzed the experimental results of visual performance under different lighting environment. Combining the visual performance, lighting efficiency, and production costs, the comprehensive efficiency of different types of light sources was analyzed.
With the increase in brightness and color rendering index of light source, the visual performance was improved, which indicates that improving the color rendering index of light source can be regarded as an effective method to save energy, improve recognition visibility without increasing light power.
According to the order of 15 types of comprehensive efficiency of light sources, the combinations of color temperature and color rendering index, 6500 K and 70, 5700 K and 70, 5700 K and 80, 3000 K and 80, 3000 K and 70, and 4000 K and 70, have advantages of good visual performance, high luminous efficiency, and low production cost, which are the ideal light source for the expressway tunnel lighting environment.
Footnotes
Academic Editor: Hai Xiang Lin
Declaration of conflicting interests
The author(s) declared no potential conflicts of interest with respect to the research, authorship, and/or publication of this article.
Funding
The author(s) disclosed receipt of the following financial support for the research, authorship, and/or publication of this article: This work was supported by the National Natural Science Foundation of China (project no. 61531005).