
Abstract
An accurate simulation model of the lubrication system is essential for early design of the heavy truck transmission. In this article, a detailed computational method for the flow network analysis of the lubrication circuit is developed based on the hydraulic theory, and the flow resistance through the oil pipes and orifices is also taken into consideration. Then, the Next Limit Technologies’ XFlow, a potential new three-dimensional computational fluid dynamics software based on lattice Boltzmann method, is adopted to obtain the relationship between the oil delivery and the lubrication effect in the low-pressure capillary lubrication network of the rear auxiliary gearbox. To achieve the best overall lubricating performance of the flow network, the optimized design of the diameter for each oil supply orifice is determined by a detailed sensitivity analysis on the contribution of each parameter to the volumetric flow rate. The bench tests for the volumetric flow rate have been performed for validating the computation model by comparing the predicted volumetric flow rate through each oil supply bore with the experimental data at various pump speeds. The endurance tests have further conducted and the test results indicate a remarkable reduction in mechanical weariness when the best solution of the flow network design for the transmission lubrication system is adopted.
Keywords
Introduction
The quality of transmission lubrication depends upon how much oil is supplied and how the lubricant is delivered under pressure to the lubricated components, since the lubricant oil can protect the rotary components, such as gears and bears, against friction and wear. 1 In addition, compared with transmissions equipped in the passenger vehicles, the transmissions for the heavy duty truck always work under the heavy load with low speed, and the performance of lubrication network is closely related to the safe operation and lifetime of the powertrain system. 2 However, it seems to be both difficult and expensive to solve the lubrication problems when the transmission development program reaches the testing stage; therefore, an analytical method based on simulation way might offer a considerable solution for this problem. 3
The ability to analyze lubrication characteristics by simulation method is important during the process of commercial vehicle powertrain development, as it can help the manufacturer to avoid serious design defects without using expensive and time-consuming laboratory tests. There are some studies focused on modeling the flow characteristics of the network in engine lubrication system. Chun 4 gave the mathematical models to simulate the flow characteristics of the engine lubrication system and then analyze the flow and pressure distribution of each lubricated components in the flow network. Gu et al. 5 built the automotive engine lubrication system in the platform of AMESim to simulate the steady lubricant flow rate and pressure at different engine speed. Klingebiel and Kahlstorf 6 modeled the internal combustion engine lubrication systems using the one-dimensional (1D) fluid Flowmaster software to analyze how much models may differ in order to achieve a reliable result for the different aspects of the system. Obviously, the researchers mentioned above simplified the network design process by ignoring the lubricating effect of the rotary components in the powertrain system since the 1D fluid modeling method is not suitable for flow field analysis of the capillary structure, which is widely used for lubricating the rolling bears or shaft journals in the transmission system. To this end, some other schemes are necessary to be incorporated into the fluid network design, such as the three-dimensional (3D) computational fluid dynamics (CFD) analysis based on the Next Limit Technologies’ XFlow.
XFlow is a commercial CFD software based on the lattice Boltzmann formulation, which uses the distribution functions to describe the collective behavior of many microscopic particles7,8,9 and has been benchmarked for a number of standard fluid dynamics problems. XFlow has been proved to be particularly suitable for simulating complex systems involving highly transient flows and even the presence of moving parts,10,11 and it has been widely applied for evaluating the efficiency of single fluid component nowadays. A Michael et al. 12 selected the best parameter design in a set of aeroacoustic optimization strategies for axial fans based on the simulation results of XFlow. A Michael et al. 12 adopted the XFlow software to calculate the wind loads on a parabolic trough solar collector and evaluated the computation accuracy by comparing the simulation results with the traditional finite element methods. All the researchers mentioned above only applied XFlow for flow field analysis of single component. In contrast to these applications, the XFlow rarely appeared in the development of fluid system, such as the network analysis of the capillary structure in the lubrication system for the commercial vehicle transmission.
In this article, a detailed computational method for the flow network analysis of the lubrication circuit in the commercial vehicle gearbox is developed based on the 1D hydraulic theory, and this simulation model is capable of characterizing the distribution of flow and pressure in the transmission lubrication network. To evaluate the lubrication performance of the rotary components in the rear auxiliary gearbox, a potential CFD software, XFlow, is applied for 3D flow field analysis of the capillary lubrication network. To achieve a proper lubricant distribution for the flow network, the optimized design of the diameter for each oil supply orifice is determined by a detailed sensitivity analysis on the contribution of each parameter to the volumetric flow rate. The bench tests for the volumetric flow rate have been performed for validating the calculation accuracy of the mathematic hydraulic system model. The endurance tests indicate a remarkable reduction in mechanical weariness when the best solution of the flow network design for the transmission lubrication system is adopted.
Transmission lubrication system
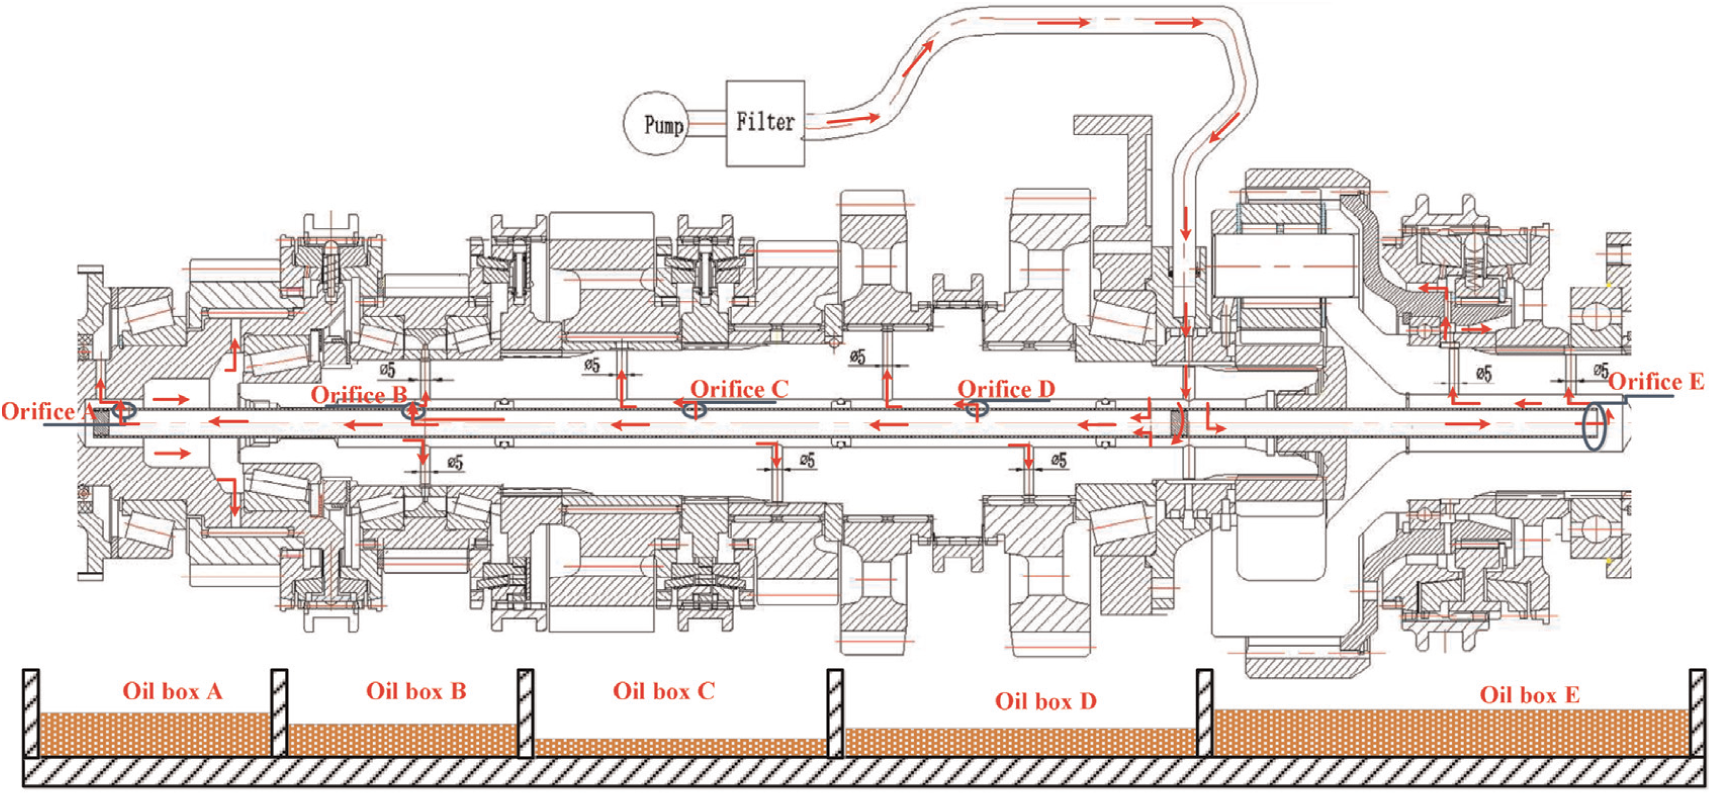
A typical transmission lubrication system shown in Figure 1 is composed of oil pan, oil pump, oil filter, oil pipes with straight and bend types, and capillary lubrication structure. The lubricant is first sucked from the oil pan into the gerotor-type oil pump, which pressures the lubricating oil by two rotating, intermeshing gears. Then, the oil passes through the filter, overcomes the flow resistance of the orifices located at the joint between the pipes, and then fed to both the main and auxiliary gearboxes simultaneously by the inlet holes shown in Figure 1. The lubricant distributed to the rear auxiliary gearbox flows through the orifice E into the internal tube of the output shaft in the gearbox and is swung into the capillary pipes by centrifugal force due to the rotation of the output shaft. The rest of the oil flows into both the main and front auxiliary gearboxes, passes through the oil supply orifices A, B, C, and D to lubricate the bears of each gear, and at last drains vertically down to the oil pan. The relationship between the discharge flow rate and pressure difference of the oil pump with the filter can be shown in Figure 2. The oil temperature of the pump test for the flow characteristics is set to be 80°C. The slight discretion of the flow rate for 3500 r/min is caused by the leakage due to the gap between the vanes and the body of the oil pump.

Lubrication system for the transmission.

The flow characteristics of the oil pump equipped with filter.
The mathematic model of the transmission lubrication system
The mathematic model of the lubrication system consists of two parts, the pressure model and the flow model. The pressure model can be used to compute the pressure in a hydraulic chamber with a constant volume. This capacitive volume receives the volume flow rate from each port connected as input and gives pressure as output based on a set of differential equations. The flow model, on the contrary, predicts the volume flow rate through each port with a given pressure. Then, a detailed description of the mathematic model can be derived for each component in the lubrication network. The fluid temperature is an important factor for calculating the pressure and flow rate in the lubrication network, since the oil density and viscosity vary according to the fluid temperature. However, in this article, the lubricant temperature in the gearbox lubrication network can be assumed to be constant as 80°C, which is equal to the oil temperature in the oil pan. This is reasonable since the lubricant flows fast in the pipes and spends less than 10 s to pass through all the lubrication networks. Therefore, the lubricant oil has little thermal dissipation, and the lubrication network can be regarded as the constant temperature system. The density and the dynamic viscosity of the lubricant at 80°C are 854.5 kg/m3 and 0.009917 Pa s, respectively, shown in Table 1.
Simulation specifications for the capillary lubrication network simulation.

The pressure model
The hydraulic chamber model
The hydraulic chamber model in the lubrication network system can be regarded as the pressure source for the hydraulic models of the bend and orifice, with a given flow rate from each inlet. The diagram of the inputs and outputs of this capacitive element is shown in Figure 3.

The diagram of the capacitive chamber.
Although the lubrication oil can be considered as incompressible fluid in macro scale, it still has very small compressibility, which determines the rate of pressure variation in a constant volume. Then, the relationship between the pressure variation and the flow rate in each port of the chamber can be derived using the compressibility model expressed as

where

The pipe model
For the incompressible flow, the pressure drop

where
where
The flow model
The flow model calculates the volumetric flow rates against the hydraulic resistance to the respective pressure drops. The resistance forces can be caused by obstruction in the orifices or the changes in the flow direction in the lubrication circuit. The detailed mathematical models of the resistance mentioned above are shown in the following contents.
The orifice model
The flow rate through the restricted orifices can be shown in the following equation, using a classic orifice equation which is valid for steady, incompressible flow 16

where
The bend model
The variation of the flow direction in curved passage leads to the appearance of the centrifugal forces directed from the center of curvature toward the outer wall of the pipe. As a result, the flow from the straight to the curved portion of the pipe is accompanied by the increase in the velocity at the inner wall and correspondingly a decrease in the velocity at the outer wall. This could explain the existence of the transverse flow in a curved pipe and pressure losses due to the formation of eddies in the bend pipe.
The general equation for the volumetric flow rate

where

where
where

The resistance coefficient

where

The geometry of the bend.

The experimental data of
Flow field analysis of the capillary lubrication network in the rear auxiliary gearbox
The structure of the capillary lubrication network in the rear auxiliary gearbox is shown in Figure 6. The lubricant from the orifice E flows into the internal tube of the output shaft in the gearbox and is then swung into the capillary pipes by centrifugal force due to the rotation of the output shaft. After passing through the capillary pipes, the lubricant reaches the middle loop and some of the lubricant is distributed into the middle outlet to splash on the mesh surface between the sun gear and the planet gears in the planetary gear train of the rear auxiliary gearbox. The rest of oil continues to reach the outer loop and then flows out of the outer outlet to lubricate the mesh surface between the planet gears and the planet carrier. It can be seen that the lubrication quality of the rear auxiliary gearbox depends upon the quantity of oil supplied by the orifice E and is therefore determined by the flow rate from the inlet hole of the rear auxiliary gearbox lubrication system in Figure 1.

The structure of the capillary lubrication network in the rear auxiliary gearbox.
For numerical analysis of the lubrication performance of the capillary structure, the commercial CFD software, XFlow, which is developed based on lattice Boltzmann code, has been adopted in this article.
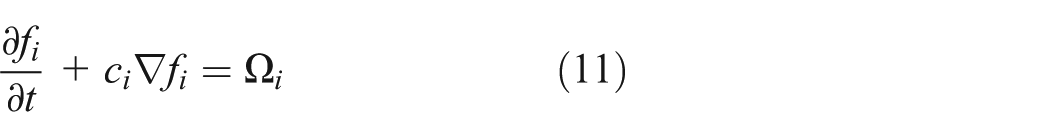
The lattice Boltzmann method (LBM) 20 follows a mesoscopic approach wherein the fluid dynamics are approximated by interactions between particles on a regular lattice. The key idea is to construct simplified kinetic models that incorporate the essential physics of microscopic processes so that the averaged properties obey the macroscopic equations. In XFlow, the compressible Navier–Stokes equations can be recovered by Boltzmann’s transport equation and the Chapman–Enskog expansion. The Chapman–Enskog expansion is a formal multiscaling expansion 20 which can be used for deriving the macroscopic hydrodynamic equation. Boltzmann’s transport equation can be defined as follows
where

where

where
Based on the statement mentioned above, XFlow can provide a proprietary fully Lagrangian particle-based kinetic approach which dramatically reduces the time to solution for a given level of solution accuracy. 21
Moreover, the software just requires the target scale resolved for the geometry or the shapes, and the time-consuming manual labor work of meshing can be eliminated. Therefore, XFlow is particularly suitable for calculating transient flow rate through each outlet in the capillary lubrication network. The simulation settings are shown in Table 1.
The resolved scale listed in Table 1 is the spatial resolution of the lattice. The smaller the resolved scale, the finer will be the spatial discretization of the flow field and thus more accurate. However, the simulation time will be large as more elements must be computed. The minimum dimensional size of the capillary lubrication network in this article is the gap width between outer loop and middle loop and is about 2.5 mm. This indicates that the resolved scale is accurate enough to characterize the curve surface of the geometry.
For CFD simulation, the Courant–Friedrichs–Lewy (CFL) condition is a necessary condition for simulation stability while solving certain partial differential equations numerically by the method of finite differences. 22
For the n-dimensional case, the CFL condition can be given as

where
The rotational speeds of both inner and middle loops are determined by the idle speed of the engine (i.e. the pump runs at 1000 r/min). Both the inner and middle loops rotate at its lowest speed and the centrifugal force applied on the lubricant in the capillary tube is the minimum. The bearings in rear auxiliary are at high risk of oil starvation. The simulation time was 5 s with the time step
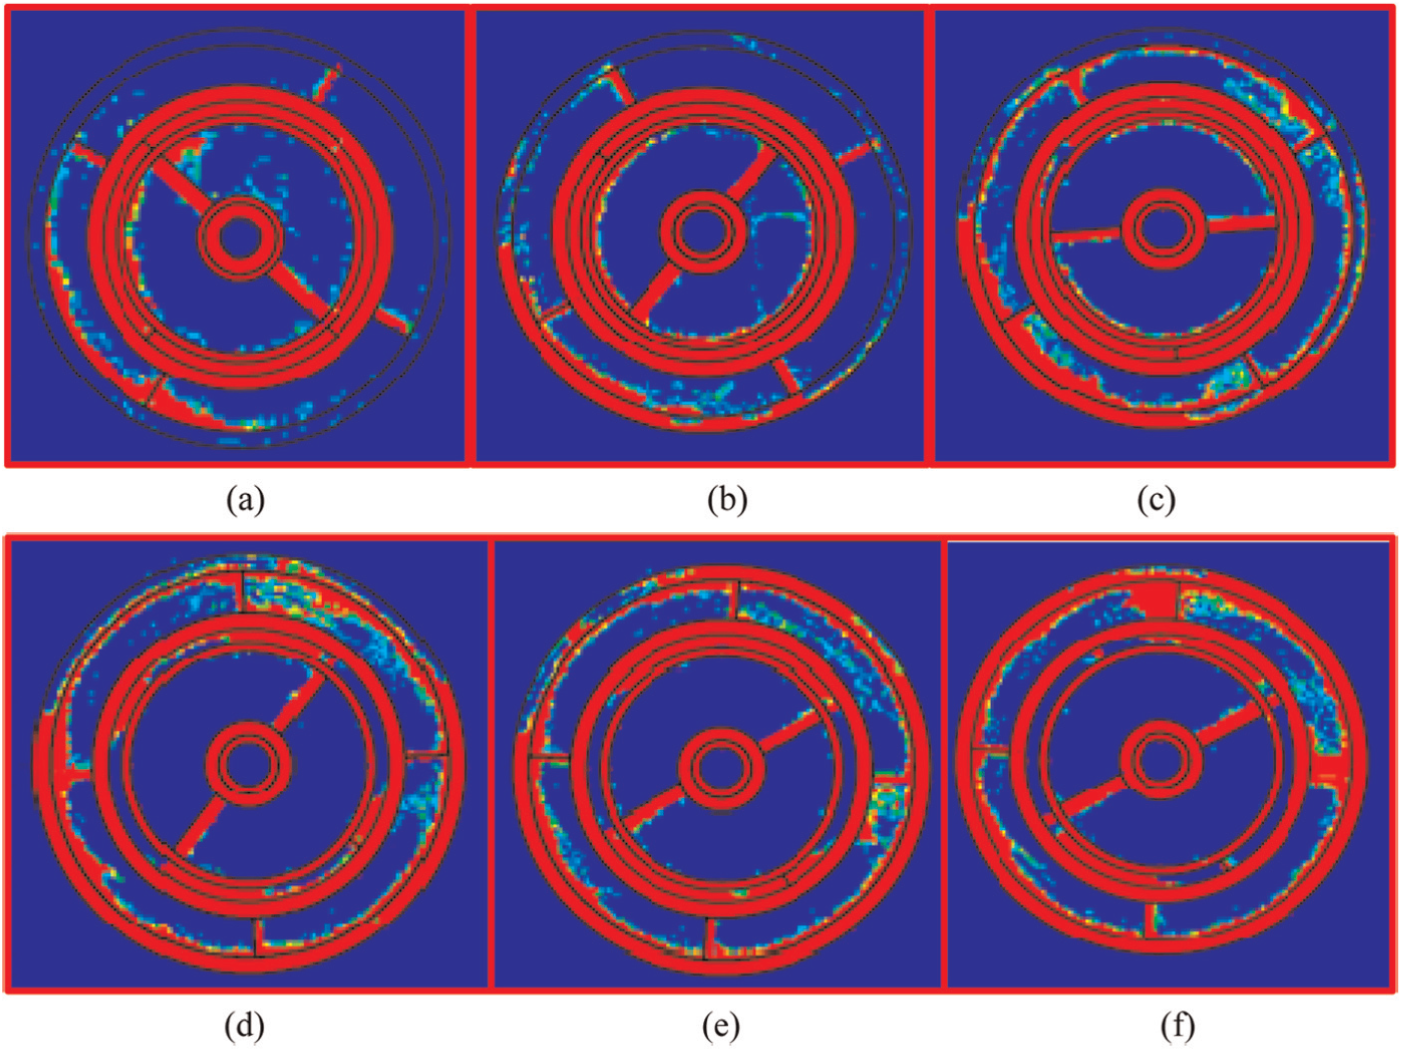
The lubrication performance versus inlet flow rate from orifice E: (a) 0.1 L/s, (b) 0.15 L/s, (c) 0.2 L/s, (d) 0.25 L/s, (e) 0.4 L/s, and (f) 0.35 L/s.

The steady flow rates through the outlets versus the inlet flow rate through orifice E.
It can be seen from Figure 7(a) that the outer loop is almost empty and no lubricant would flow out of the outer outlet when the inlet flow rate through the orifice E is less than 0.1 L/s. However, an obvious increment in the outer outlet flow rate can be noticed when the inlet flow rate is more than 0.15 L/s. The peak value of the middle outlet flow rate appears when the inlet flow rate is about 0.3 L/s. From that point onward, the flow rate through the middle outlet drops quickly while the lubricant quantity distributed to the inner outlet grows correspondingly.
It can be concluded that the best lubrication performance can be obtained if the inlet flow rate through the orifice E is kept to be stable within the range of 0.2–0.3 L/s. The reason in this case is that most of the oil can be injected into the capillary pipes due to the centrifugal force to lubricating the planetary gear train of the rear auxiliary gearbox. However, the lubricating efficiency would grow worse quickly if the inlet flow rate exceeds that range, since most of the lubricant is distributed into the inner outlet and returns to the oil pan through the drainback passage.
Sensitivity study and the optimal design of the lubrication system
Sensitivity study of the lubrication system
A sensitivity study has been conducted in this section to investigate the relationship between the oil distribution and the orifice diameters based on the computer analysis of the lubrication system. The key parameters include the diameters of the oil supply orifices (i.e. A, B, C, and D), the oil inlet holes for the front auxiliary and main gearbox and the rear auxiliary gearbox, respectively. The diameters of those orifices and the inlet holes for this benchmark lubrication system are listed in Table 2.
Benchmark design for the lubrication system.

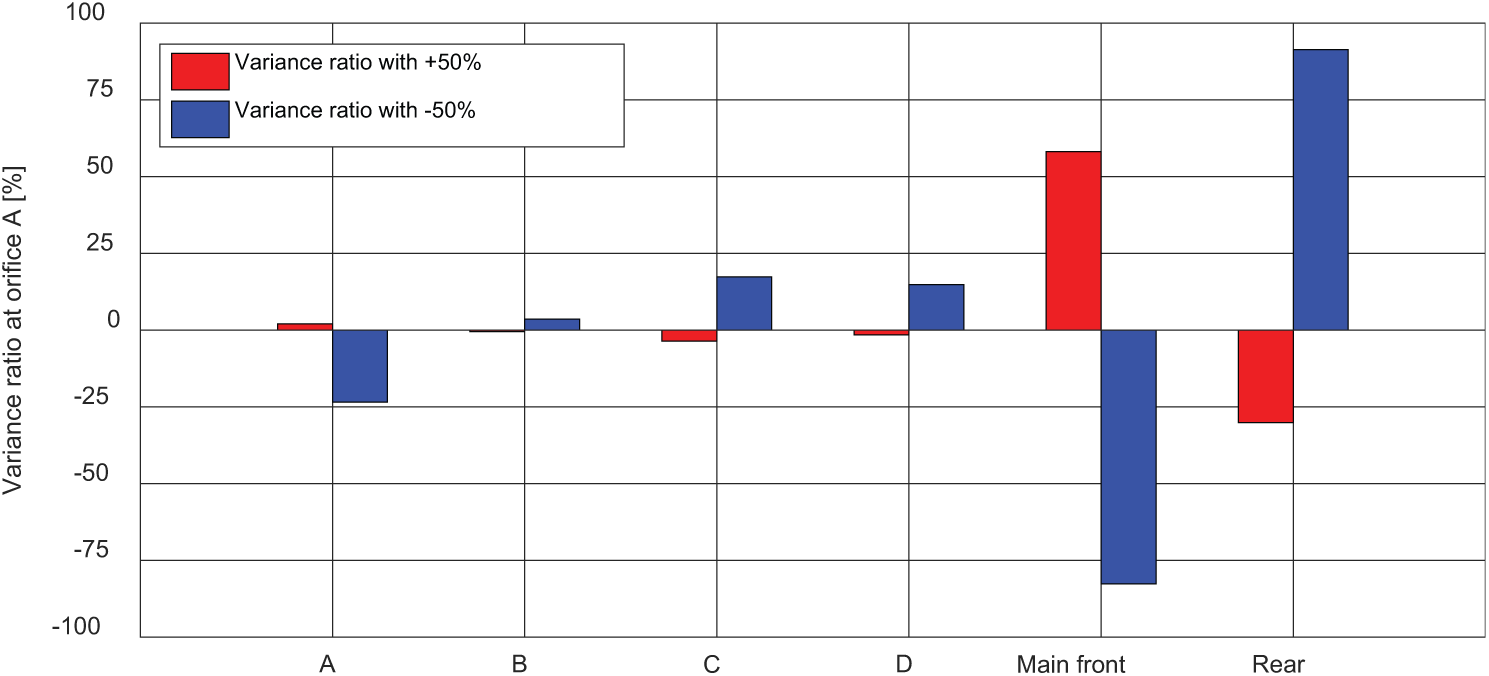
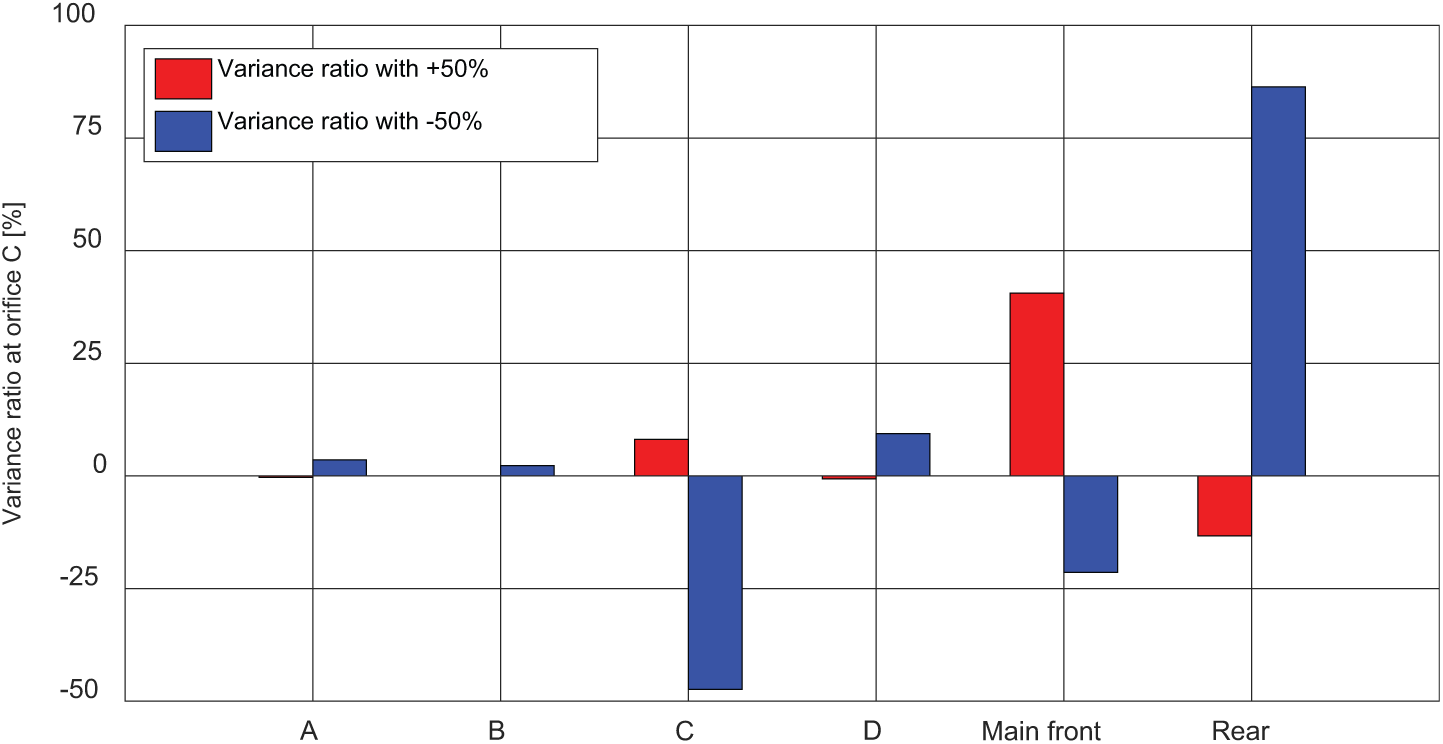
The procedure is described as follows: first, the benchmark design of the diameters shown in Table 2 is set as the baseline; then, a number of simulations are conducted by varying the diameters of each hole. Only one parameter increases or decreases 50% according to the benchmark value in each simulation. Finally, the variance ratio between the simulation results with the increased or decreased parameter and the baseline for each parameter is evaluated by

where A, B, C, D, E, Main_front, and Rear are the abbreviations used for representing the orifices A, B, C, D, E, the oil inlet holes for both the front auxiliary and main gearboxes, and the oil inlet hole for the rear auxiliary gearbox, respectively.
The sensitivity analysis results shown in Figures 9–13 demonstrate the contribution devoted by the diameter of each oil bore to the variance ratio of the volumetric rate through the oil supply orifices. It is shown that the diameters of oil inlets for both main and auxiliary gearboxes play a dominant effect on the flow rate through each oil supply orifices compared with the orifices A, B, C, and D. Therefore, the volumetric rates through the orifices A, B, C, and D can be increased significantly by reducing the diameter of rear auxiliary gearbox inlet hole or increasing the diameter of the main and front auxiliary gearbox inlet hole.


Optimal design of the lubrication system
In order to improve the lubrication quality of the oil network, a scanning algorithm is performed to obtain the proper sizes of oil inlet holes. This method assumes that each designing parameter belongs to a closed interval which can be divided into certain number of grid points. For the diameters

With these intervals,

Volumetric flow rate through orifice A.

Volumetric flow rate through orifice B.

Volumetric flow rate through orifice C.

Volumetric flow rate through orifice D.

Volumetric flow rate through orifice E.
Then, it is possible to select the model with correct diameters using the constraints given as follows:
The volumetric flow rate through orifice E should be kept within the range of 0.2–0.3 L/s according to the analysis results based on XFlow, when the engine is working at its idle speed. The pump rotates at 1000 r/min at this time.
The volumetric flow rate through each oil supply orifice in the main and front auxiliary gearboxes should be greater than 0.04 L/s according to the fatigue test of the gearbox at the idle speed.
In order to provide sufficient supply of lubricating oil to all consumers, the volumetric flow rate through each oil supplement orifice in the main gearbox should be increased as much as possible without enhancing the pump speed for fuel consumption reduction.
Then, the optimal set of the orifice diameters is listed in Table 3. The next step of work is to compare the calculated flow rates through the orifices A, B, C, D, and E to the real values measured at every pump rotational speed for both benchmark design and optimal design of the lubrication network. The life test of the gearbox has also been conducted together to investigate the lubrication quality at the worst case, that is, the “Hot Idle” condition (idle speed and high oil temperature). 21
Optimal design for the lubrication system.

Experiment and validation for lubrication performance
An experimental bench test for measuring the steady volumetric flow rate through the oil supply orifices A, B, C, D, and E is performed. The scheme and the pictures of the test bench are shown in Figures 19 and 20, respectively.
The scheme of the flow rate test bench.

The pictures of the flow rate test bench: (a) flow rate through the orifice A, (b) flow rate through the orifice B, (c) flow rate through the orifices C, (d) flow rate through the orifice D, and (e) flow rate through the orifice E.
In the bench test, the oil temperature is fixed at 80°C and the pump rotational speed is swept from 1000 to 3000 r/min. When the rotational speed is stable, five oil boxes are adopted for collecting the lubricant which passes through each oil supply orifice and finally drains vertically down through the bears and gears. Then, the steady volumetric flow rate through each orifice can be calculated by dividing the volume of the corresponding gearbox with the time to fill it. It can be seen in Figure 21 that the simulation results of the volumetric flow rate for both benchmark design and optimal design show good agreement with measurements at all pump rotational speed. The calculation results are within 5% error compared to the measurements. The errors could be the consequence of uncertainty about the oil viscosity or the inaccuracy of the mathematical model for describing the hydraulic stream through the complex flow network.

Validation of the calculated volumetric flow rate: (a) flow rate through the orifices A, B, C, and D for the benchmark design; (b) flow rate through the orifice E for the benchmark design; (c) flow rate through the orifices A, B, C, and D for the optimal design; and (d) flow rate through the orifice E for the optimal design.
The investigation of the volumetric flow rate through each oil supply bore indicates that, for the benchmark design, the lubricant distributed to the auxiliary gearbox might exceed the real demand according to the simulation results of XFlow shown in Figure 8. As for the main gearbox, however, the volumetric flow rate through orifice A is less than 0.4 L/s at the idle speed. As a result, oil starvation may occur and the lubrication of the connecting rod bearing can then be compromised. It could be noticed from both experiment and simulation results that the optimal design of the lubrication system satisfied all the requirements. The flow rate through orifice E is about 0.28 L/s, which leads to less hydraulic losses in the auxiliary gearbox, and more lubricating oil can therefore be distributed to orifice A. The next step of work is to conduct the endurance tests for both benchmark and optimal designs for validating the lubrication quality and the reliability of the gearbox under severe conditions.
The reliability test was performing using the test bench shown in Figure 22. To simulate the severe operations of the gearbox, a driving torque of 2000 N m was applied to the input shaft. The rotational speed of the input shaft was kept to be stable at the idle speed, and the oil pump ran at the speed of 1000 r/min. To evaluate the degree of damage to each rotary component, the period of time for each gear engaged in the endurance test is shown in Table 4. The engaged period is determined by the frequency of usage for each gear in the gearbox.

The reliability test bench.
The period of time for each gear engaged in the endurance test.

For the optimized design, more than 95% of the bearings in the group would exceed the life span demand, which is much better measure of reliability than the benchmark design, which only 40% of the bearings will survive. For example, in Figure 23(a), highly polished areas can be observed along the needles of the bearings lubricated by the orifice A using the benchmark design, which indicates that rolling needles broke through the oil film on the outer ring and excessive wear occurred on the contact area. Moreover, the fracture shows upon the bearing cage, which means the average oil film thickness is less than the composite surface roughness and the surface asperities come into contact with each other under relative motion. 23 These failures are caused by the oil starvation, since a too-low lubricant supply can cause the oil to be overheated by the friction, thus greatly deteriorating the oil lubrication quality. The test sample shown in Figure 23(b) indicates a good lubrication quality. The optimal design of the lubrication network can ensure a proper oil distribution and therefore improves the gearbox fatigue life without increasing the speed of the pump or sacrificing the load capacity of the bears.
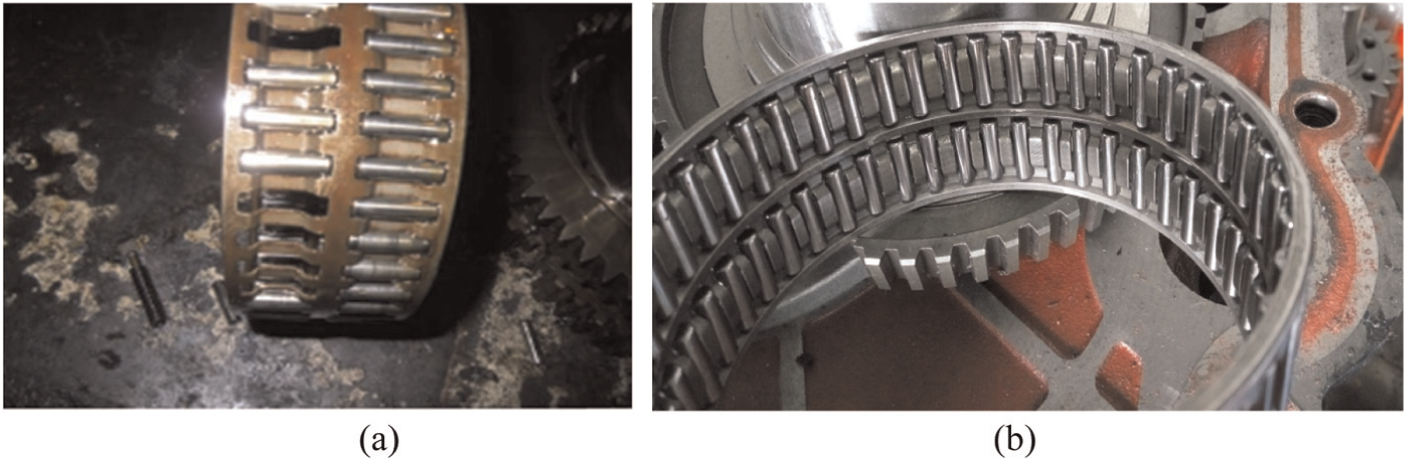
The reliability test result: (a) the bearing sample lubricated by the benchmark design through the orifice A and (b) the bearing sample lubricated by the normal design through the orifice A.
Conclusion
In this article, a detailed computational method for the flow network analysis of the lubrication circuit in the commercial vehicle gearbox is developed based on the hydraulic theory. This mathematical model takes into consideration of the flow resistance through the oil pipes and orifices and is capable of calculating volumetric flow rate distribution in the flow network. Then, the Next Limit Technologies’ XFlow, a potential new 3D CFD software based on LBM, is adopted to obtain the relationship between the oil delivery and the lubrication effect in the low-pressure capillary lubrication network of the auxiliary gearbox. To achieve the best overall lubricating performance of the flow network, the optimized design of the diameter for each oil supply orifice is determined by a detailed sensitivity analysis on the contribution of each parameter to the volumetric flow rate. The bench tests for the volumetric flow rate have been performed for validating the calculation accuracy of both benchmark and optimal designs, and the endurance tests indicate a remarkable reduction in mechanical weariness when the best solution of the flow network design for the transmission lubrication system is adopted.
Footnotes
Academic Editor: Jianqiao Ye
Declaration of conflicting interests
The author(s) declared no potential conflicts of interest with respect to the research, authorship, and/or publication of this article.
Funding
The author(s) disclosed receipt of the following financial support for the research, authorship, and/or publication of this article: This research was supported by the National Natural Science Foundation of China (grant nos 11472112 and 11172108). This financial support was gratefully acknowledged.