
Abstract
Cavitation phenomenon has strong transient characteristics and is highly influenced by geometric structure. In this study, the cavitation performance with influence of blade tip clearance for a mixed-flow pump is studied using the renormalization group (RNG) k–ε turbulence model and the Zwart–Gerber–Belamri cavitation model. The dominant frequency and maximum amplitude values at non-cavitation condition and different cavitation conditions are compared and associated with flow field features. The results show that the dominant frequency value under incipient cavitation and critical cavitation is 3.2fi and when the cavitation is severe, the frequency value changes to 3.5fi. Then, the influence of tip clearance width on cavitation performance of the mixed-flow pump is also discussed. The results show that the increase in tip clearance will significantly aggravate the performance drop of the pump under cavitation conditions. The critical net positive suction head value increases in 4.79% of the value under no-tip clearance condition. At the same time, by the inner flow field observation and analysis, the morphological of cavitation bubbles is also changed, and the cavitation bubbles tend to attach to the blade suction side and the attachment length increases as the tip clearance increases.
Introduction
Cavitation is a common hydrodynamic phenomenon in all kinds of hydraulic machineries. It can lead to the performance deterioration, noise, pressure fluctuation and even damage to the hydraulic machinery. Mixed-flow pump is a widely used pump type among all the pump types. It has the characteristics of high efficiency and wide operation range. The inlet diameter of the mixed-flow pump is relatively bigger compared with the centrifugal pump, so the decrease in pressure will be more accurate at pump inlet. Due to the structure feature, cavitation phenomenon is easier to arise in the mixed-flow pump, so the research of cavitation in mixed-flow pump is of high value.
Many researches have been performed on the cavitation performance of pumps in many aspects using different methods.1–6 Due to the complicated distribution and variation of the multiphase flow in the cavitating pump, the transient characteristics of cavitation phenomenon should be investigated. Most existing papers of mixed-flow pump cavitation performance are studied by steady simulation method. And also, for the mixed-flow pump, there are plenty of influencing factors that impact the cavitation performance, such as the geometric parameters 7 and the inflow conditions. 6 The blade tip clearance is a generally neglected parameter but may have great significance to the cavitation performance. The tip clearance is mostly studied in the axial flow pumps and inducers because the clearance is more obvious in the axial types. 8 Tabar and Poursharifi 9 have studied the cavitation inception in an axial flow pump and figured out that the tip sharpness and geometry are the most important parameters that affect the cavitation area. Torre et al. 10 have also figured out that different tip clearances can lead to different cavitating behaviours. The mixed-flow pump has geometric similarities with axial flow pumps and inducers especially at impeller region, so the tip clearance should also be concerned and studied. Li et al. 11 have investigated the influence of non-uniform tip clearance on the internal flow field, and the results show that the tip clearance has great influence on the internal flow field of the mixed-flow pump. But the influence of tip clearance on the cavitation performance is still lack of research.
In this study, the transient characteristics of a mixed-flow pump and the influence of tip clearance on the cavitation performance are investigated. The external performance, transient pressure fluctuation and the inner flow filed are associated by the analysis.
Case description and numerical algorithm
Parameter of the mixed-flow pump model
The research subject is a mixed-flow pump with guide vanes. The blade numbers of the impeller and guide vane are 5 and 6, respectively. The design parameters are as follows: design flow rate Qd = 0.54 m3/s, pump head H = 17 m and rotation speed n = 1450 r/min. The design of the pump impeller is based on direct inverse design method.12–14 The model and meshes of the pump are shown in Figures 1 and 2, respectively.
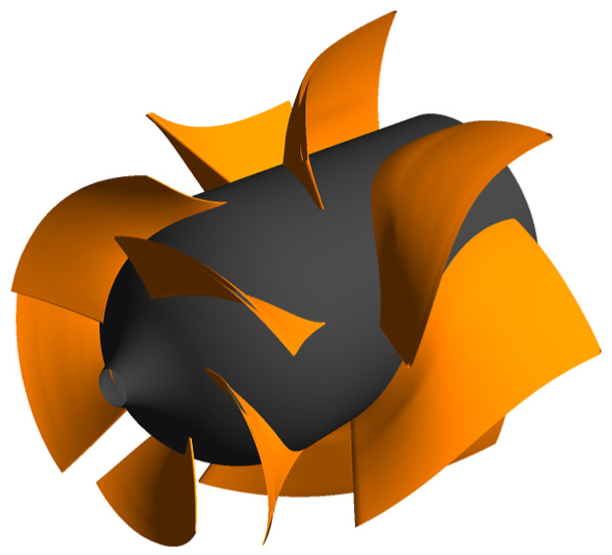
Mixed-flow pump model.
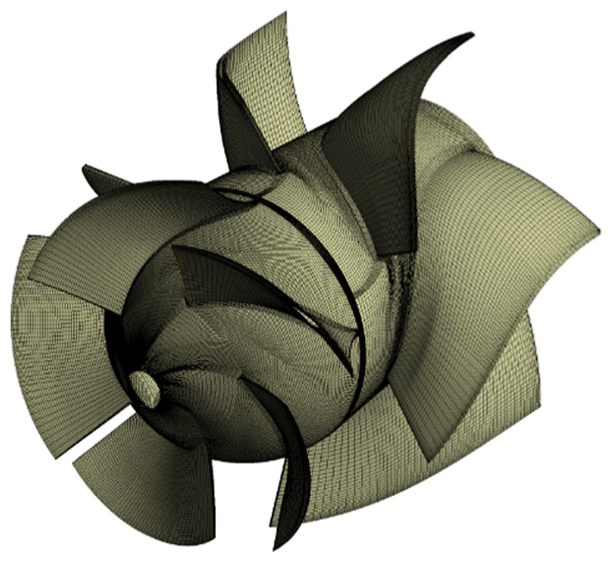
Mesh of the pump.
Computational methodology
In this study, the numerical simulation is the main method to evaluate the pump performance and to calculate the pump cavitation behaviour. The simulation is carried out by the computational fluid dynamics (CFD) software ANSYS-CFX. The RNG k–ε turbulence model with scalable wall functions is chosen as the turbulent model due to its wide application and high accuracy in rotational machinery. The inlet pressure and outlet mass flow rate are set as boundary conditions. All the physical walls are considered as no-slip wall. For the cavitation performance calculation, the model is chosen as Zwart–Gerber–Belamri model based on Rayleigh–Plesset Equation, which is widely used in predicting the cavitation behaviour in pumps. Table 1 shows the detailed numerical simulation setting. For both the cavitation and non-cavitation conditions, the calculation is seen as convergent when the root mean square (RMS) residual is below 1.0 × 10⁻⁵. In the transient simulations, the timescale affects both the calculation effect and speed. The timescale value is mainly determined by the rotation speed of the impeller, and the changing speed of the inner flow phenomenon. Three time step values, 1.2931 × 10⁻⁴ s, 2.5862 × 10⁻⁴ s and 5.1724 × 10⁻⁴ s, which are 1/320, 1/160, 1/80 of rotation period T, are used to calculate the pressure fluctuation in the pump.
Numerical simulation setting.

In order to monitor the inner flow field conditions, several monitoring points are set in different regions of the pump. Figure 3 has shown some representative points in the impeller and guide vane surfaces. The ISS1–ISS5 are the points at impeller suction side listed from blade leading edge to trailing edge. In the pressure side, there are corresponding points IPS1–IPS5. The II1–II5 and IO1–IO5 are the monitoring points at leading edge and trailing edge, respectively. IMS1–IMS5 are points at middle chord of the impeller suction side, while five points IMP1–IMP5 are at pressure side. With the same naming rule, the DI1-5, DO1-5, DPS/DSS1-5 and DMS/DMP1-5 are set in the guide vane region. Apart from the points in impeller region and guide vane region, four points named as CP1–CP4 are set at the gap between the two regions.

Position of monitoring points: (a) monitoring points in impeller region and (b) monitoring points in guide vane region.
The simulation has been carried out with the three values and the results are shown in Figure 4. It is obvious that the time histories of pressure are coincident in the three time step values. Considering both the transient details and calculation efficiency, the time step of 2.5862 × 10⁻⁴ s is chosen as the final set, which is 1/160 of the rotation period.
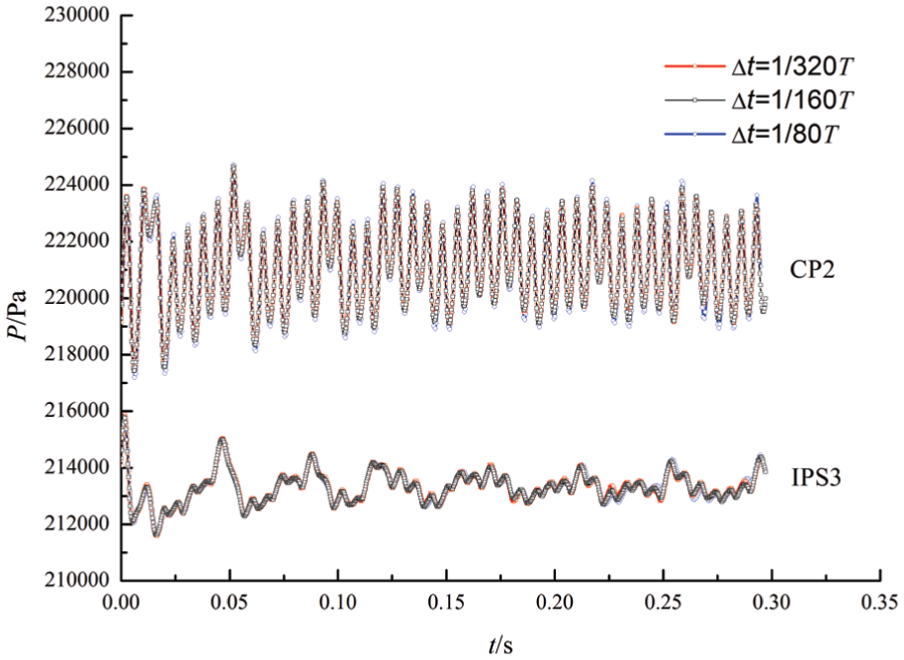
Comparison of pressure fluctuation under different time step values.
When calculating the cavitation performance, the non-cavitation simulation results are used as initial values. The total pressure at pump inlet is decreased gradually to motivate the cavitation phenomenon. To quantify the cavitation, the critical net positive suction head (NPSHC) is chosen as the standard of the cavitation performance, which is equal to the available net positive suction head (NPSHA) value when the pump head decreases for 3% of the non-cavitation head.
Experimental results of the mixed-flow pump and simulation accuracy validation
Experiment platform and measurement variables
The experiment is conducted on the platform of Beifang Investigation, Design & Research Co., Ltd at Tianjin, China. In the performance test, the mass flow rate, pressure at pump inlet and outlet, torque and speed of the motor are the main measured variables. The head of the pump, which is determined by the total pressure at the inlet and outlet, can be calculated by equation (1) where p is the pressure of the pump; ρ is the fluid density; Z is the height; v is the velocity of the fluid; subscripts 1 and 2 represent the pump inlet and outlet, respectively. The theoretical head Ht is defined as equation (2) where M and ω are the torque and rotation speed of the motor, respectively. The pump efficiency is defined as equation (3)


In the experiment, the tip clearance between the blade top and shroud wall cannot be directly measured due to the limitation of pump structure, while it is indirectly controlled by the axial movement of shaft.
Comparison between experimental data and numerical results
The three-dimensional (3D) model and the meshes of different components are generated by 3D modelling software and ANSYS-ICEM. The meshes of tip clearance domain are generated separately to guarantee the mesh quality, and 20 layers are set in the clearance. 15 Before the calculation, the grid independence test has been carried out on the no-tip clearance pump, which shows that when the grid number exceeds 3,500,000, the performance error is below 2%. So the topology for the 3,500,000 grid is chosen for the calculation and the tip clearance domain grid number is mainly controlled by layer number and mesh quality.
In order to validate the accuracy of simulation, the calculation results are first compared with experimental data. After the mesh generation, the head and efficiency are calculated using ANSYS-CFX by the calculation methodology that was mentioned above. The hydraulic efficiency ηh can be calculated by simulation results, and the mechanical efficiency ηm and volume efficiency ηv can be determined by empirical equations (4) and (5)


where ns is the specific rotation speed of the mixed-flow pump.
The total efficiency is calculated as equation (6)

The comparison of hydraulic performance of no-tip clearance pump is shown in Figure 5, in which the head and efficiency curves are both in good agreement. The relative difference between test results and numerical results is below 2% in the whole flow rates. According to the comparison, the accuracy of the numerical method can be confirmed.
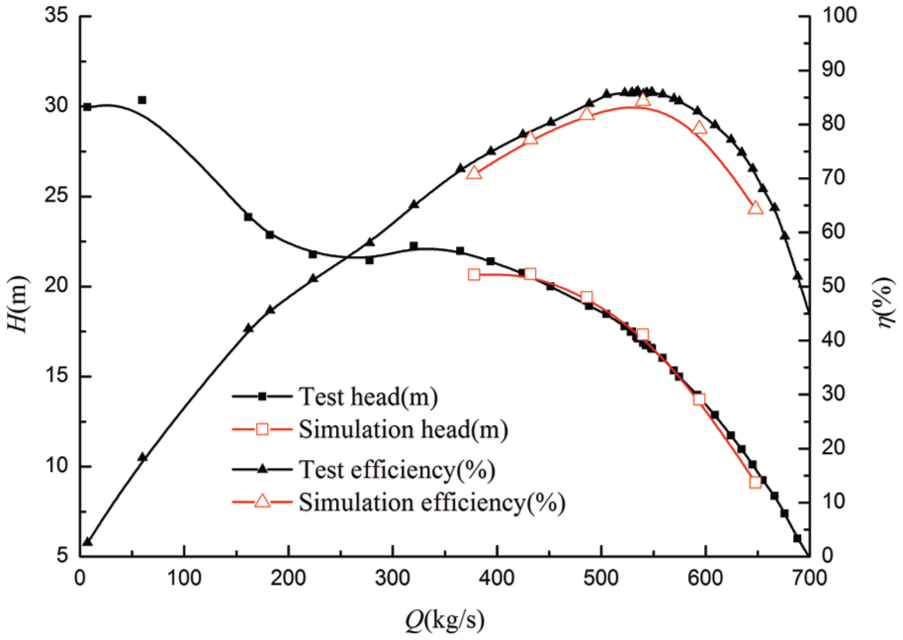
Comparison of hydraulic performance of no-tip clearance pump between calculation and test results.
Transient cavitation characteristics of the mixed-flow pump
Steady cavitation performance of no-tip clearance pump
The cavitation performance of the pump is calculated by employing the Zwart–Gerber–Belamri cavitation model. The head-NPSHA curves and efficiency-NPSHA curves are generated according to the calculation data in different cavitation conditions.
In the evaluation of cavitation performance, the head performance is the biggest concern. The head-NPSHA curves of simulation and test are shown in Figure 6. The simulation curve has an anastomotic with the test data. The results show the downtrend, drop position and descend range. The NPSHC value, which is a parametric standard of cavitation, is calculated and the value is 13.58 m for the no-tip clearance pump.
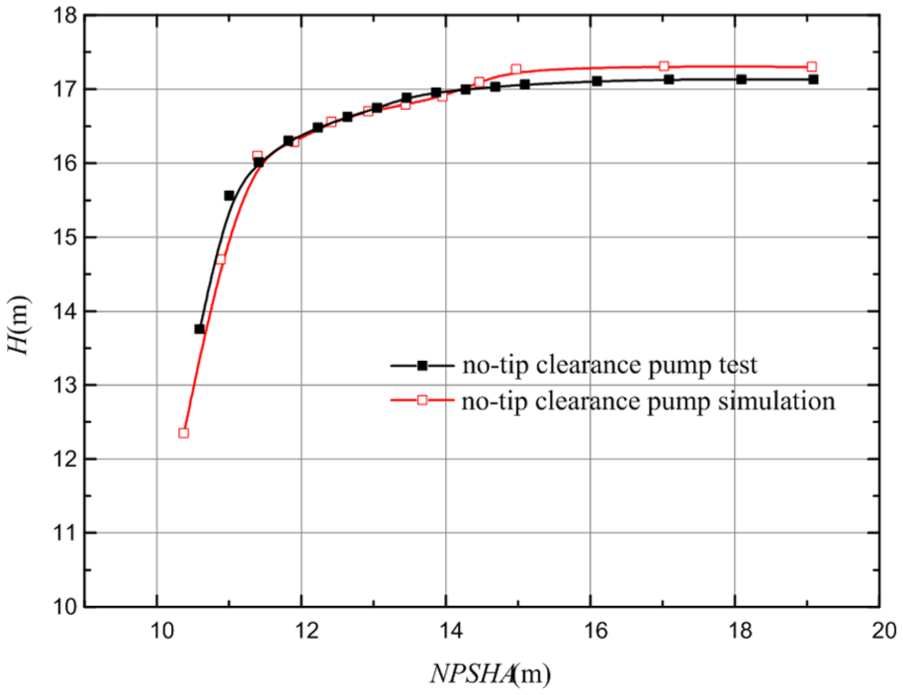
Head-NPSHA curve of the no-tip clearance pump.
Transient pressure characteristics under different cavitation conditions
The transient characteristic of the mixed-flow pump is calculated under non-cavitation and three different cavitation conditions, which are incipient cavitation, critical cavitation and severe cavitation. And the corresponding NPSHA values are 14.30 m, 13.58 m and 12.10 m. The transient pressure could be monitored directly in the calculation process.
The time history curves of pressure fluctuation could directly give a visualized result, but the detailed information of the fluctuation should be further analysed in frequency spectrum. In this work, the fast Fourier transform (FFT) is used to process the transient pressure data. Some representative points at impeller inlet, impeller suction side, gap between impeller and guide vanes, guide vane concave surface are listed in Figure 7 in different cavitation conditions. In order to facilitate the analysis, the frequency value is normalized by impeller rotation frequency, which is 24.17 Hz.

Frequency range chart of representative points under different cavitation conditions.
Under non-cavitation condition, it is obvious that the peak value appears at integer multiples of the impeller rotation frequency, especially at 1fi, 5fi and 6fi. 5 and 6 are the blade number of impeller and guide vanes, respectively. In the impeller region and gap between impeller and guide vane, the dominant frequency is 6fi, while in the guide vane region the frequency is 5fi. The fluctuation peak at 5fi and 6fi could be explained by the interaction between rotating impeller and stationary guide vanes. The rotation of impeller leads to the periodic variation of the physical boundaries of the flow field. In guide vane points DSS3-5, some pressure peaks show at low frequency domain, which is always associated with flow separation or vortex in the corresponding regions.
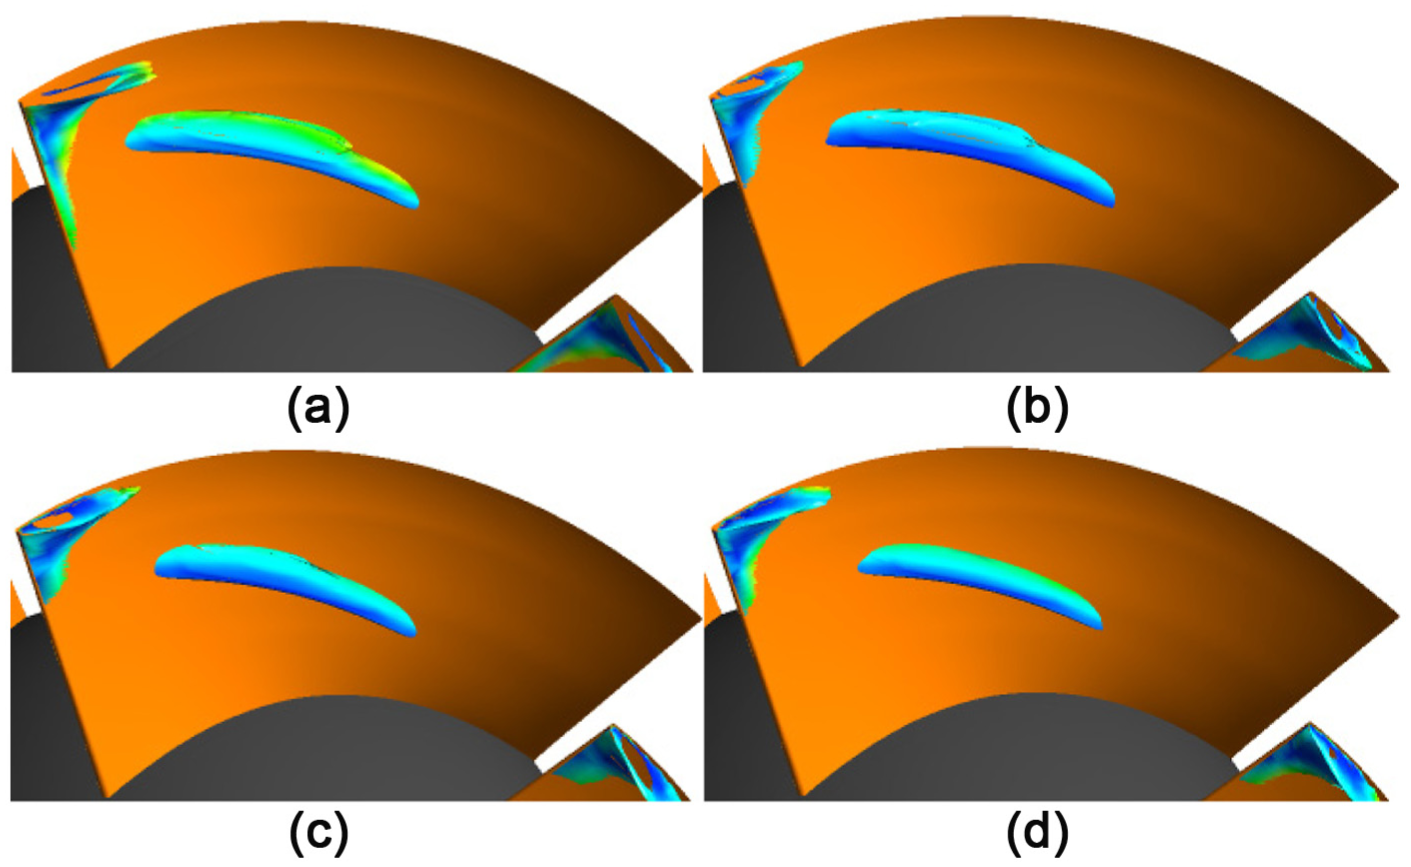
The synchronous fluctuation is the fluctuation with frequency of multiple of rotational frequency. In the non-cavitation conditions, the synchronous fluctuation shows the highest peak in the spectrogram, like the fluctuation peaks under 5fi and 6fi. But when the cavitation occurs, the synchronous fluctuation is no longer dominating. Under incipient and critical cavitation conditions, the dominant frequency is 77.28 Hz, which is about 3.2 times of the rotational frequency. The amplitude peaks under synchronous frequency still exist but the amplitude value is much smaller than the non-synchronous fluctuation. Comparing with the non-cavitation condition, it could be concluded that the non-synchronous fluctuation is caused by cavitation phenomenon. The incipient and critical conditions share the same dominant frequency, which indicates a similar transient cavitation process. Figures 8 and 9 show the isosurface distribution of 10% vapour volume fraction in the pump impeller under 14.30 and 13.58 m NPSHA. In the two sets of flow field figures, the extension and shortening processes are apparent and the variation period is 0.0129 s, which is coupling with the dominant frequency of 77.28 Hz.
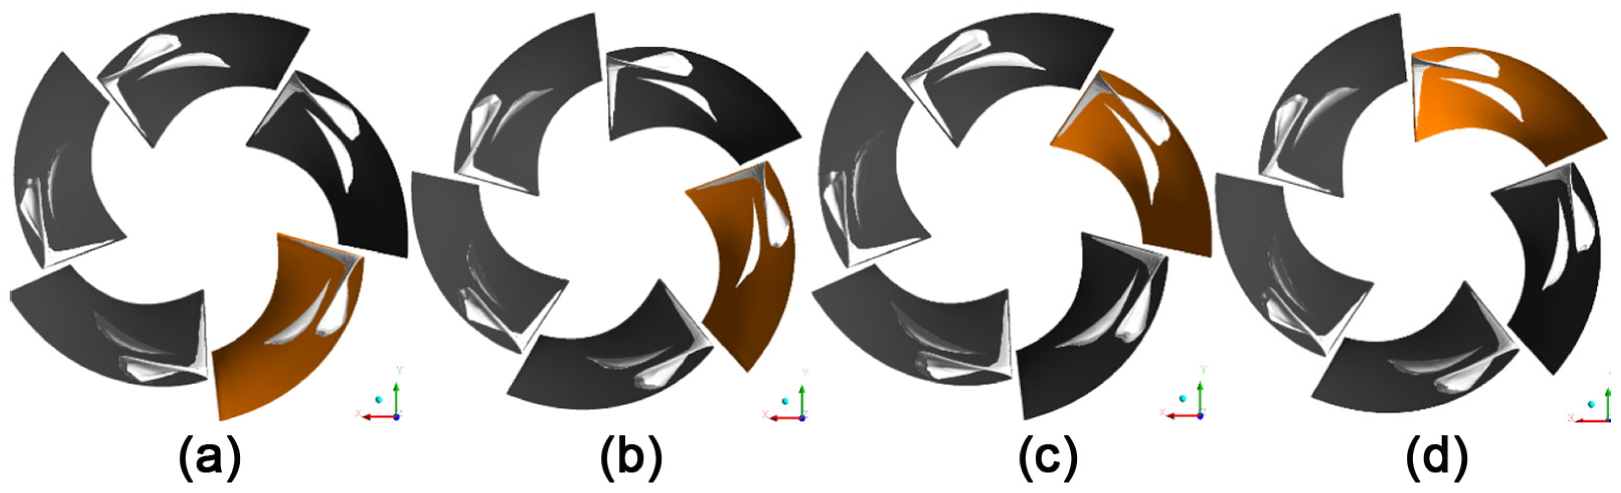
Isosurface distribution of 10% vapour volume fraction under NPSHA = 14.30 m: (a) t = t0, (b) t = t0 + 0.0043 s, (c) t = t0 + 0.0086 s and (d) t = t0 + 0.0129 s.
Isosurface distribution of 10% vapour volume fraction under NPSHA = 13.58 m: (a) t = t0, (b) t = t0 + 0.0043 s, (c) t = t0 + 0.0086 s and (d) t = t0 + 0.0129 s.
When the NPSHA value is 12.10 m, which is lower than critical value NPSHC, the cavitation condition has a qualitative change compared with the other two conditions. The cavitation regions expand, link together, disconnect and shrink, as shown in Figure 10. The frequency of the processes is corresponding to the dominant frequency of the severe cavitation condition, which is about 84 Hz. Apart from the difference of dominant frequency, the frequency domain curves are also differ from the other conditions. Near the pressure peak, several secondary peaks appear. The phenomenon is more obvious in the impeller region, which indicates that under severe cavitation condition, some relatively small vortex or pressure fluctuation is induced by the transient cavitation process. With the spread of the flow, these flow phenomena are also propagated to the downstream areas, like the guide vane region. In the severe cavitation condition, the synchronous fluctuation is almost entirely over-ridden by the fluctuation caused by cavitation.

Isosurface distribution of 10% vapour volume fraction under NPSHA = 12.10 m: (a) t = t0, (b) t = t0 + 0.00388 s, (c) t = t0 + 0.00776 s and (d) t = t0 + 0.0119 s.
When comparing the maximum amplitude of the pressure fluctuation as Figure 11, more information could be fetched. The most obvious point is that the amplitude of non-cavitation condition is much smaller than the cavitation conditions, which could explain the noise, vibration and destruction of pump under cavitation conditions. In the impeller leading edge, due to the different distribution of cavitation bubble, the amplitude values are not regular in different points. In the impeller suction side points IMS4 and IMS5, the amplitude increases as the NPSHA value decreases, but the value of severe cavitation condition appears at low frequency. In the other monitoring points, the amplitude values have an order: 13.58 m > 12.10 m > 14.30 m > non-cavitation, and the dominant frequency is corresponding to the period of cavitation development. The conclusion shows that when the cavitation first emerges and develops, the periodic pressure fluctuation would be enhanced, but when the cavitation keeps on developing, the maximum amplitude would not enlarge. Some flow phenomenon like vortex or secondary flow caused by cavitation would lead to small secondary pressure peaks near the dominant frequency.

Maximum amplitude of pressure fluctuation in different monitoring points.
Cavitation performance of mixed-flow pumps with different blade tip clearance
Apart from the transient characteristics, the influence of tip clearance width to the mixed-flow pump is also studied. Three different impeller models with different tip clearance widths are generated, and the clearance width values are 0.2, 0.65 and 1.0 mm. The meshes for the tip clearances are generated separately by ICEM to guarantee the mesh quality.
Non-cavitation performance of the pumps with different tip clearances
From the comparison of performances as shown in Table 2, the hydraulic performance deterioration is apparent as the tip clearance increases. The main reason for the drop is the vortex and uneven flow caused by tip clearance, which can be seen in Figure 12. When there is no tip clearance, the streamline and pressure distribution are both uniform. As the clearance width increases, the backflow in the clearance first impacts the downstream areas, and then the upstream region will also be affected. Vortex is observed in both areas and the range of vortex expands as the clearance width increases. At the same time, low pressure regions emerge along with the vortex. It can be concluded that the clearance width will highly affect the inner flow field of the mixed-flow pump, bring irregular and unstable flow to the pump impeller. In the next sections, the performance of the blade tip clearance to cavitation performance will be further investigated.
Comparison of head drop due to tip clearance between simulation and test.


Pressure and streamline near blade tip clearance of (a) 0 mm, (b) 0.2 mm, (c) 0.65 mm and (d) 1.0 mm.
Cavitation performance of the mixed-flow pumps
The cavitation performance of the with-tip clearance pumps is calculated by the same method for no-tip pump. The four head-NPSHA curves are shown in Figure 13. Compared with the pumps with tip clearance, the no-tip clearance pump presents a flatter cavitation curve at high NPSHA values, which indicates a better cavitation performance. For the impellers with tip clearance, a bigger clearance width means a poorer cavitation performance.
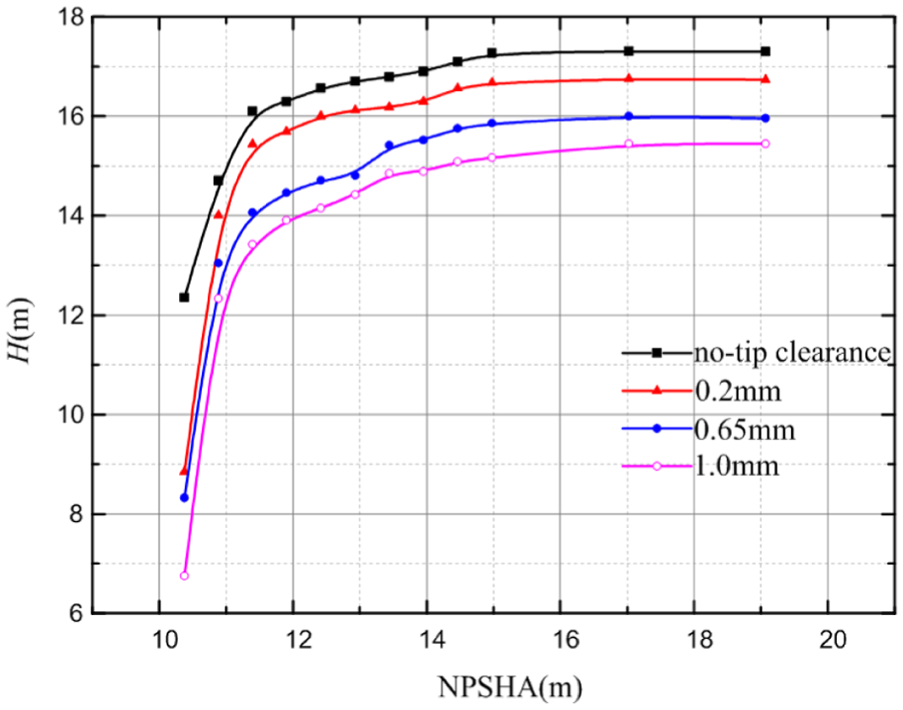
Cavitation curves.
The NPSHC values are calculated and listed in Table 3 and the difference of pump head and NPSHC is shown in Figure 14. When the tip clearance is narrower than 0.2 mm, the two values are similar, which indicates that a very tiny tip clearance will not lead to acute cavitation performance change. But when the width keeps increasing, the difference gradually increases, shows an obvious influence to the inner flow field, especially the bubble distribution.
Head and NPSHC values of pumps.

NPSHC: critical net positive suction head.

Head and NPSHC values of pumps.
Analysis of inner flow field and bubble form
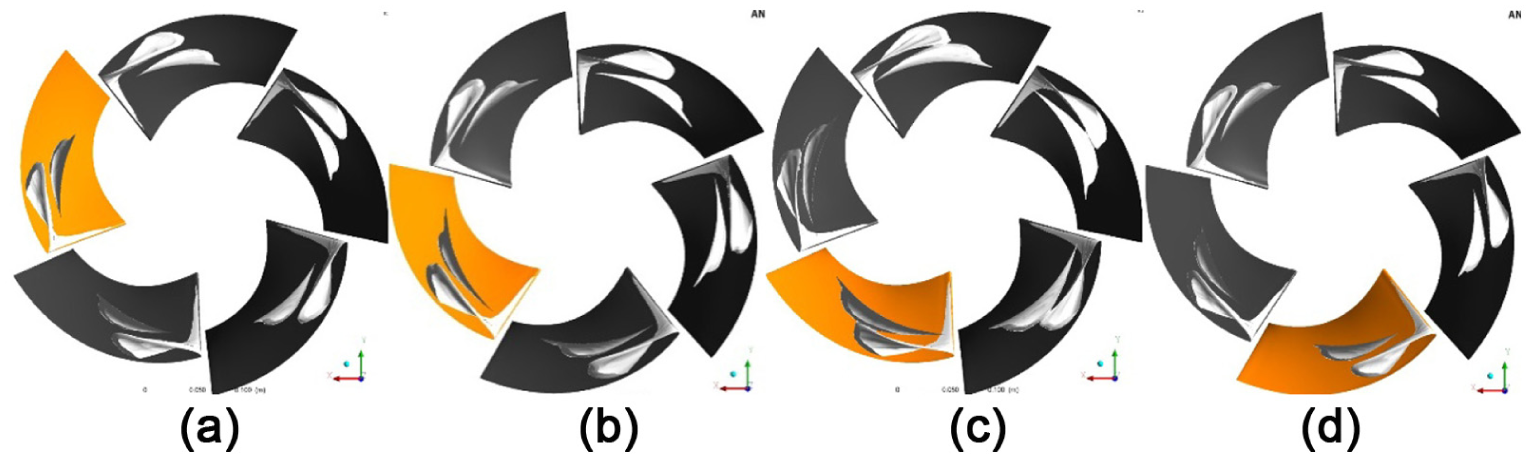
The cavitation curve is the outward manifestation of cavitation performance, while the inner flow field variation is the immanent cause of the performance deterioration. In this section, the inner flow field of pumps with different tip clearance widths is analysed to understand the differences between the pumps. The isosurface of vaporous water volume fraction equal to 0.1 is shown in Figures 15–17, which is the working conditions under NPSHA = 14.98, 12.94 and 11.92 m, respectively. From the cavity development, the process of inception, evolution and the combination of cavitation bubbles in the impeller can be clearly observed. And from the lateral comparison of the four impellers under same NPSHA value, the difference of cavitation condition caused by the variation of tip clearance could be investigated.
Isosurface of 10% vapour volume fraction in pumps with tip clearance width of (a) 0, (b) 0.2 mm, (c) 0.65 mm and (d) 1.0 mm when the NPSHA = 14.98 m.

Isosurface of 10% vapour volume fraction in pumps with tip clearance width of (a) 0, (b) 0.2 mm, (c) 0.65 mm and (d) 1.0 mm when the NPSHA = 12.94 m.

Isosurface of 10% vapour volume fraction in pumps with tip clearance width of (a) 0, (b) 0.2 mm, (c) 0.65 mm and (d) 1.0 mm when the NPSHA = 11.92 m.
Figure 15 shows the incipient condition of the four pumps, when the pump head drops slightly for about 1% of the non-cavitation head. The distribution of cavitation bubbles shows visible difference between no-tip clearance and with-tip clearance impellers, especially at the blade leading edge. Compared with the no-tip clearance impeller, the with-tip clearance impellers show an apparent attached cavitation characteristic. The attachment area is the impeller tip clearance region near the impeller leading edge. As the tip clearance width increasing, the feature enhances and the area expands. At incipient cavitation condition, the bubble region in the middle of passage does not show obvious difference.
When the NPSHA is 12.94 m, which is below the NPSHC values of each pump, the pumps are under fully developed cavitation condition. In the impeller with tip clearance of 0, 0.2 and 0.65 mm, the cavitation regions show a similar regular pattern as the cavitation inception condition. The bubbly area expands from the inception position, and the attachment of bubbles in blade suction side of with-tip clearance impellers are more obvious. The attached bubbles at 0.2 mm clearance and 0.65 mm clearance impellers occupy for about one-fourth and one-third of the of the suction side, from which it can be concluded that the increase in tip clearance will enlarge the attachment length of bubbles at blade suction side. The existence of tip clearance leads to the leakage between suction side and pressure side. Due to the pressure difference, the leakage flow in the clearance is with high speed and leads to a low pressure in the tip clearance. The gap cavitation then emerges in the tip clearance region. When the gap cavitation area and the cavitation in suction side combined, the attachment cavitation region is formed. Another reason for the attachment is that the vortex caused by the tip clearance, which can be observed in Figure 16, decreases the pressure level near the blade suction side, and as the tip clearance increases, the low pressure region in blade also enlarges and develops to the downstream area.
However, the inner flow field of 1 mm impeller has a qualitative difference from the other three impellers. The bubbles in different passages link together to form a cavitation ring at the inlet of the impeller. The connected bubbly regions highly deteriorate the pump performance. When the NPSHA value drops to 11.92 m, except for the no-tip clearance impeller, the bubbly regions in different passages are all in connection and the area increases as the tip clearance enlarges.
Conclusion
The transient characteristics under different cavitation conditions and the influence of blade tip clearance on the cavitation performance of a mixed-flow pump have been investigated, and the main conclusions can be drawn as follows:
For non-cavitation condition, the dominant frequencies are the multiples of the rotation frequency, while for cavitation condition, the dominant fluctuation becomes different. The incipient cavitation and critical cavitation conditions have the same dominant frequency of 3.2fi, while the severe cavitation condition has the dominant frequency of 3.5fi. By comparing the transient features of the inner flow field and the pressure fluctuation, the dominant frequency is associated with the variation of cavitation regions.
For the pump with blade tip clearance, the head approximately linearly decreases by 1.88 m while the efficiency drops by 3.75%. Under the cavitation conditions, the NPSHC increases as the tip clearance increases with deterioration of cavitation performance. When the tip clearance increases from 0 to 1.0 mm, the NPSHC increases by 0.65 m, which is 4.79% of the NPSHC value under no-tip clearance condition.
In the impellers with tip clearance, the cavitation bubbles tend to attach to the blade suction side and the attachment length increases as the tip clearance increases. The process of inception, evolution and the combination of cavitation bubbles are different in the four impellers with different tip clearances. The present research shows that the larger the clearance width, the faster the process develops, and the pump with larger tip clearance has a less flat cavitation curve at high NPSHA range.
Footnotes
Academic Editor: Yangmin Li
Declaration of conflicting interests
The author(s) declared no potential conflicts of interest with respect to the research, authorship and/or publication of this article.
Funding
The author(s) disclosed receipt of the following financial support for the research, authorship and/or publication of this article: This project is supported by the Tsinghua University Initiative Scientific Research Program (Grant number 2014z21041), the Beijing Natural Science Foundation (Grant number 3164045) and the National Natural Science Foundation of China (Grant numbers 51579006, 51679122).