
Abstract
Rectangular section parts created through hydroforming have good application prospects in the automotive industry because of their advantages of simple manufacturing procedure, high forming quality, and greater bending module than circular cross-sectional parts. Forming quality is directly influenced by the formed corner parameters of rectangular section parts. It is also a difficult matter in rectangular section hydroforming. The hydroforming rules of an aluminum alloy circular tube are regarded as the research object in this study to investigate the rules of square cross-sectional parts in the hydroforming process. First, the mechanical parameters of the molding material are obtained through experiments. Second, a hydroforming experimental system is self-designed, and tube hydroforming without axial feed is investigated to determine the key parameters of tube forming. Simulation analysis is then conducted for the entire process of tube hydroforming using the nonlinear finite element software DYNAFORM. The finite element model and the correctness of the calculation method are verified by comparing their results with the experimental results. Thereafter, the influence of internal pressure, friction coefficient, and loading path on pipe forming quality is examined. Necessary references are provided for engineering applications.
Introduction
With the rapid development of the aviation and automobile industries, more and more people are beginning to focus on reducing structural weight to reduce energy consumption. 1 In the premise of vehicle safety, creating hollow structural parts through hydroforming technology can reduce body weight, save on materials, and save on energy; the process is also environment friendly and highly efficient. 2 Owing to these and other advantages, hydroforming has become the foundation of the production of lightweight hollow structures and non-alternative manufacturing techniques. 3 In the case of similar wall thickness and perimeter, the flexural modulus of rectangular cross-sectional hollow parts is greater than that of circular cross-sectional parts. 4 Therefore, rectangular cross-sectional parts are widely used in the automotive industry; such parts produced through hydroforming have also become the focus of automotive professionals.3,4 Tube hydroforming is a complex forming process. The tube is regarded as blank, and by the combined effects of applying a high-pressure fluid and axial force to feeding on the tube, the tube is pressed into a mold cavity and bulges into the desired components. 5 YP Korkolis and S Kyriakides 6 presented an experimental investigation of hydroforming of Al-6260-T4 tubes and a simple two-dimensional (2D) model of the process. Localized wall thinning was reported to occur at mid-span which, accentuated by friction, led to burst. The problem of corner forming is one of the key issues in research on rectangular cross-sectional part manufacturing through hydroforming. Recently, an increasing number of professionals have explored how to improve forming quality. For example, R Hashemi et al. 7 used the inverse finite element method (IFEM) together with an extended strain-based forming limit diagram based on Marciniak and Kuczynski (M–K) theory to develop a fast approach for the estimation of the initial tube length, axial feeding, and fluid pressure in tube hydroforming. The results indicate that IFEM can be used as a quick tool to estimate process parameters in tube hydroforming. CI Kim et al. 8 determined the forming conditions, including wrinkling, buckling, and folding limits influenced by the loading path. The maximum expansion in the circumferential direction occurred in the pure shear forming mode before the internal pressure reached its maximum. In the wrinkling limit, both Hill’s yield criterion and Hosford’s yield criterion demonstrated consistency with the experimental results. However, compared with Hill’s yield criterion, Hosford’s yield criterion provides a better estimate for the bursting limit. G Liu et al. 9 investigated the stress distribution and deformation pattern of a corner through mechanical analysis and numerical simulation. They found that the material in the transition region much more easily satisfies plastic yielding conditions and produces compressive strain through the thickness. A Nader et al. 10 introduced an optimization method combined with finite element analysis that employed forming limit diagrams as a failure prediction tool. The forming profiles developed through the optimization procedure were used to successfully hydroform multiple tubes for all materials without any rupture or wrinkling. C Nikhare et al. 11 compared high- and low-pressure tube hydroforming for the square cross-sectional geometry. The conclusion was that the internal pressure and die closing force required for low-pressure tube hydroforming is much less than that required for high-pressure tube hydroforming. SJ Yuan et al. 12 developed a new double-sided tube hydroforming setup and investigated the wrinkling behavior of thin-wall tubes under the combined action of internal and external pressures. They found that wrinkling behavior does not depend on external pressure for the constant pressure difference. XH Xu et al. 13 studied the thickness distribution along the cross-section of a square-sectional hydroformed part and explored the effects of the friction coefficient, strain-hardening exponent, and anisotropic coefficient on the thickness distribution and variation regularity of wall thickness. XL Cui et al. 14 investigated the effect of external pressure on the formability of a tube in double-sided hydroforming in a square-section die. The conclusions revealed that the external pressure applied on the tube’s outer surface can increase the deformation ability of the transition zone in double-sided tube hydroforming in a square-section die.
Rectangular section parts continue to be created through hydroforming because of the advantages of light weight, high precision, good mechanical properties, and low production cost. Thus, this process has good application prospects in the fields of aerospace, automotive industry, and so on. The change in wall thickness is related to the qualities of hydroforming parts, and wall thinning can result in burst. A negative effect is exerted on strength and fatigue resistance and even affects the qualification and service life of the assembly. 9 Thus, in this study, the thickness of an aluminum alloy circular tube produced by hydroforming is regarded as the research object.
The stress–strain curves of the aluminum alloy material are obtained through experimental tests. With the aid of self-developed hydroforming experimental test systems, experimental research on rectangular section aluminum tube hydroforming is conducted. Simulation analysis of the entire process of tube forming is also conducted with the aid of a nonlinear finite element software. The effect of varying internal pressure, friction coefficient, and loading path on the forming tube’s wall thickness is investigated.
Experimental test
Mechanical parameter test
To determine the mechanical properties of the 6063-T6 aluminum alloy, a mechanics tensile test was conducted for the experimental material. First, the stress–strain curves of the material were obtained. According to the standard of test specimens (shown in Figure 1(a)), 15 the sample was cut directly along the axial direction of the tube (shown in Figure 1(b)).

Standard tubular tensile specimens: (a) tensile specimen size and (b) tensile specimens.
Second, a universal electronic drawing machine (SANS-CMT6104) and an extensometer were utilized for a specimen tensile test. The extensometer’s gauge length was 50 mm, the strain rate was 0.002 s−1, and the environment temperature was 20°C. The experimental test results are shown in Figure 2. The yield and tensile strengths of the material are 224 and 255 MPa, respectively.
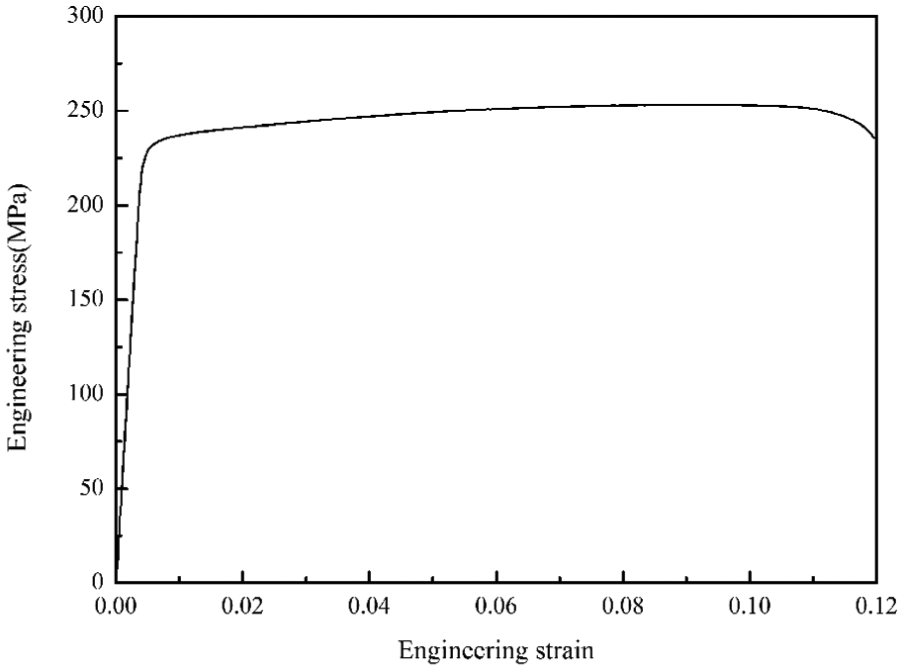
Engineering stress–strain curve of the tube material.
The result of the experimental is the engineering stress–strain curve. However, during the numerical simulation analysis, the material parameters adopted real stress–strain relations. The volume change in the material during plastic deformation was ignored. According to the experimental test results, Formulas (1) and (2) were utilized to convert the experimental test engineering stress–strain data into true stress–strain data. 16 The stress–strain curve of the aluminum alloy employed in this study is shown in Figure 3. The figure shows that the material’s yield strength and elastic modulus are 224 MPa and 60 GPa, respectively


where

True stress–strain curve of the tube material.
Hydroforming test
To explore the rectangular cross-sectional hydroforming part’s thickness distribution around the corners, we designed and developed a hydroforming experimental system. The principle of the test system is shown in Figure 4(a). The experimental test system includes a handheld booster pump, a pressure gauge, a high-pressure hose, sealing ends, a mold, a die spotting machine, and cushion valves. The hydraulic oil is pressurized by the hand pump and then flows through the pressure gauge, high-pressure hose, and the seal. The bulging tube is then put into action. The die spotting machine clamps and ensures the tight closure of the upper and lower molds in the entire hydroforming process. The handheld hydraulic booster pump provides the necessary bulging pressure for the system with oil as the medium; the pump comes with pressure relief devices, and the maximum pressure provided by the pump is 70 MPa. The range of the pressure gauge is 0–70 MPa. The gauge is installed between the handheld booster pump and the mold to measure the pressure in the entire system. The high-pressure hose is connected to each member by a threaded connector. The die spotting machine is for upper and lower mold clamping to ensure that the lower mold is closed tightly in the entire process of bulging. The maximum clamping force is 600 kN. The manufactured test system and its principles are shown in Figure 4(b).
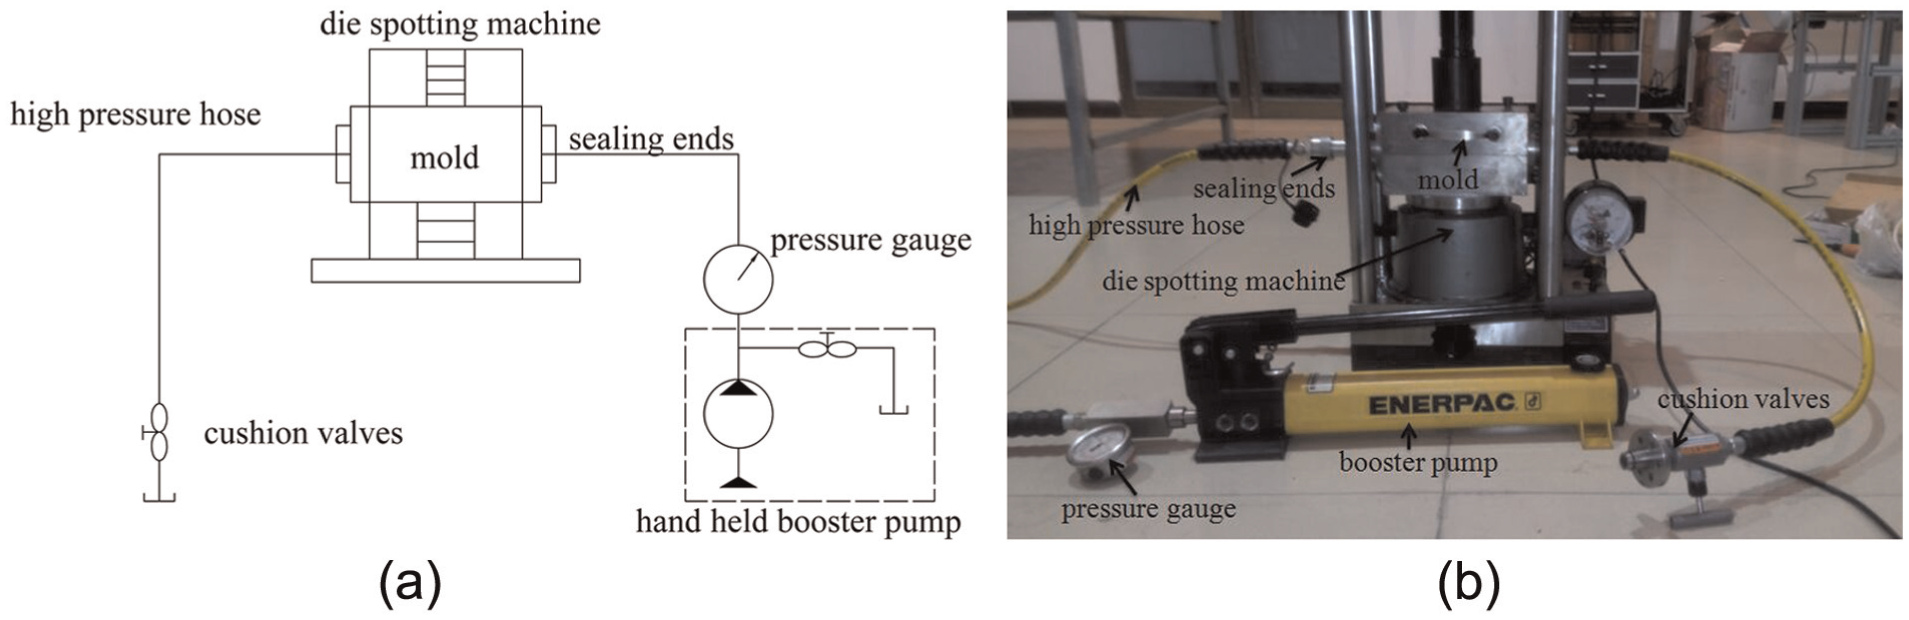
Experimental setup developed for this study: (a) principles of the test system and (b) test system.
The geometry of the mold cavity is shown in Figure 5. The total length of the mold cavity is 200 mm. The length, width, height, and fillet radius of the bulging zone are 100, 42, 36, and 6 mm, respectively. The perimeter of the rectangular cross-section in the mold bulging area is 145.12 mm. The mold is made of Cr12MoV steel. The mold possesses a positioning pin to be used for positioning in the clamping process (shown in Figure 6). This experimental system contains no axial feed device, so bolt seal ends are utilized to seal the system (shown in Figure 7). In the interior of the seal ends, a rubber sealing ring is combined with a truncated cone to seal the system. After tightening the bolt, the desktop cone tip achieves an interference fit with the tube to improve the sealing effect. The material of the seal ends is DC53 steel. The maximum clamping force of this experimental system is 600 kN, and the maximum available bulging pressure is approximately 70 MPa. The selected tube material is aluminum alloy. The initial external diameter is 40 mm, the length of the tube is 175 mm, and the thickness is 1.9 mm. The tube’s bulging rate is 15.92%, as obtained by calculation.
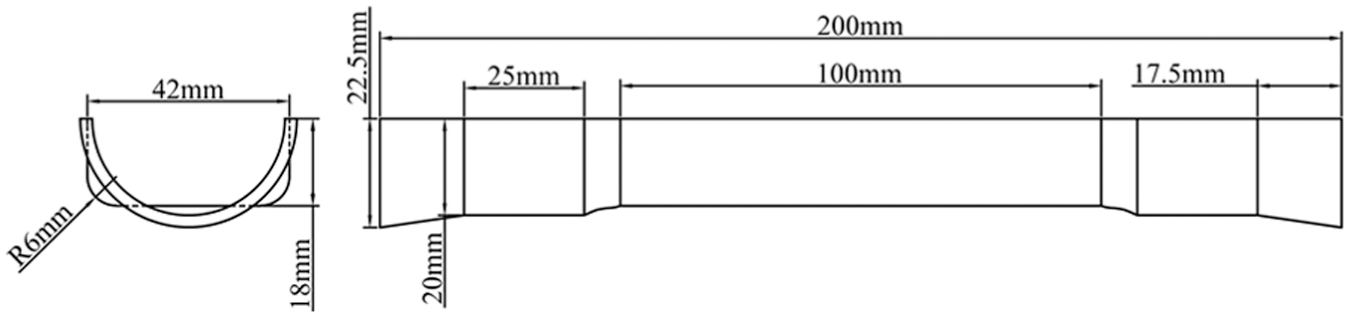
Drawings of the hydroforming die: (a) side view and (b) plan view.

Photograph of the experimental mold.

Seal end of the hydroforming die: (a) dimensions of the seal end (unit: mm) and (b) photograph of the seal end.
During the experiment, the die spotting machine clamps the upper and lower molds. The machine sustains compression after tight closure of the upper and lower molds. In this case, the handheld booster pump is utilized to increase the pressure of hydraulic oil. The hydraulic oil flows through the pressure gauge and high-pressure hose and reaches the bulging pipe inside the mold. Gas is then exhausted from the system through the cushion valve. The cushion valve is shut down after gas discharge. The handheld booster pump presses on the hydraulic oil to reach a predetermined pressure. The system pressure is determined with the pressure gauge. The die spotting machine ensures that the die is tightly closed in the entire hydroforming process. The pressure relief valve of the handheld booster pump is opened after the bulging process to release the pressure of the test system.
The equipment mentioned above and the mold were used to conduct the tube hydroforming test, and no fluid pressure action occurred during the die closing process before the corner filling process. The formed parts with different internal pressures of 30, 35, 40, and 45 MPa are shown in Figure 8. Figure 8(a) shows that at an internal pressure of 30 MPa, a large difference exists between the part corner radius and the mold cavity fillet radius. The fillet radius of the hydroformed tube is greater than that of the mold’s rounded corners obviously. The area of tube contact with the die is small in the bulging area. The tube–die contacting rate during the fillet filling process is the ratio of the length of the specimen L to the length of the straight edge of the die L0 (shown in Figure 10(b)). Thus, the tube–die contacting rate is low in the bulging area. When the internal pressure is increased to 35 MPa, the tube–die contacting rate in the bulging increases. In addition, the fillet radius is reduced (shown in Figure 8(b)). At an internal pressure of 40 MPa, the flat surface area of the hydroformed tube becomes larger than that before, so the rate of tube–die contact is significantly higher than that in the first and second experiments; the fillet radius is also smaller (shown in Figure 8(c)). As the internal pressure continues to increase to 45 MPa, the rate of tube attachment to the die and the size of the fillet radius are roughly similar to those under an internal pressure of 40 MPa (Figure 8(d)). These test results show that as the internal pressure increases, the rate of tube–die contact gradually increases and the fillet radius of the formed tube decreases. When the internal pressure exceeds 40 MPa, the test result of tube bulging remains unchanged, indicating that the tube completed contact with the die at the pressure of 40 MPa.
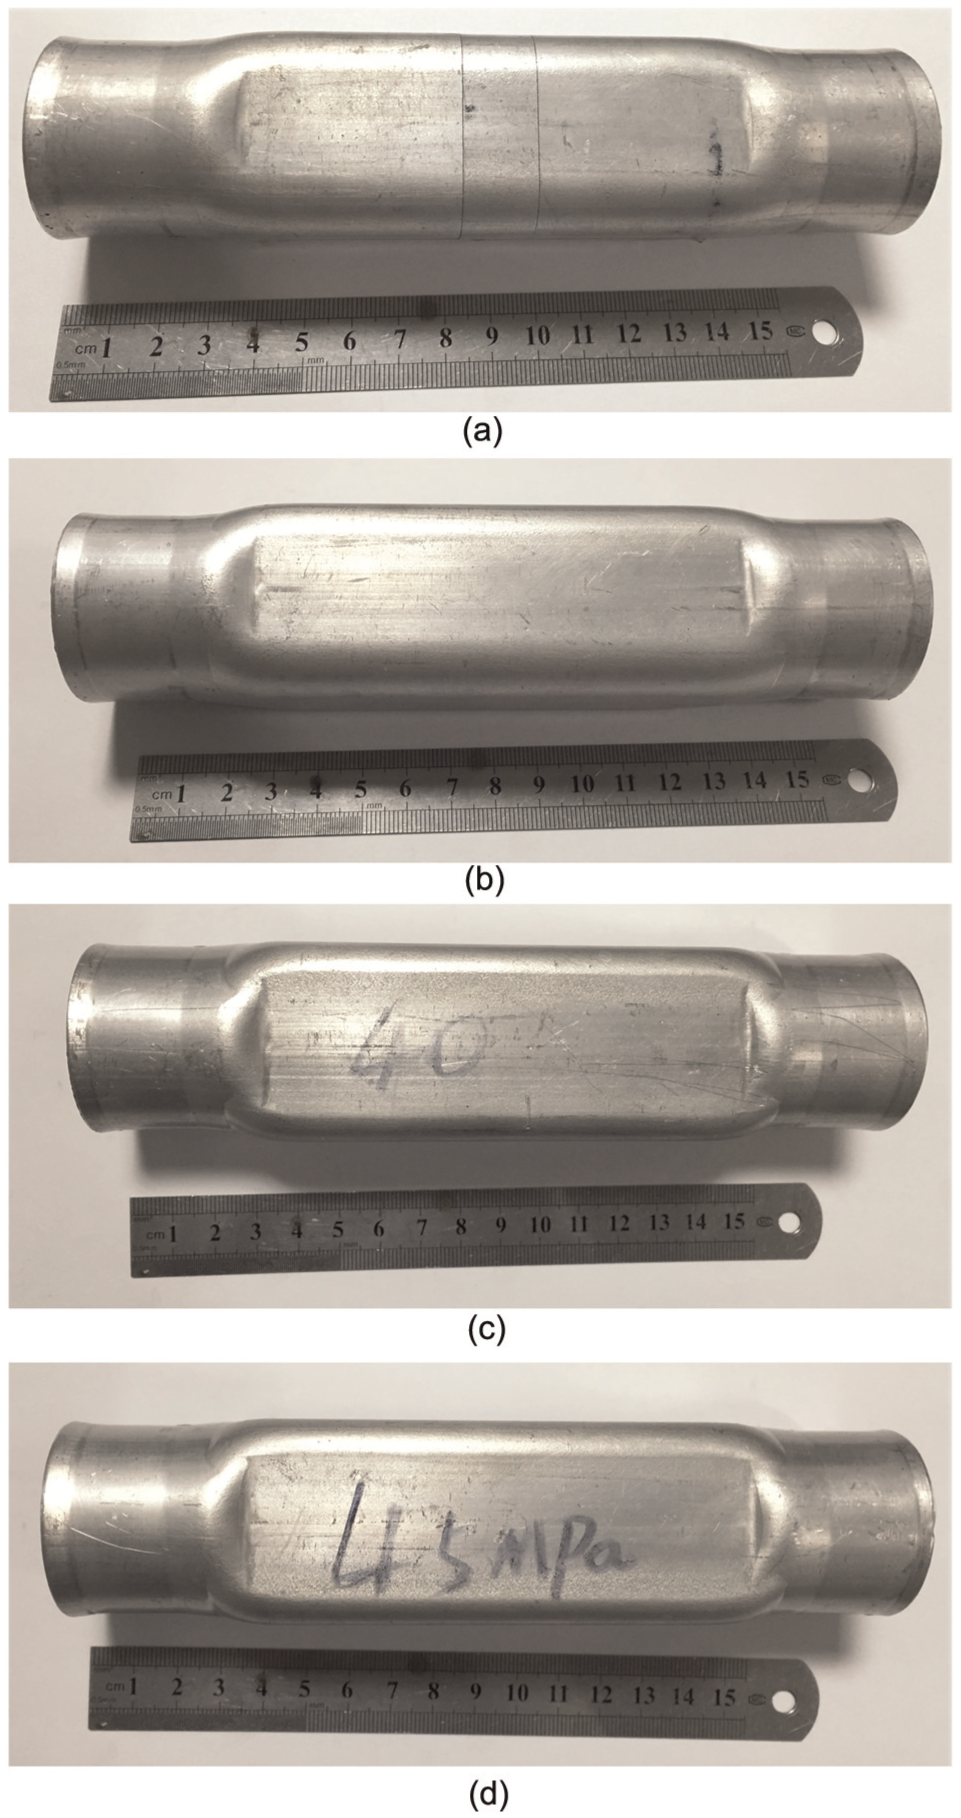
Experiment sample formed through hydroforming: (a) hydroformed tube at a pressure of 30 MPa, (b) hydroformed tube at a pressure of 35 MPa, (c) hydroformed tube at a pressure of 40 MPa, and (d) hydroformed tube at a pressure of 45 MPa.
The fillet radius of the rectangular cross-sectional die is R = 6 mm. The radial and axial cross-sections of the tube in the bulging area at an internal pressure of 45 MPa are shown in Figure 9. To study the thickness distribution of the hydroformed tube at an internal pressure of 45 MPa, 13 measurement points were selected in a quarter of the rectangular cross-section as the research object. The distance between two adjacent measuring points was approximately 3 mm (shown in Figure 9(a)). The thickness distribution of the hydroformed tube at an internal pressure of 45 MPa is shown in Figure 9(c). Figure 9(c) shows that wall thickness decreases gradually from the midpoint of the straight edge (point 1 to point 5) and then begins to increase when the thickness is reduced to a certain degree. The thinnest area is in the transition zone between the straight edge and the corner (points 5 and 10).
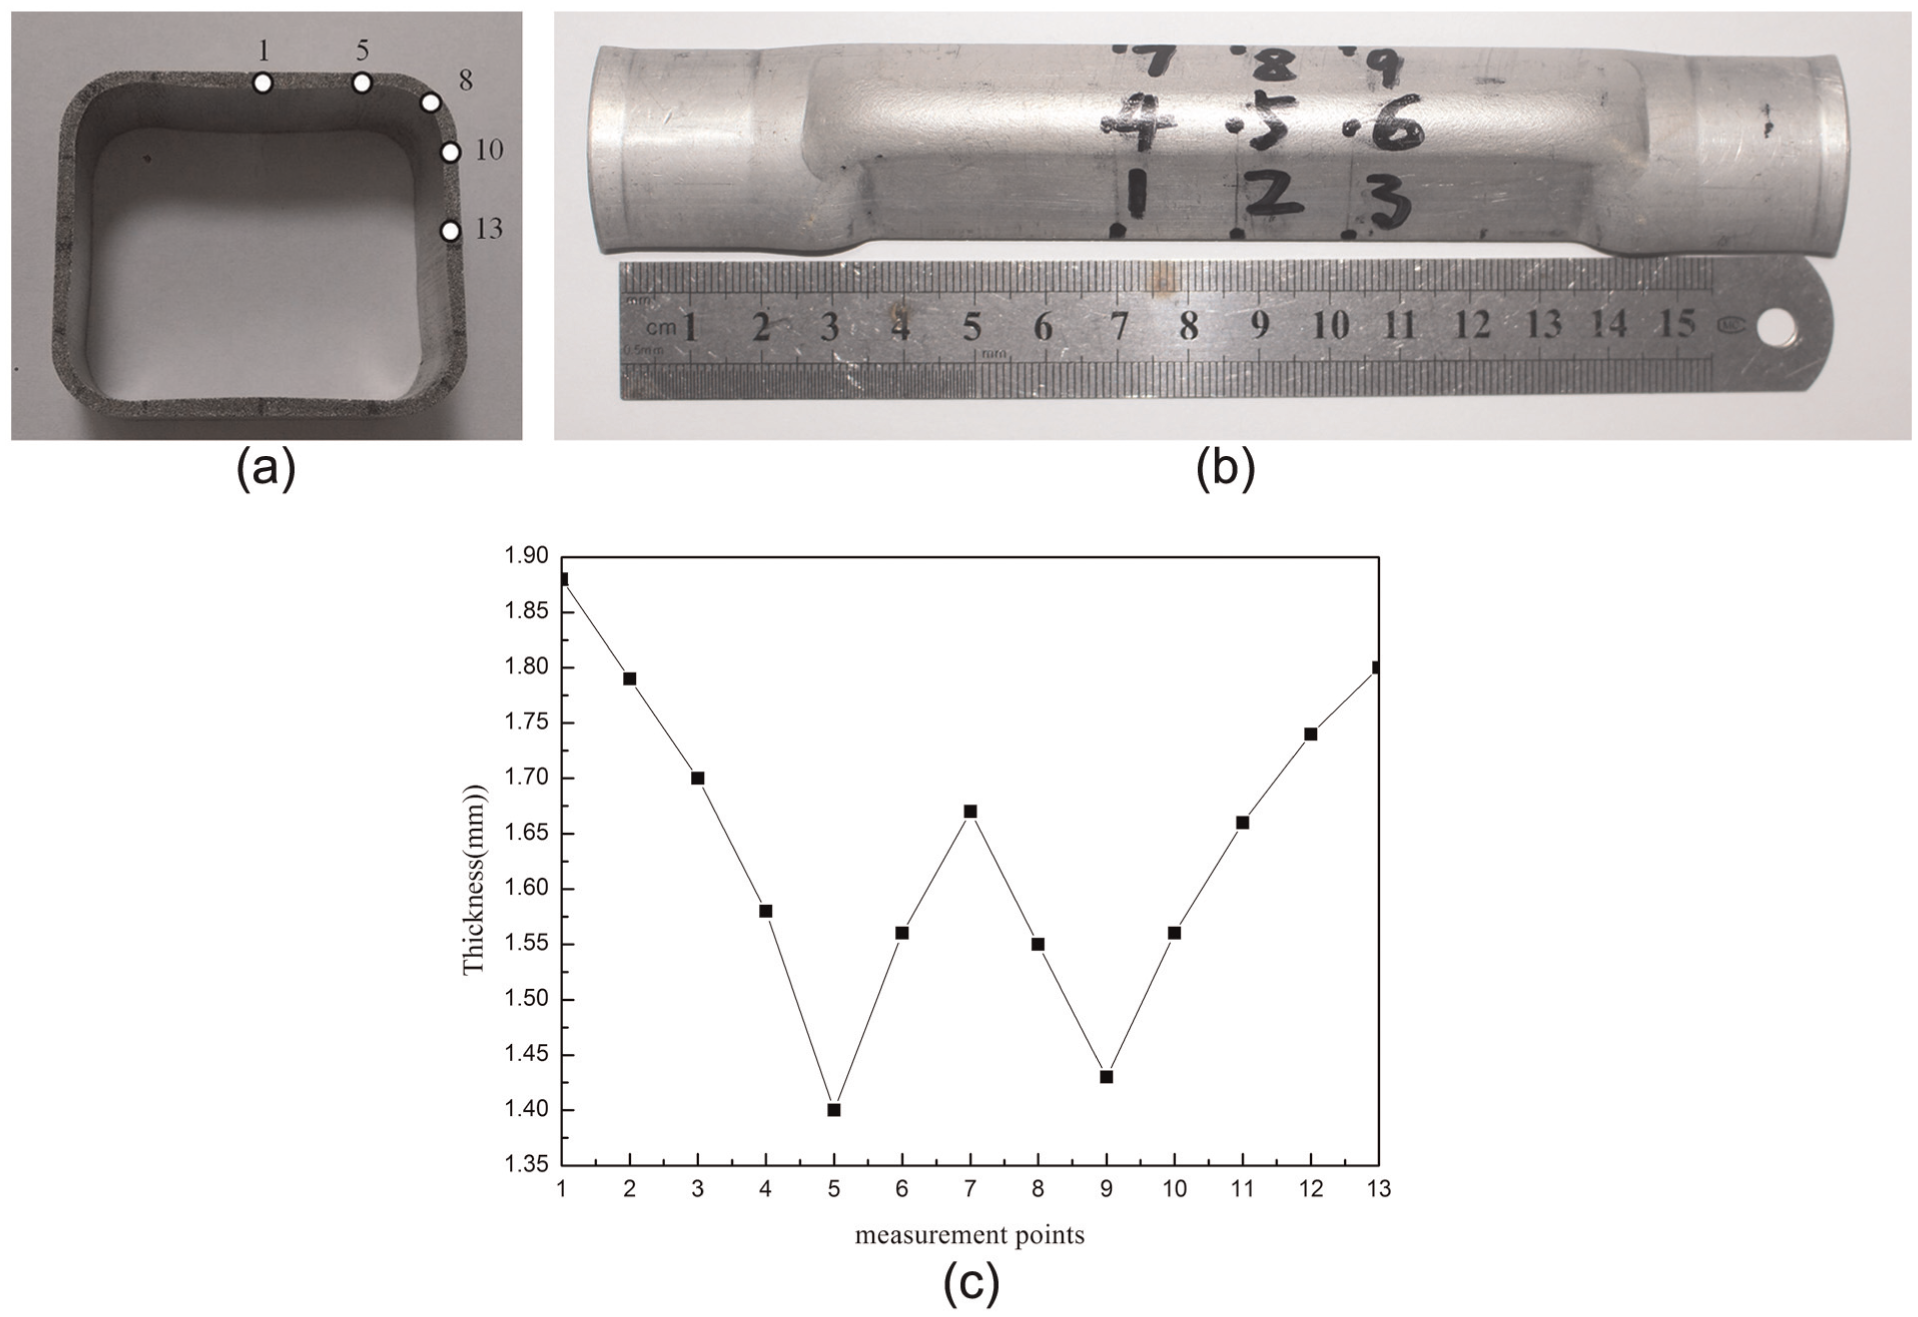
Bulging test results for pressure of 45 MPa: (a) measurement points in the radial section of the hydroformed tube, (b) axial section of the hydroformed tube, and (c) thickness distribution of the hydroformed tube at an internal pressure of 45 MPa.
The change in fillet radius in the process of bulging is shown in Figures 10 and 11. At an internal pressure of 30 MPa, fillet radius R = 10.2 mm (Figure 10(a)). At an internal pressure of 35 MPa, fillet radius R = 8.9 mm (Figure 10(b)). When the internal pressure is 40 MPa, fillet radius R = 6 m (Figure 10(c)). The fillet radius decreases as the bulging pressure increases. When the internal pressure increases from 40 to 45 MPa, the fillet radius of the bulging tube is similar to that of the die.

Fillet deformation as the inner pressure increases: (a) fillet deformation at 30 MPa, (b) fillet deformation at 35 MPa, and (c) fillet deformation at 40 MPa.

Relationship between internal pressure and corner radius.
When the contact between the tube and die cavity is completed, the fillet radius of the bulging tube no longer increases with the increase in internal pressure (Figure 10(c)).
Numerical analysis
Finite element model
To conduct in-depth and systematic research on the hydroforming law of the rectangular section tube and determine the effect of key parameters in the forming process on tube wall thickness, the nonlinear finite element software DYNAFORM was utilized to simulate and analyze the entire process of tube forming. A finite element model of tube hydroforming was created according to the experimental conditions. The finite element model includes upper die, lower die, and original fittings of three parts. Only the surface of the experimental mold was defined; it was then set as a rigid body. The finite element model is shown in Figure 12. The materials of the tube have already been defined in the results of the tensile test parameters. During simulation, friction coefficient µ = 0.1, 0.12, 0.15, 0.17, and 0.20 was selected. The final bulging pressure was P = 45 MPa. The loading path is shown in Figure 13.

Finite element model of the tube and die.

Loading path.
Comparison of experimental and simulation results
To verify the accuracy of the simulation, the hydroforming parts formed at a pressure of 45 MPa were selected as the research object. Given that the hydroforming parts exhibit axial symmetry, a quarter of a hydroforming tube was selected as the research object in the axial direction. Nine measurement points in the bulging area were selected (shown in Figure 9(b)). The thickness of the nine measurement points for different coefficients of friction was determined and compared with the experiment results (Figure 14). Figure 14 shows that when the friction coefficient is 0.17, the simulation results are in good agreement with the experimental ones. Thus, friction coefficient µ = 0.17 was selected in this study.
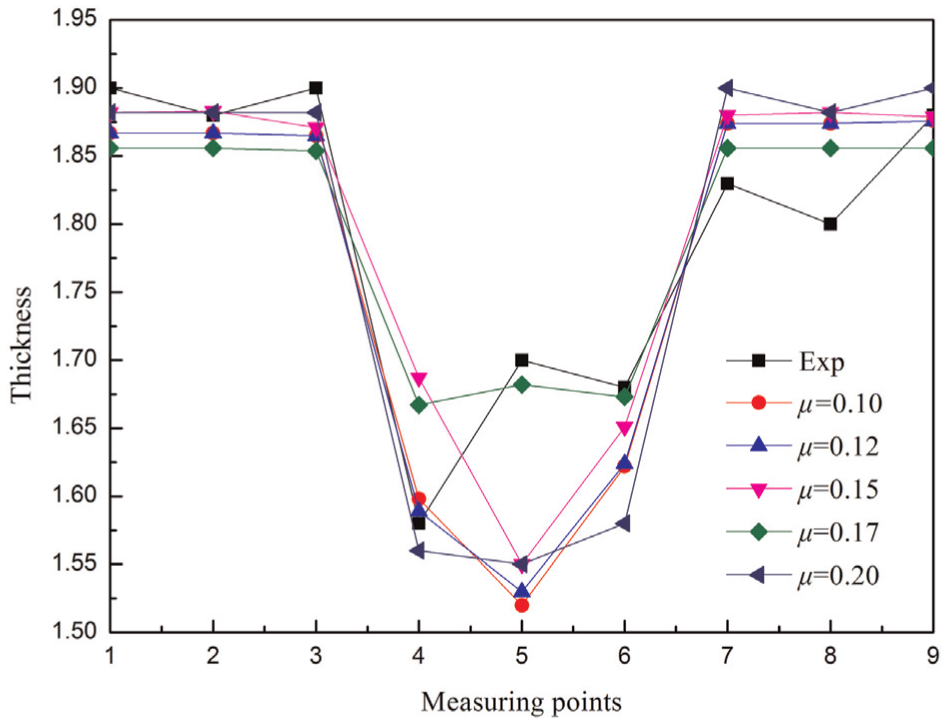
Predicted thickness of nine measurement points for different coefficients of friction and comparison with the experiment values.
The experimental and simulation results were then compared, and the results are shown in Table 1. The numerical simulation results (µ = 0.17) and experimental results are basically consistent; the maximum error is 5.56%, thereby proving that the finite element model, material experimental tests, and numerical simulation analysis are correct.
Error between experimental and simulation results.

FEM: finite element method.
Result of numerical calculation
The wall thickness and principal strain distribution of the rectangular cross-section are shown in Figure 15. The maximum wall thickness was observed near the midpoint of the straight edge of the entire cross-section, but the principal strain in this area is minimal. The rectangular cross-section of the midpoint in the axial direction of the bulging area was regarded as the research object. A total of 110 measuring points were obtained along the circumference direction, and the distance between two adjacent measuring points was approximately 1.32 mm. The distribution of the measuring points is shown in Figure 16.

Thickness and main strain distributions at an internal pressure of up to 45 MPa: (a) distribution of thickness and (b) distribution of the main strain.

Distribution of measuring points.
The thickness of each measuring point was measured, and the results are shown in Figure 17. The minimum wall thickness is in the transition zone between the straight edges and the corners. Points 10, 20, 35, 45, 65, 75, 90, and 100 are located in the transition area. The smallest thickness of 1.44 mm is located at point 45. As the measuring point approaches the center of the fillet, the wall thickness gradually decreases; however, the main strain increases. When the thickness reaches a certain value and the wall thickness increases gradually, the main strain decreases. In the center of the fillet wall, the thickness gradually decreases and the principal strain increases gradually; however, the degree is less than the transition area. This result proves that the maximum principal strain occurs in the transition zone between the straight edge and corner in the process of rectangular cross-sectional part hydroforming. In this location, thickness reduction is the most serious. In the hydroforming process of rectangular cross-sectional parts, the phenomenon of excessive thinning or rupture first appears in the transition area.
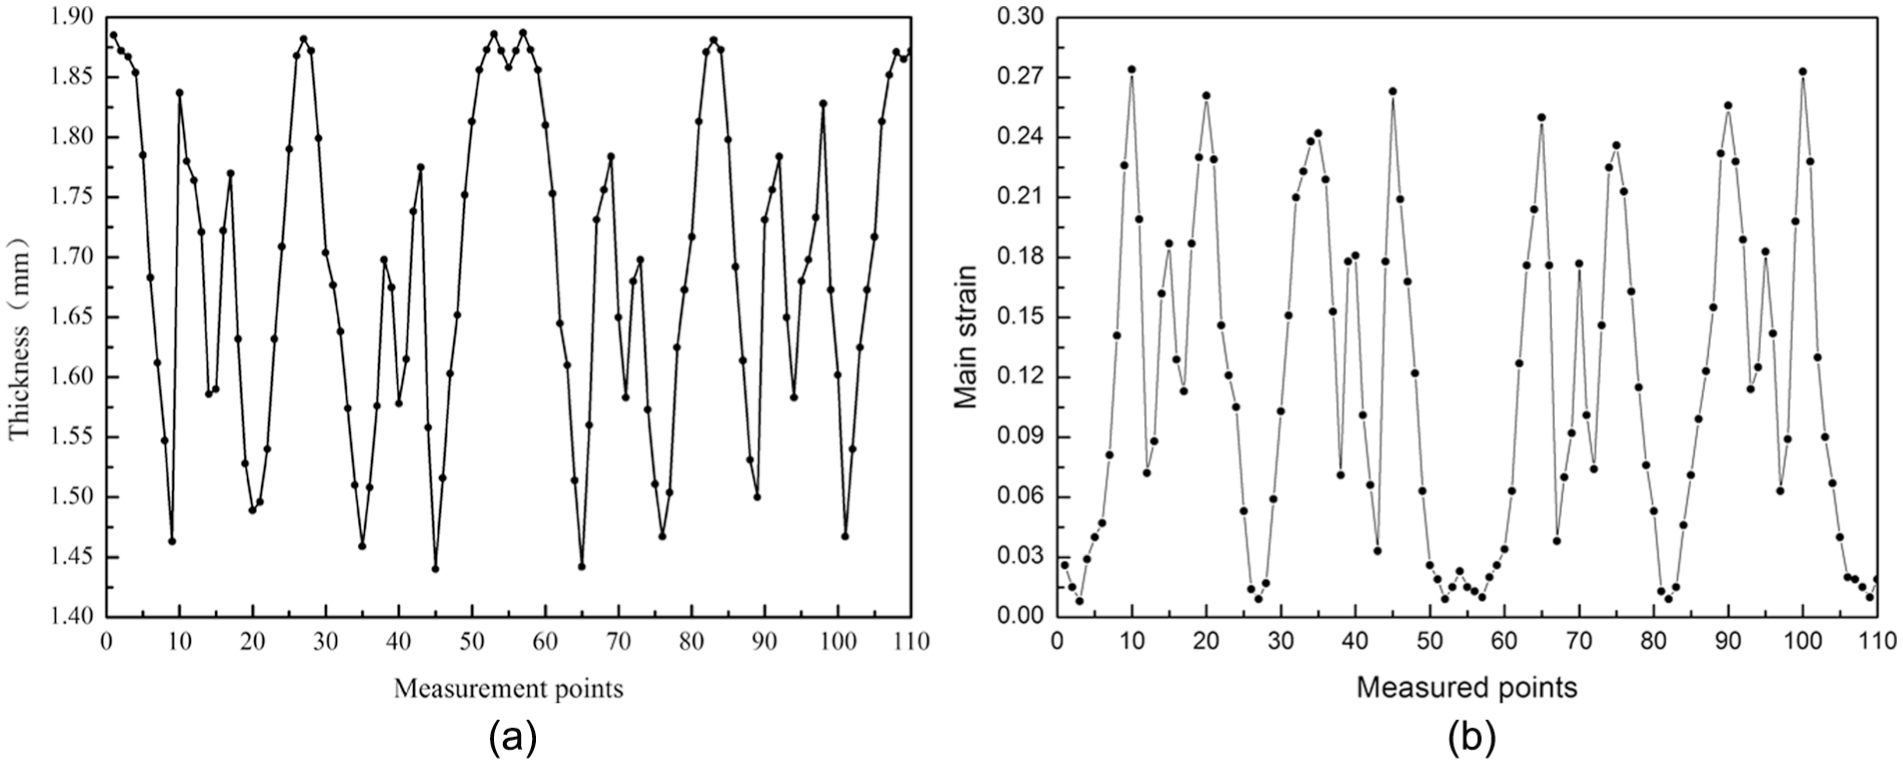
Thickness and main strain distributions around the perimeter of the hydroformed tube at a pressure of 45 MPa: (a) distribution of thickness and (b) distribution of the main strain.
The phenomenon of wall thinning also appears in the center of the corner, but the thinning degree is smaller than that in the transition zone. This is because the tube here is subjected to compressive stress at the final stage of the crushing process, whereas it is subjected to tensile stress during the expansion process. 17 Hence, this area is not a priority in this study.
Results and discussion
Owing to the internal pressure, the friction coefficient and the load path exert a significant effect on the quality of hydroforming. Thus, a quarter of the rectangular cross-section was selected as the research object to study the distribution of thickness as influenced by the key parameters in the hydroforming result. In all, 22 measurement points on the selected object were obtained; the distance between two adjacent points was approximately 1.64 mm. The distributions of the measuring points are shown in Figure 18.

Distribution of the measurement points.
Effect of internal pressure
To study the thickness distribution of the hydroforming parts as influenced by different internal pressures, we selected the internal pressures of 25, 30, 35, 40, and 45 MPa acting on the tube. The linear loading time is t = 3 s, and the friction coefficient is µ = 0.17. The effects of different internal pressures on the thickness distribution after tube expansion in a square die are shown in Figure 19. The figure shows that the curves of wall thickness distribution under different pressures are approximately symmetric, and the symmetry axis fillet is at the centerline. The obvious effect of inner pressure on thickness distribution is as follows: thickness is significantly reduced with the increase in internal pressure, especially in the transition zone between the straight edge and the corner. This finding further illustrates that the equivalent stress gradually increases from the midpoint of the straight border to the transition point. At the transition point, the equivalent stress reaches its maximum. Thus, the transition region between the straight edge and corner is most likely to meet the conditions of plastic yield dramatic thinning. 18 Meanwhile, with the increase in internal pressure, the transition zone moves to the rounded center. This phenomenon shows that with the increase in internal pressure, the fillet radius continues to decrease. Thereafter, the rate of tube–die contact increases. Wall thinning occurs at the midpoint of the fillet, but the degree of thinning is less than that in the transition zone. Hence, it is not the focus of this research.
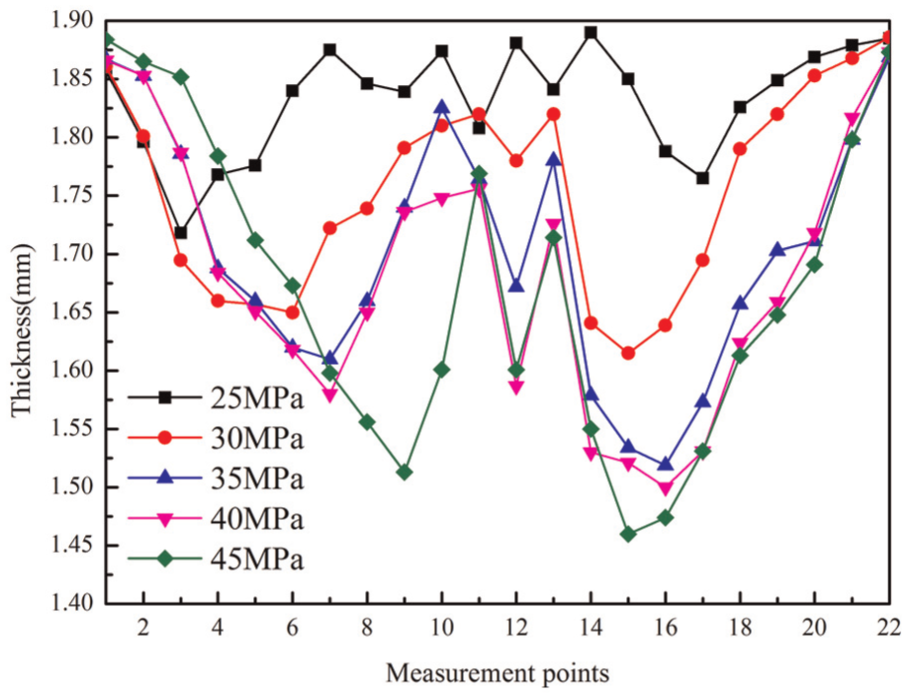
Effect of internal pressure on wall thickness.
Effect of friction coefficients
The friction of the contact surface of the tube and die affects the flow ability of the material and subsequently affects the hydroforming part thickness. 19 To explore the influence of friction on the thickness of the fillet, the coefficient of friction was selected as a variable in this study. The other parameters were kept constant, except for the fixed internal pressure of P = 45 MPa of linear load paths, to study the wall thickness distribution near the corner area for friction coefficient µ = 0.10, µ = 0.15, µ = 0.20, and µ = 0.25 as well as other conditions. The influence of the friction coefficient on the thickness of the fillets is shown in Figure 20. The chart indicates that friction coefficient µ has a significant effect on the wall thickness of the formed part, especially in the transition region. The smaller the friction coefficient, the more uniform the thickness distribution near the angle. The thinning degree in the transition zone is significantly higher than that in the other regions with the increase in friction. In the transition zone, with the increase in the friction coefficient, the degree of thinning of wall thickness increases, thereby illustrating that the friction in the contact surface between tube and die directly affects the thickness of the fillet. With an increase in friction, the thinning degree in the transition zone increases. The phenomenon of excessive thinning and crack appearance are easily introduced. In the center of the corner, the wall thinning degree increases with the decrease in the friction coefficient. Given that the maximum stress is located in the transition area in the process of hydroforming, the deformation in the transition area is the most serious. As friction increases, the liquidity of the material decreases, and the material flow to the transition area decreases; hence, wall thickness thinning in the transitional area is serious. 20

Effect of friction on the wall thickness of the hydroformed tube at a pressure of 45 MPa.
Effect of load paths
The metal-forming process is nonlinear, so in the process of hydroforming, different load paths affect the normal stress, which suppresses the material flowing into the transition zone, thereby affecting the thickness distribution.20,21 We analyzed the trend of thickness distribution around the fillet under the influence of load paths. Fixation pressure P = 45 MPa, loading time t = 3 s, and friction coefficient µ = 0.17. The effect of three different load paths on wall thickness near the corner was also analyzed. The load paths are shown in Figure 21. Path 1 is a linear loading path, and paths 2 and 3 exhibit a high pressure fluctuation rather than a smooth linear load.22,23 In load path 2, pressure increases rapidly in the early stage and then increases gradually in the late stage. In path 3, the pressure increases more gradually in the early stage than in the late stage. The simulation results are shown in Figure 22. In the transition area, the effect of loading path on the wall thickness of the corner transition area is significant, whereas the effect on other areas is minimal. In load path 3, the degree of wall thinning is relatively small in the rounded transition area. In load path 1, the degree of wall thinning is the maximum in the transition area. In load path 2, the degree of wall thickness of the transition area is between the results of paths 1 and 3. That is, in the forming process, by applying nonlinear loading paths 2 and 3, the degree of wall thinning in the transition zone becomes less than the linear loading paths’ result. In load path 3 in particular, pressure increases slowly in the early stage, and the degree of thinning is at the minimum.
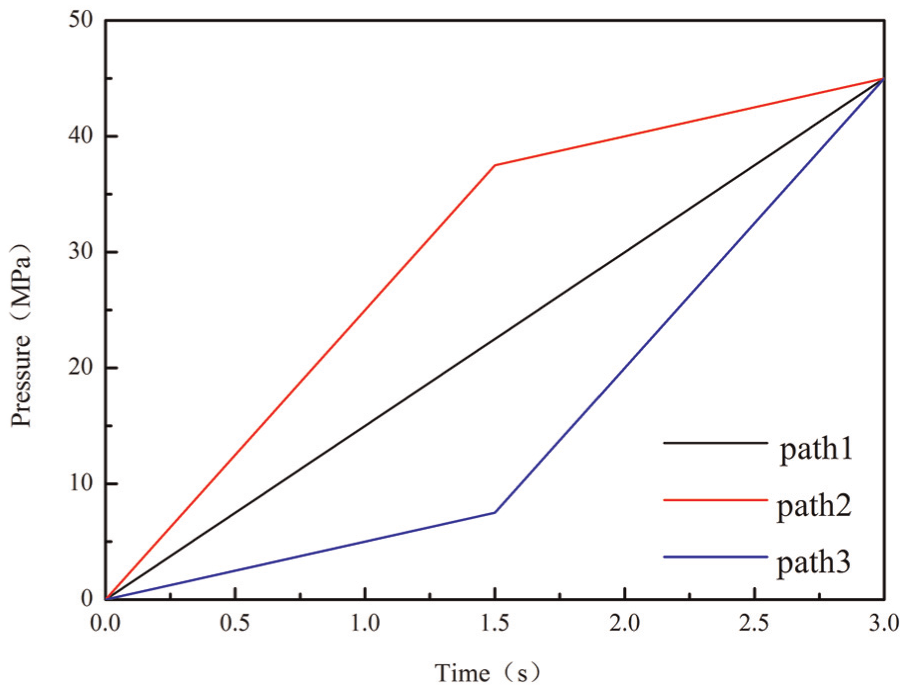
Loading paths.
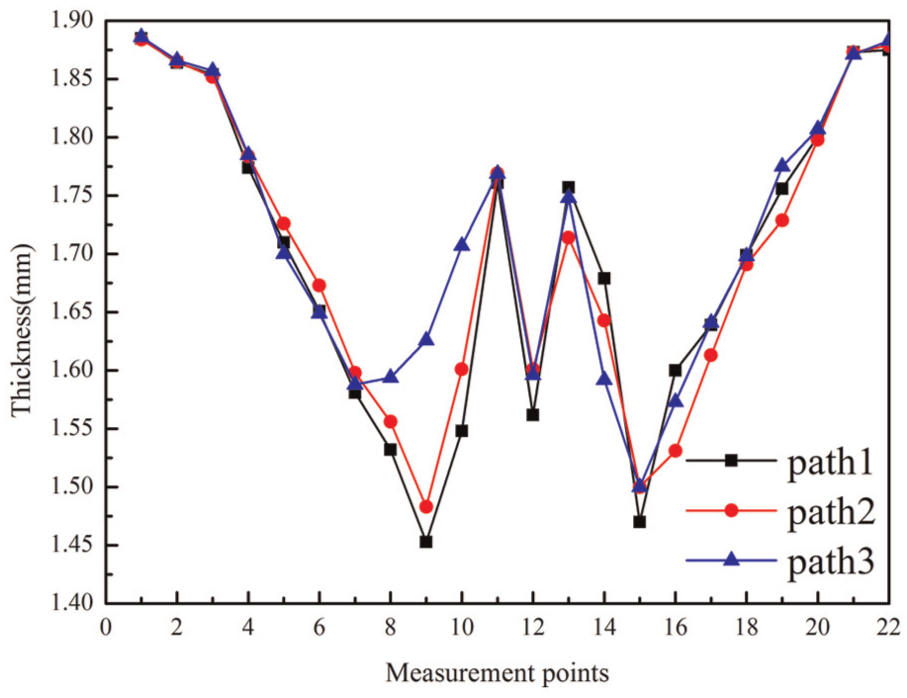
Effect of loading path on the wall thickness of the hydroformed tube at a pressure of 45 MPa.
When a nonlinear load path is applied, especially when the pressure increases slowly in the early stage, the stress in the transition zone is less than that when a linear loading path is applied; the amount of material flowing from the corner and a straight side into the transition zone is also more than that when a linear loading path is applied. Therefore, the degree of wall thickness thinning in the transition zone is small, especially in position 9.
Conclusion
The mechanical parameters of a molding material were obtained through experiments, and an experimental setup was developed. The trend of wall thickness distribution near the corner of an aluminum circular tube hydraulically expanded into a rectangular cross-section was explored through an experimental study combined with numerical simulation. The simulation results showed good agreement with the experimental results at friction coefficient µ = 0.17. The influence of internal pressure, friction coefficient, and loading path on pipe forming quality was also examined.
In the bulging process of the rectangular section aluminum parts, the corner radius decreases gradually and the rate of tube–die contact increases gradually with the increase in internal pressure. When the pressure increases to 40 MPa, the tube completely fits into the mold. In the transition region between the straight edge and corner, the value of wall thickness is the smallest because of the maximum value of equivalent stress in the transition point. In the process of hydroforming, the friction coefficient of the contact face between the tube and the die affects the wall thickness distribution. The degree of thinning around the corner increases with the increase in friction force. Wall thickness near the corner, especially in the transition zone, is significantly influenced by different loading paths. Under a nonlinear loading path, especially when the loading path of the early stage increases more slowly than that in the late stage, the degree of thinning is small in the transition area.
Footnotes
Academic Editor: Xiaotun Qiu
Declaration of conflicting interests
The author(s) declared no potential conflicts of interest with respect to the research, authorship, and/or publication of this article.
Funding
The author(s) disclosed receipt of the following financial support for the research, authorship, and/or publication of this article: This research was supported by the Guangxi Nature Fund (Grant No. 2016JJA160119), the Innovation Project of GuangXi University of Science and Technology Graduate Education (Grant No. GKYC201619), and the Opening Project of Guangxi Key Laboratory of Automobile Components and Vehicle Technology, Guangxi University of Science and Technology (Grant No. 2015KFYB03).