
Abstract
Thermodynamic properties of zeotropic mixtures of R600a/R23/R14 have been investigated and calculated based on the established mathematical model. The deviations of bubble pressure and vapor composition between the simulation results and the experimental data were −0.16% and −1.22% for R600a/R23 and −0.14% and 0.5% for R134a/R23, respectively. The simulation results of R32/R125/R134a were compared with the experimental values of the component, and the average error was 0.31%, and most deviations were within ±5%. The average error in enthalpy value and entropy value between the simulation and National Institute of Standard Technology data was −0.25% and 3.33%, respectively. This suggests that the simulation results meet the requirements of engineering calculation. Based on the experimental results, the thermodynamic properties of the auto-cascade refrigeration system were calculated and analyzed in detail. The pressure–enthalpy diagrams of the auto-refrigerating cascade system with R600a/R23/R14 under the operating conditions were given, and the cycle of this system can be clearly described by the diagram of spatial pressure–enthalpy, which indicates that this simulation program could analyze the system cycle effectively and provide a direction for improvement of the auto-refrigerating cascade system.
Keywords
Introduction
The auto-refrigerating cascade 1 (ARC) system is an important parts in the field of low-temperature refrigeration and has the advantages of simple structure, economy, and energy saving. It can achieve lower evaporation temperature (approximately −40°C to −180°C) compared with conventional refrigeration cycle (approximately−35°C to −5°C) due to the different boiling points of different components. For these reasons, the ARC system has been widely used in fields requiring low-temperature refrigeration, including energy, military industry, space, biology, medical science, and life science.
Research of the ARC system mainly focuses on the optimization design of the system cycle and the optimization of the refrigerant mixture. SG Kim and MS Kim 2 investigate the performance of an auto-cascade refrigeration system using zeotropic refrigerant mixtures of R744/134a and R744/290. M Gong et al. 3 investigate the cooling performance of a dual-mixed-refrigerant refrigeration cycle. Q Wang et al. 4 investigated the performance of auto-cascade refrigerator operating with two vapor–liquid separators and six binary refrigerants (R23/R134a, R23/R227ea, R23/R236fa, R170/R290, R170/R600a, and R170/R600) with a new approach at the temperature level of −60°C. K Du et al. 5 present experimental results on the cycle characteristics of an auto-cascade refrigeration system. The optimization design of the system has achieved remarkable experimental results. For example, J Yu et al. 6 present a novel auto-cascade refrigeration cycle (NARC) with an ejector, and the NARC at low compression ratio has high coefficient of performance (COP) under the stable operation; M Sivaakumar and P Somasundaram 7 analyze the performance and exergic on two different zeotropic mixture combinations of R290/R23/R14 and R1270/R170/R14; the zeotropic mixture of R290/R23/R14 with the mass fraction of 0.218:0.346:0.436 with a COP of 0.253% and 58.5% of exergic efficiency performs well in three stages.
However, the thermal physical properties of refrigerant mixtures and the heat and mass transfer process running in the system are very complex, which involve the characteristics of flow, heat, and mass transfer of the multiple mixed refrigerants. The study on the thermodynamic properties of the mixed refrigerants in the ARC cycle is very limited, and recent literature mostly focuses on the near-azeotropic mixture refrigerant,8–13 and there is no proven theoretical support for the vapor–liquid equilibrium of the zeotropic mixture refrigerant and the calculation of enthalpy and entropy. Therefore, we established mathematical model to calculate the thermodynamic properties of zeotropic mixtures of R600a/R23/R14.
Based on previous experimental research in the ARC systems 14 and the mathematical model, the thermal physical property parameters of ternary mixed refrigerants (R600a/R23/R14) used in ARC system were simulated and calculated. This article focuses on the simulation of the vapor–liquid equilibrium for binary and ternary mixed refrigerants under a certain conditions. The bubble point and the dew point were calculated, and the state of mixed refrigerants under a given temperature and pressure was determined. After this, the corresponding dryness, vapor–liquid-phase components, enthalpy, and entropy can be calculated. Finally, the components of mixed refrigerants during the operation process were analyzed by this model. The system pressure–enthalpy diagram of R600a/R23/R14 was constructed, and the system cycle was described in detail. The thermal physical property model of binary and ternary mixed refrigerants can provide a large number of reliable data for the ARC system and reference for the study on the physical properties of mixed refrigerants.
The mathematical model for calculating physical properties of mixed refrigerants
The equation of state of mixed refrigerant
The physical properties of mixed refrigerant are calculated using the Peng–Robinson (PR) 15 equation of state, which is suitable for the gas phase and liquid phase. The accuracy of the calculation of the gas-phase density is equal to that of the Redlich-Kwong-Soave equation of state, but the accuracy of the calculation of the liquid-phase density is higher. 16 This equation is simpler than the Helmholtz energy mixing equation, 17 which contains only two parameters a and b and can calculate the thermodynamic properties of the refrigerant only using with the critical parameters of the refrigerant and the eccentricity factor. The PR equation of state is given as follows

And the form of the compression factor of the equation is as follows

where
The mixing rules
For the mixed refrigerant, the PR van der Waals co-volume equation is often used for mixing rules for calculation of the two mixed parameter of
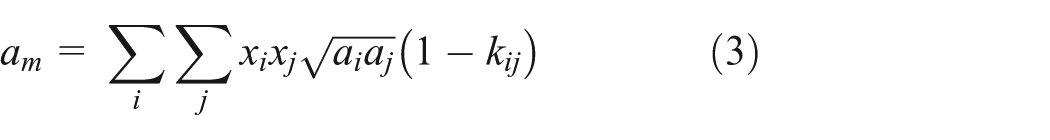
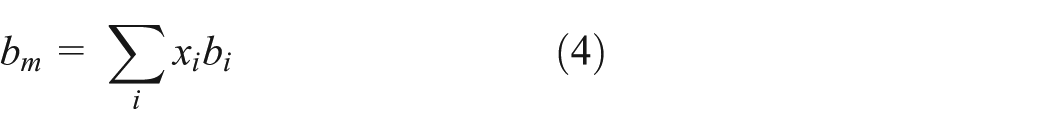
where

where
The solution module of bubble and dew point in the vapor–liquid-phase equilibrium
When the temperature and pressure of the vapor phase and the liquid phase are in equilibrium, the fugacity of each phase component is equal, that is,
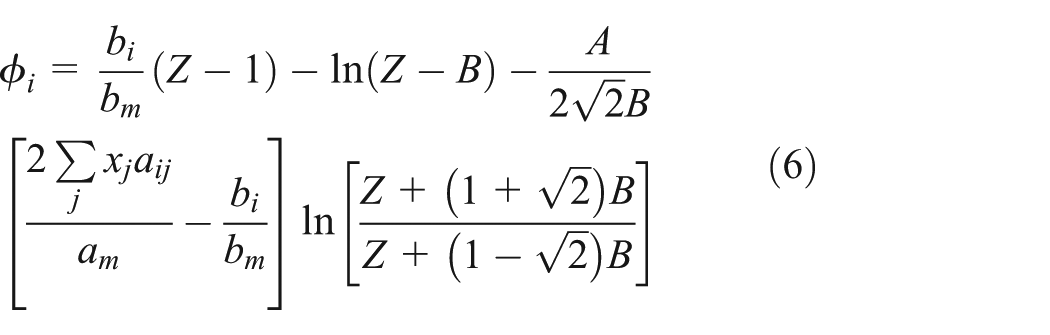

In the calculation of the bubble and dew point, the normalized equations (8) and (9) are needed
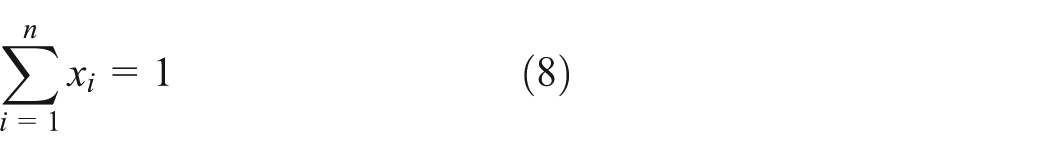

where
In general, there are four types of calculation for the vapor–liquid-phase equilibrium:
The temperature and initial ratio of mixed refrigerants are known, and the corresponding bubble point pressure and gas-phase mole fractions can be calculated.
The temperature and initial ratio of mixed refrigerants are known, and the corresponding dew point pressure and liquid-phase mole fractions can be calculated.
The pressure and initial ratio of mixed refrigerants are known, and the corresponding bubble point pressure and gas-phase mole fractions can be calculated.
The pressure and initial ratio of mixed refrigerants are known, and the corresponding dew point pressure and liquid-phase mole fractions can be calculated.
The solution module of the mole fractions
and
in the vapor–liquid equilibrium
For the auto-cascade refrigeration system simulation and the change of heat transfer equipment simulation and analysis, we need to calculate the physical properties of the mixed refrigerants in the two-phase region. By comparing the bubble point and dew point pressure or temperature, the state of mixed refrigerants can be judged under the given temperature and pressure. If it is in the two-phase region, it is necessary to calculate the fluid quality of the mixture and the gas- and liquid-phase mole fraction
According to equations of state (6), (8), and (9), any physical quantity can be calculated. But for the mixed refrigerants of ternary or more, further supplemental equations and boundary conditions are needed.
Here we introduce the fluid quality

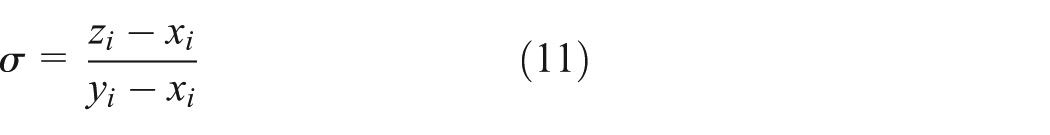
And we derive the supplemental equation

For the ternary mixed refrigerants, take one expression in equation (12) coupling binary vapor–liquid equilibrium equation and constitute a closure equation with certain solution. For the mixed refrigerants has more than three kinds of refrigerants such as N, take N − 1 equations in equation (12) coupling binary vapor–liquid equilibrium equation and constitute a closure equation with certain solution. Thus, the objective function of the fluid quality is as follows

Using Newton’s method to solve the objective functions, we need to take the derivative of objective functions

where
The solution module of enthalpy and entropy of mixed refrigerant
On the basis of the previous module, the enthalpy and entropy of mixed refrigerants are calculated by the residual function method 24 using the obtained mole fraction of each component and dryness of the mixed refrigerants. The expressions for the residual enthalpy and the residual entropy in the PR equation are as follows


Using the enthalpy and entropy of reference points from the International Institute of Refrigeration (IIR) standards, the specific enthalpy and entropy of the saturated liquid are
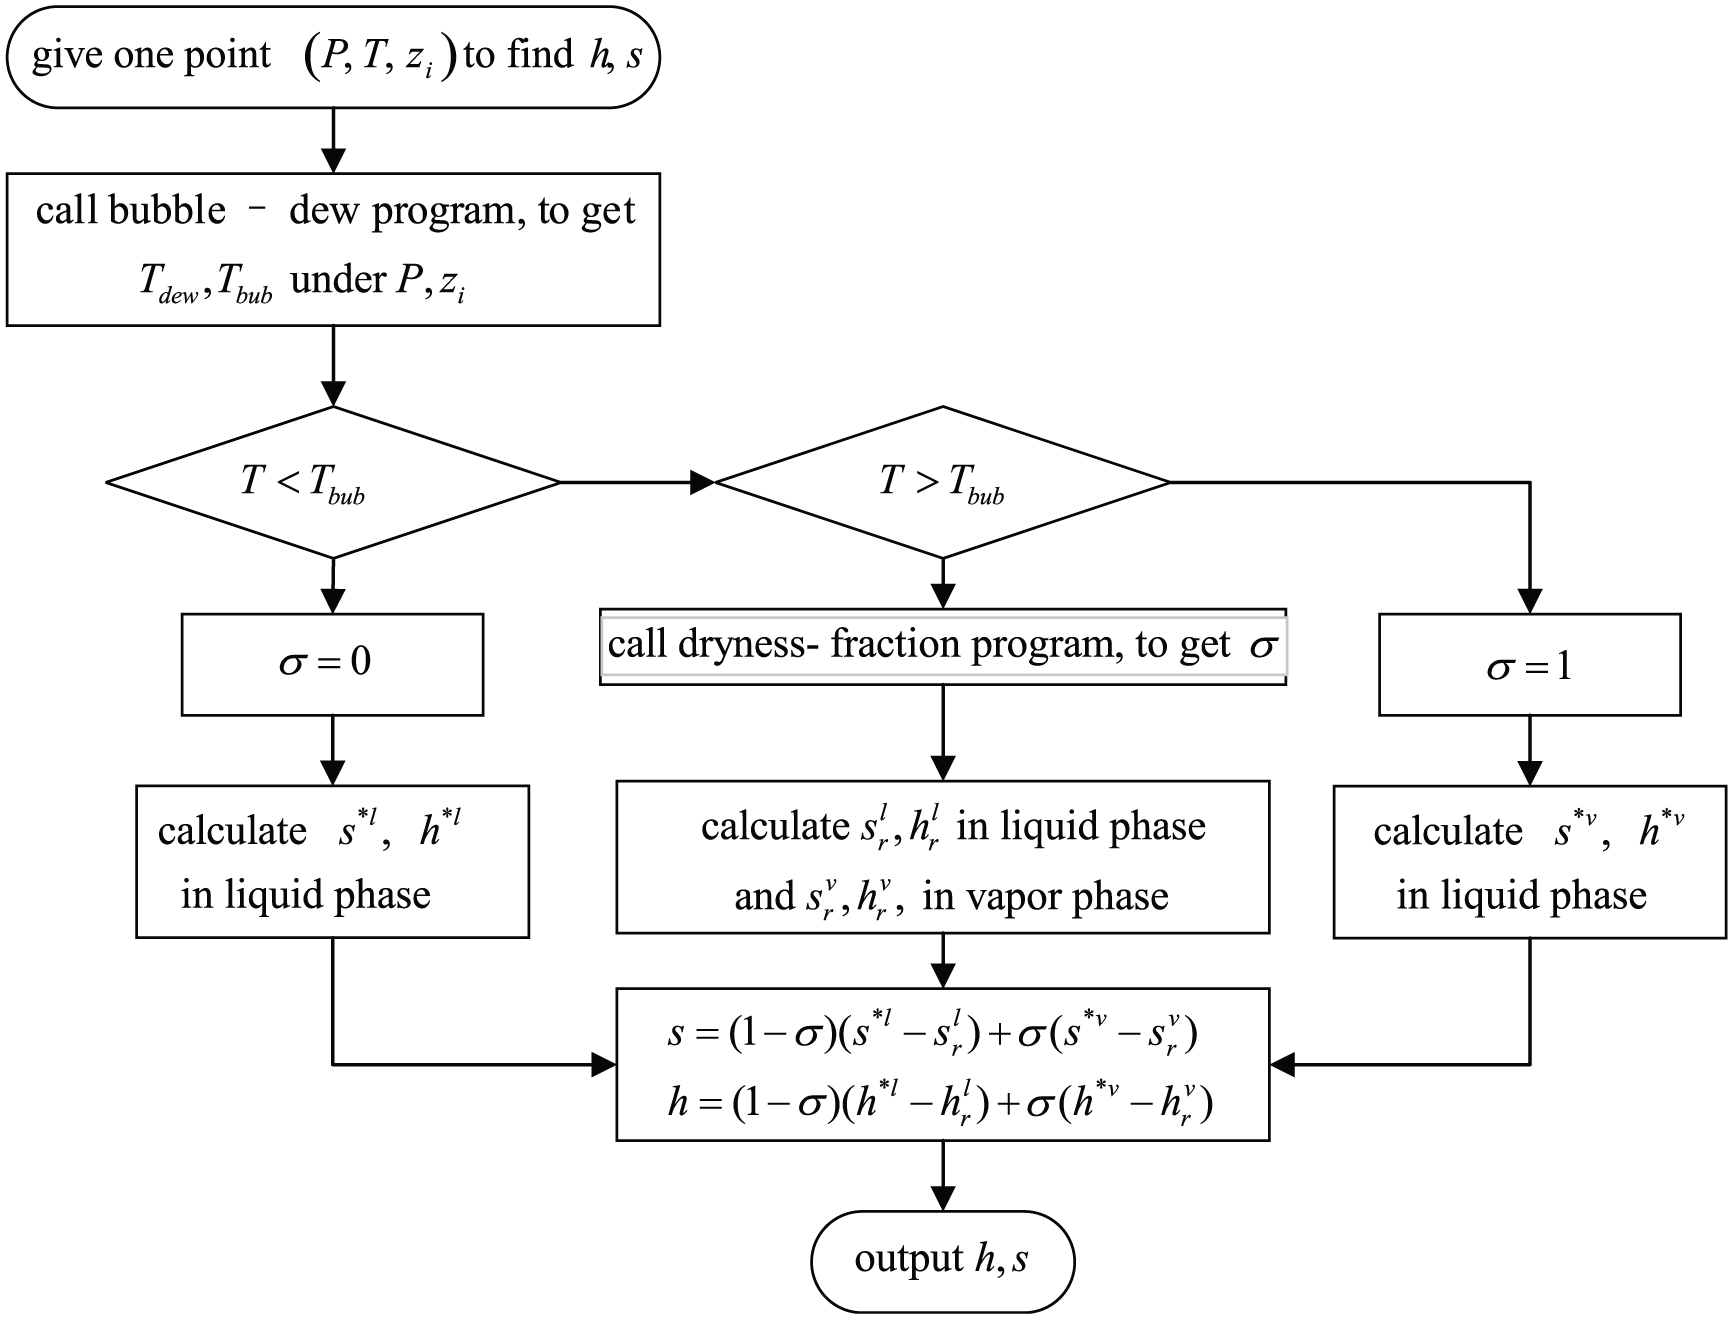
Block diagram for the calculation program for refrigerant mixture’s enthalpy and entropy.
Using the temperature, pressure, and molar ratio
Simulation results and analysis
The model can be used for the physical property simulation of any binary or multiple refrigerants but is mostly suitable for the simulation of the thermal physical properties of the binary and ternary mixture refrigerants used in the auto-cascade refrigeration system. Then, it comes to the comparison of the simulation results with the experimental data and the REFPROP software dataset by the National Institute of Standard Technology (NIST).
First, we need to verify the accuracy of the model and calculate the simulation results of the mixed refrigerant of R600a/R23. Figure 2 shows the error of R600a/R23 simulation results with the experimental data: 25 Figure 2(a) shows the error in bubble pressure calculated by the program and NIST compared with experimental value, and Figure 2(b) shows the error in mole fraction of the gas phase of R23 calculated by program and NIST compared with experimental value. The results suggest that the error of pressure simulation data compared with the experimental value is <±5%, the average error is −0.16%, and the standard error is 2.7%. The average error in mole fraction of the gas phase of R23 between simulation data and the experimental value is −1.22%, and the standard error is 1.09%. Compared with the experimental results of pressure data, the NIST data have an average error of 0.82% and a standard error of 5.81%. The results of mole fraction in the gas phase of R23 experimental data compared with NIST data have an average error of −1.39% and a standard error of 3.12%. According to the average error and the standard error of the results and Figure 2, the simulation results are closer to the experimental value than the NIST software.
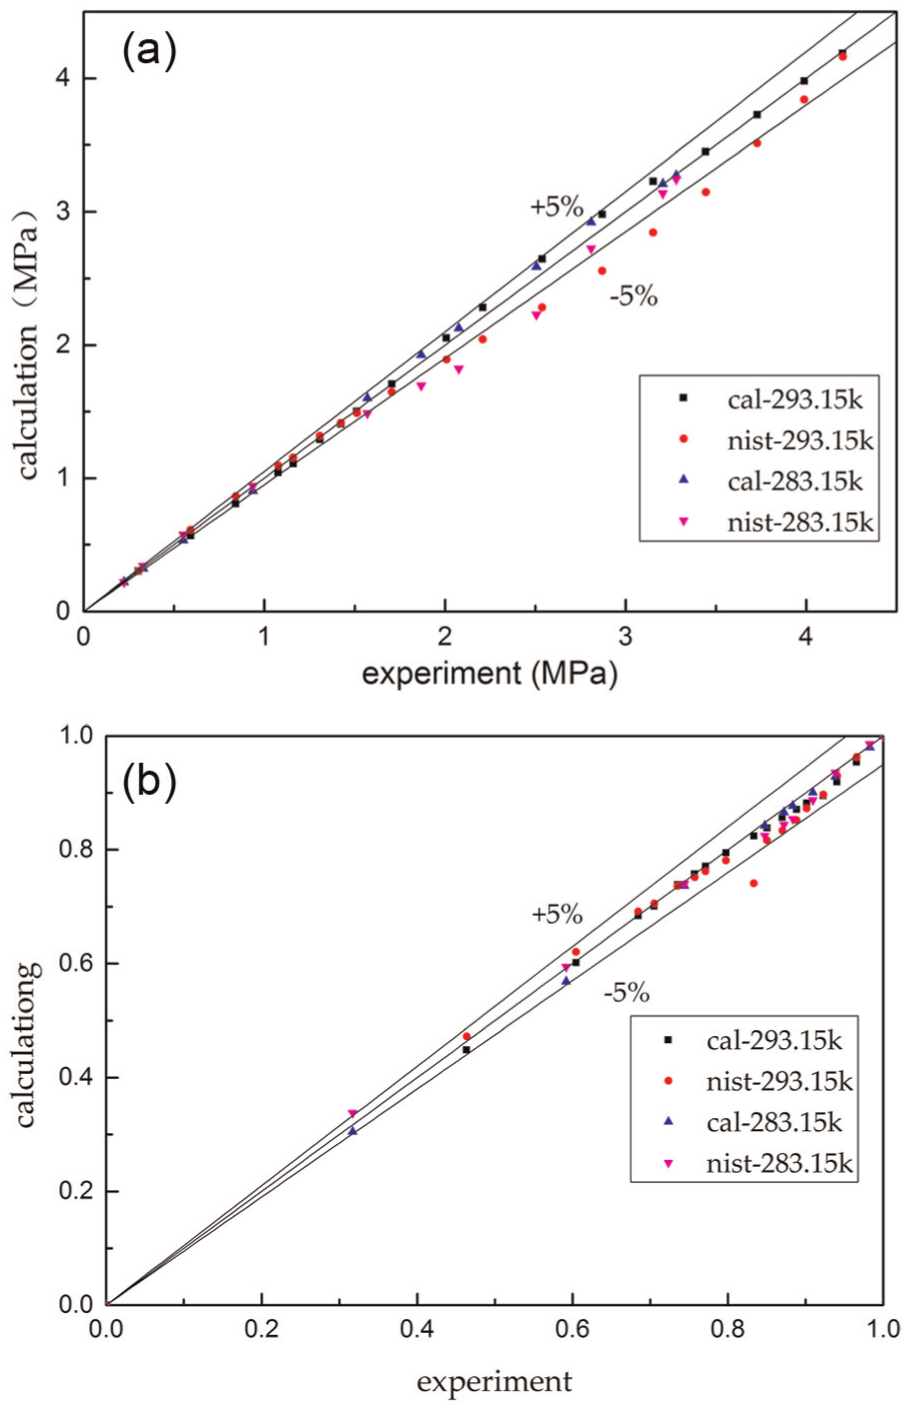
Comparison of simulation and experimental results of R600a/R23 mixture: (a) the error in bubble pressure calculated by our program and NIST compared with experimental values and (b) the error in mole fraction in the gas phase of R23 calculated by our program and NIST compared with experimental values.
Then, we need to further validate the accuracy of the model using mixed refrigerants of R134a/R23 calculation of the simulation results. Figure 3 shows the error of R134a/R23 simulation results with the experimental data: 26 Figure 3(a) shows the error of pressure calculated by our program and NIST compared with experimental values, and Figure 3(b) shows the error in mole fraction of the gas phase of R23 calculated by our program and NIST, compared with experimental values. The results indicate that the error in pressure simulation data is <±2%, the average error is −0.14%, and the standard error is 0.82%. The average error in mole fraction of the gas phase of R23 between simulation data and the experimental value is 2.27%, and the standard error is 4.08%. In addition, the average error between pressure experimental data and the NIST data is 0.5%, and the standard error is 1.35%. The average error in mole fraction of the gas phase of R23 between NIST data and the experimental value is 2.11%, and the standard error is 4.45% According to the averaged error and the standard error of the results and Figure 5, the simulation results are closer to the experimental value and the NIST software. But at low pressure (under 0.4 MPa), the error of mole fraction in the gas phase of R23 is over 5%, up to 12%. This may be a result of measurement error of the system.

Comparison of simulation and experimental results of R23/R134a mixture: (a) the error of bubble pressure calculated by our program and NIST compared with experimental value and (b) the error in mole fraction in the gas phase of R23 calculated by our program and NIST compared with experimental value.
In order to prove the accuracy of the ternary mixed refrigerants physical parameters, the simulation results of R32/R125/R134a ternary mixed refrigerants were further compared. Figure 4 shows the comparison between the calculated value and the experimental values: 27 Figure 4(a) shows the error of mole fraction of composition calculated by NIST compared with experimental value, and Figure 4(b) shows the error of mole fraction of composition calculated by our program compared with experimental value. Most of the deviation between the calculated value and the experimental value is within 5%; the average error between the program calculated value and the experimental value is 0.31%, and the stand error is 2.52%; the average error between the NIST calculated value and the experimental value is 0.16%, and the standard error is 1.6%.

Deviation between experimental and calculated values of R32/R125/R134a: (a) the error of mole fraction of composition calculated by NIST compared with the experimental value and (b) the error of mole fraction of composition calculated by our program compared with the experimental value.
Figure 5 shows the initial mass ratio 50/50 of R23/R14 mixture through the module simulation and calculation of the pressure–enthalpy diagram. The accuracy of the program is compared with NIST software. When the simulation and calculation use 64 points (14 superheated gas points, 43 supercooled liquid points, and 7 two-phase region points), the average error of enthalpy value between the simulation and NIST data is −0.25%, and the standard error is 1.10%, and the average error of entropy value between the simulation and NIST data is 3.33%, and the standard error is 2.70%, which meets the accuracy requirements for practical application.

Pressure–enthalpy diagram of simulation result for R23/R14 (0.5:0.5) mixture.
Figures 2–5 indicate that to a certain extent, the model simulation results are better than the results of NIST simulation, and the model also has the advantage of NIST REFPROP software. NIST REFPROP does not disclose the specific simulation model and simulation parameters, but the module of this model can be optimized by improving the interaction factor and other parameters based on the latest vapor–liquid equilibrium experiments. Therefore, the accuracy of simulation is improved, and it has a high degree of openness and optimization. Using the method of parameters interpolation in its neighborhood, this model can calculate the state parameters which cannot be calculated by the REFPROP software.
This model uses the module simulation, and each module can conveniently and flexibly call each other. It is much faster to call the modules inside the program than to call external modules. Figure 6 shows the comparison of pressure–enthalpy diagrams for R600a/R23/R14 (0.35:0.35:0.3): Figure 6(a) shows the pressure–enthalpy diagram of R600a/R23/R14 (0.35/0.35/0.3) mixture calculated by program using this model, and Figure 6(b) shows the pressure–enthalpy diagram of R600a/R23/R14 (0.35/0.35/0.3) mixture calculated by REFPROP software. Using this model, we can avoid the unsolvable problem when we call REFPROP as shown in Figure 6(a).

Comparison of pressure–enthalpy diagrams for R600a/R23/R14 (0.35:0.35:0.3): (a) the pressure–enthalpy diagram of R600a/R23/R14 (0.35/0.35/0.3) mixture calculated by our program and (b) the pressure–enthalpy diagram of R600a/R23/R14 (0.35/0.35/0.3) mixture calculated by the REFPROP software.
Applied in ARC system
Introduction of ARC system
Based on the previous experimental research on three-stage auto-cascade refrigeration system, 14 we use this mathematical model to analyze the performance of the ARC system. Figure 7 shows a flowchart of the three-stage ARC system with two vapor–liquid separators, in which the low-temperature components of the ARC system were placed into the vacuum tank to reduce the energy loss. R600a/R23/R14 mixtures with a mass ratio of 35/35/30 was used as refrigerant in this system. The discharge pressure is 2.117 MPa, and the suction pressure is 0.263 MPa when the system is working stably. In this system, the pipes are filled of the three refrigerants with different mass fractions at different parts. The different colors used in Figure 7 means different temperatures in the system. The arrows on the flow lines show the flow directions.
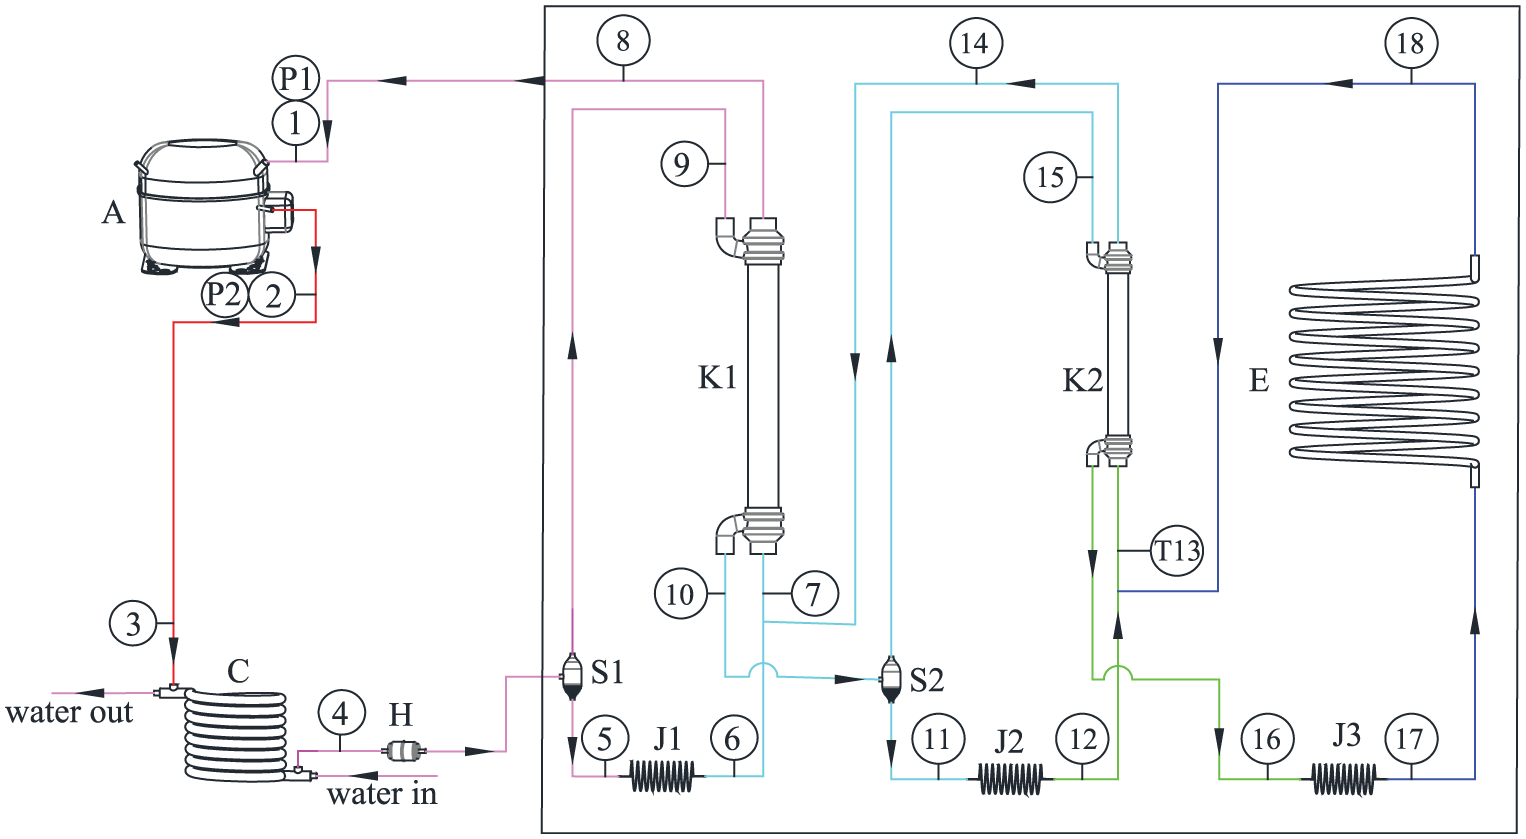
Flowchart of ARC system with two vapor–liquid separators.
Point 1 represents the inlet of the compressor (A), where the initial mixed refrigerants (mass ratio: 35/35/30) is charged in. It is compressed to point 2 by the compressor (A). The mixed refrigerants with high pressure and temperature flows into the condenser (C) and is partially cooled by water in the condenser (C). The mixed refrigerants at point 4 enter the vapor–liquid separator (S1) where the vapor and liquid phases are separated. The vapor phase flows out from the top of the vapor–liquid separator (S1), and the liquid phase flows out from the bottom. The mixed refrigerants of point 5 flows into the capillary (J1) and turns into point 7 after mixing with the mixed refrigerants of point 14 and then flows through the heat exchanger (HX) (K1) to the inlet of the compressor (A). The mixed refrigerants of point 9 flow into the HX (K1) and partially condense before reaching the vapor–liquid separator (S2). The mixed refrigerants of point 10 enter the vapor–liquid separator (S2) where liquid phase at point 11 will have a different composition from the vapor phase at point 15. The mixed refrigerants of point 11 flow into the capillary (J2) and turn into point 13 after mixing with the mixed refrigerants of point 18 and then evaporate in the HX (K2) and turn into point 14. The mixed refrigerants of point 15 flow into HX (K1) and are cooled to point 16 and then flow into the capillary (J3) turning into point 17. The mixed refrigerants of point 17 evaporate in the evaporator (P) turning into two-phase state because of the wide temperature gap between the dew point and the bubble point of the mixed refrigerants.
Analysis of the performance of ARC system
The composition of mixed refrigerants is the key factor of the three-stage ARC system with two vapor–liquid separators. The components of the mixture are separated and mixed during the running process of the system, and the change in the composition of the mixture mainly occurs in the vapor–liquid separator.
Table 1 shows the calculated thermodynamic properties of the ARC system based on the experimental data. The temperature and pressure parameters of each point in the ARC system are measured by experimental, and the thermodynamic properties are calculated by the vapor–liquid equilibrium program. The vapor–liquid group in each component points and the thermodynamic parameters are listed, including the fluid quality, vapor–liquid-phase composition, enthalpy, and entropy.
Calculated thermodynamic properties of ARC system.

NIST date: The version of NIST REFPROP software is 8.0.
In the traditional engineering application, in order to simplify the thermal calculation, it is assumed that the high- and low-temperature components are completely separated in the vapor–liquid separator. When the mixed refrigerant flows through the vapor–liquid separator S1, the component only contains R600a after point 5, and after point 9, the components are R23/R14. When the mixed refrigerant flows through the vapor–liquid separator S2, the component only contains R23 after point 11, and after point 15, the component is R14. But in Table 1, it is clear that after point 5, the component proportion of R600a/R23/R14 is 62/16.4/21.6, rather than the traditional assumption of pure R600a. After point 9, the composition still contains 19.1% of R600a. After point 15 of vapor–liquid separator S2, the component proportion of R600/R23/R14 is 2/51.4/46.6, rather than the traditional assumption of pure R14. So, it is necessary to calculate the thermal physical properties of the mixture in order to evaluate the performance of the system accurately.
The pressure–enthalpy diagram is used to represent the process of the refrigeration cycle, but in the three-stage ARC system, it cannot be presented directly by a pressure–enthalpy diagram. This system involves pressure–enthalpy diagram of binary and ternary refrigerants mixed in different proportions, so it is necessary to calculate the thermodynamic properties of R600a/R23, R23/R14, and R600a/R23/R14 with a certain component proportion.
Based on the thermodynamic properties shown in Table 1, the space pressure–enthalpy diagram was simulated and calculated with the model we built with certain mass ratios of R600a/R23/R14, which include 35/35/30, 62/16.4/21.6, 12.7/50.4/36.9, 19.1/49.8/31.1, and 2/51.4/46.6. The P–h diagram of three-stage ARC system of R600a/R23/R14 is shown in Figure 8. In the flowchart of the ARC system, the state and the cycle of system are shown.
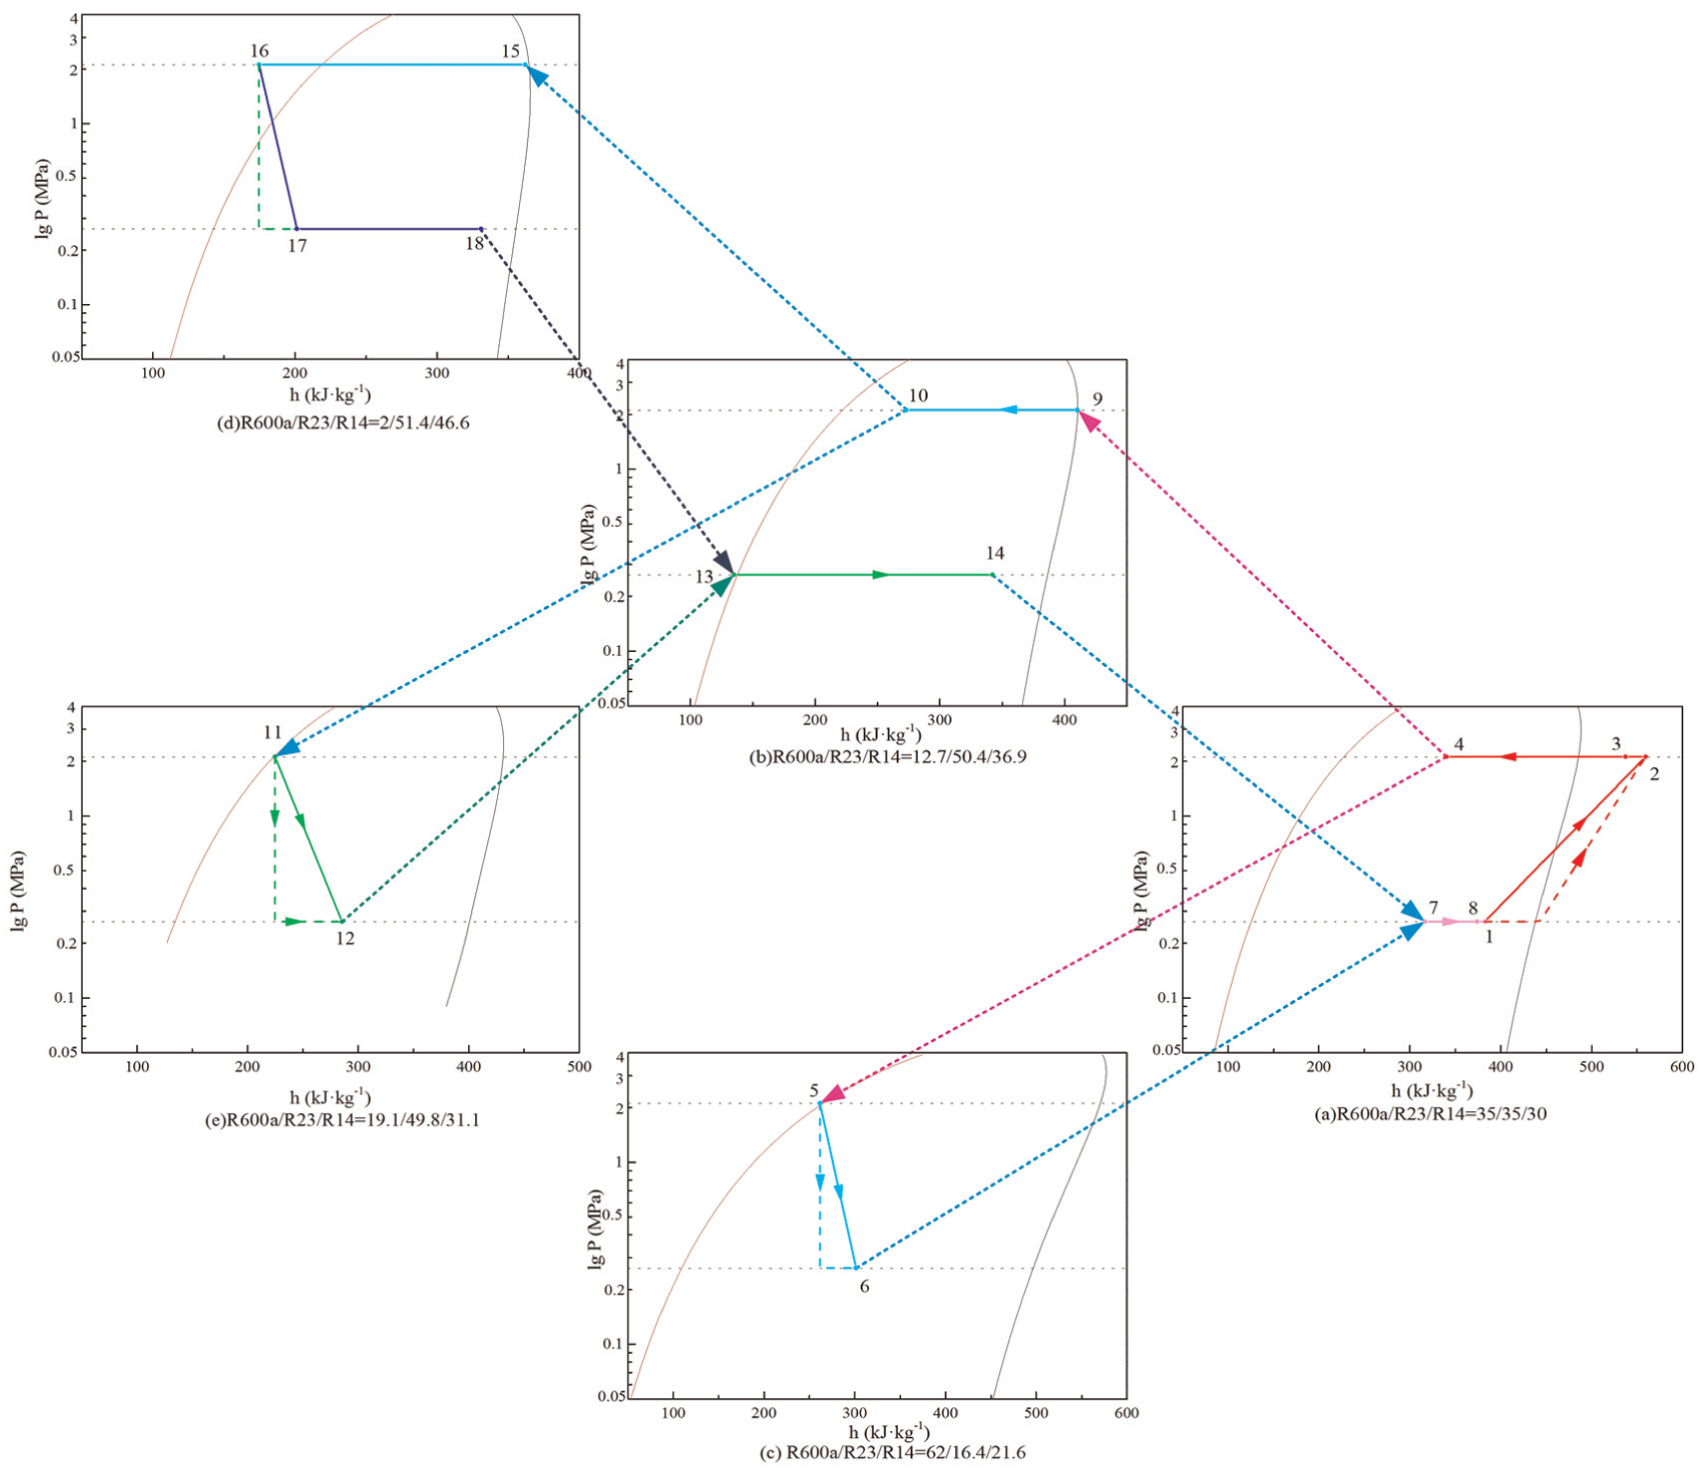
P–h diagram of three-stage ARC system of R600a/R23/R14.
Because the P–h diagram of three-stage ARC system of R600a/R23/R14 correctly represents the ARC cycle and points of the system, it can also represent the issues of the experimental system. There are some issues as indicated in Figure 8: The suction temperature is a little low, and the point 1 is still in two-phase state. This will increase the consumption of power but can be avoided by adding a recuperator between the range from point 8 to point 1 and the range from point 3 to point 4 as indicated by the dashed line in Figure 8(a). Points 14 and 18 are still in two-phase states, and the refrigerating capacity of the ARC system can be increased with enhanced heat exchange of the evaporator.
According to Table 1 and Figure 8, we can find the shortcomings and provide a direction for improvement of the ARC system, to increase performance of the ARC system. Therefore, the analysis of thermodynamic properties of ARC systems is very important to engineering application.
Conclusion
Based on the theoretical and experimental study of the R600a/R23/R14 three-stage auto-cascade refrigeration system, we have concluded the following:
Based on the mathematical model, a detailed physical model and flowchart are given. By Newton’s method, the modules are used to simulate the thermal properties of mixed refrigerants, including the solution of vapor–liquid equilibrium bubble and dew point. The dryness of the objective function for solving the vapor and liquid components is proposed, and the dryness can also be used to calculate the enthalpy and entropy of the mixed refrigerants.
The simulation results of R600a/R23 and R134a/R23 were compared with the experimental data of vapor–liquid equilibrium. It is found that the average error of simulation results of bubble pressure of the two mixtures is −0.16% and 0.14%, respectively. The average error of simulation results of gas-phase component of R23 is 1.22% and 0.5%, respectively, which is closer to the experimental values than the NIST results. The simulation results of R32/R125/R134a were compared with the experimental values of component, and the average error is 0.31%.The pressure–enthalpy diagram of R23/R14 is presented with the mass ratio of 0.5:0.5, and the simulation results are compared with NIST results, and the average error of enthalpy and entropy is −0.25% and 3.33%, respectively, <5% meet the needs of engineering application.
Through the application in ARC system, the thermodynamic properties of each point of the equipment are calculated, and the gas and liquid mass fractions in each component are obtained when the system is running stably. The space pressure–enthalpy diagram of the system cycle is given. It can find the shortcomings and provide the direction of improvement of the ARC system, so the thermal properties of the mixture must be calculated to evaluate the system performance accurately.
Footnotes
Academic Editor: Oronzio Manca
Declaration of conflicting interests
The author(s) declared no potential conflicts of interest with respect to the research, authorship, and/or publication of this article.
Funding
The author(s) disclosed receipt of the following financial support for the research, authorship, and/or publication of this article: This study was supported by National Natural Science Foundation of China (no. 51176124).