
Abstract
According to several model test results of Francis turbines, complete model efficiency hill charts were constructed. The formation and inevitability of diversified hydraulic phenomena on model efficiency hill chart for typical head range were analyzed and the difference is compared, as well as characteristics and commonness toward the curves are discussed and summarized. Furthermore, hydraulic performance and geometric features are presented by particularly analyzing the efficiency hill charts. The inherent characteristics of Francis turbine is expressed by all kinds of curves on the model efficiency hill charts, and these curves can be adjusted and moved in a small range but cannot be removed out. Due to wide range of unit speed in terms of medium-low-head hydraulic turbines, incipient cavitation curve on suction side can be observed and it is positioned close to the operation zone; however, it fails to be visualized for the high-head turbine. The blade channel vortex curves are in the vicinity of optimum region for low-head hydraulic turbines, while high-head shows reverse trend. The interaction between zero incidence angle and zero circulation curve has a significant influence on isoefficiency circles. All comparisons and analyses could provide hydraulic design basis and retrofit references.
Keywords
Introduction
Hydraulic turbine model test is considered still the final and indispensable verification means in hydraulic design of turbine, although the development of computational fluid dynamics (CFD) technology has provided a new approach for the design of turbine. Hydraulic turbine characteristic curves constructed by model test is widely used to describe energy conversion, cavitation, and other aspects of the hydraulic performance, as well as force properties and other properties at different operating conditions. 1 All the properties are the external characteristics of the internal flow of turbine, known as the external characteristics of hydraulic turbine. The relationship among the parameters of turbine is complicated, in order to clarify the parameters’ relationship, taking two parameters as a simple function with the rest of parameters fixed, which is represented by a characteristic curve of hydraulic turbine. It is regarded as the hydraulic turbine efficiency hill chart if all kinds of performance curves are plotted in a same graph.2–4
The main hydraulic characteristics of the hydraulic turbine can express concentratively on the performance characteristic curves or model efficiency hill chart (also known as model combined characteristic curve) based on the water head and flow rate coordinate or unit parameter coordinate. However, in order to intelligibly represent the relationship between hydraulic characteristics and operation conditions, it is common to apply the basic characteristic curve (constant efficiency curves, curves of channel vortex, or incipient cavitation curves on runner blades) and typical hydraulic phenomenon to describe the hydraulic characteristics of the turbine, such as the critical cavitation, incipient cavitation, cavitation erosion vortex, and pressure fluctuation of typical position. 5
According to the external characteristic expression forms, characteristic curve of turbine can be classified into linear characteristic curve and combined performance curve. Among which, the linear characteristic curve can be represented by operating characteristic curve, rotational speed characteristic curve, and water-head characteristic curves: (a) operating characteristic curve is characterized by fixed n and H, (b) rotation speed characteristic curve shows the relationship among Q, P, η, and n by identifying α and H, and (c) head curve indicates the relationship about P, Q, η, and H with fixed α and n. The combined characteristic curve can be classified as the performance curves and model efficiency hill chart according to the prototype operation and model tests: (a) performance curves apply the operation parameters H and P or Q as ordinate and abscissa, respectively, and explain the linear external characteristic curve of the prototype turbine; (b) model efficiency hill chart uses n11 and Q11 as ordinate and abscissa to represent the linear external characteristic curve of model turbine. 6 Pan et al. 7 summarize the existing study results toward pump turbine characteristic curves and divide the research results into two-dimensional mathematical transformation and three-dimensional curved side fitting. Furthermore, a fitting method for pump characteristic curves of various geometries based on cubic uniform B spline is presented by Zhang et al. 8 and proves the method works well by building various pump test data. Magnoli et al. 9 presented serious investigations into improvement of hydraulic stability under changeling conditions; the model measurements showed that distinct runner design enable influence the pressure pulsation. Hydraulic design of Three Gorges right bank hydraulic turbine is presented by Shi; 10 the method for better hydraulic stability, excellent cavitation behavior, and good performance characteristics at off-design operating conditions is clarified. Lewis et al. 11 put forward a method to improve hydraulic performance at off-design operating conditions by injecting water through slots at the trailing edges of the wicket gates.
In this article, typical model efficiency hill charts were selected at the different water-head ranges of 100, 200, 300, and 500 m based on the model test results and hydraulic design experience; meanwhile, a comparison on the turbine constant efficiency curves, blade channel vortex curves, cavitation inception curves of blade leading edge, cavitation erosion vortex curves, and the output limiting curve is conducted, and the characteristics and differences of hydraulic characteristic curves under varied water heads were analyzed and summarized. All the above provide a powerful theoretical basis and definite direction of retrofit for the hydraulic design of the turbine.
Model test
All model Francis turbines investigated in this article are installed at DF-100 universal test rig for hydraulic machinery in Dongfang Electric Machinery Co., Ltd, Deyang, China. The test rig is enabled to perform model test for Kaplan turbine and Francis turbine, as well as pump turbine in a closed-loop or semi-open loop with the maximum head of 100 m, see Figure 1. During experimental measurements, a uniform head is maintained to keep realistic conditions without obvious variation.

Model Francis turbine test rig of DF-100.
The PCI extensions for instrumentation bus system connected to an industrial computer was applied to record the data with the help of different kinds of sensor. This system is the extensions of peripheral component interconnect (PCI) at the filed of instrumentation and is extensively used in experiment, measurement and data acquisition. The IEC60193 was used to estimate the random errors, systematic errors, and other uncertainties. 12 As for the DF-100 test rig, the systematic uncertainties in the discharge, rotational speed, torque, and water head are ±0.188%, ±0.025%, ±0.075%, and ±0.065%, respectively, which corresponds to a ±0.214% system uncertainties in hydraulic efficiency calculated using formula (1). According to formula (2), the random uncertainty toward the hydraulic efficiency was estimated to a band of ±0.10% by several measurements of mean value and standard deviation
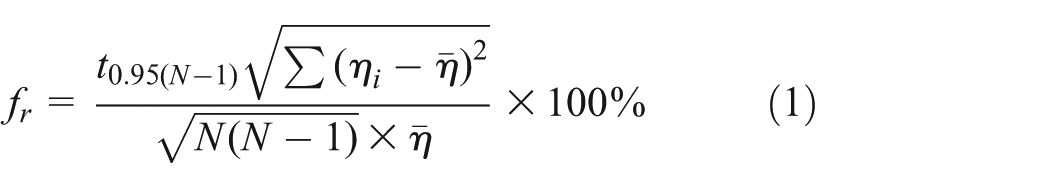

where
Related parameters of investigated turbines for four different head ranges are tabulated in Table 1. The scale-down models for diameters are 0.3655, 0.4177, 0.4092, and 0.5048 m which correspond to 7.105, 7.398, 3.696, and 2.288 m in prototype turbines, respectively, with the rated water head of 80, 197, 300, and 490 m.
Geometry and operating parameters of the investigated turbines.

In order to get the performance and characteristics of the turbines, a lot of measurements were carried out at diverse operation points, ranging from a very small opening of guide vane to a maximum valve. The model hill charts were constructed for the axis of Q11 versus n11.
Characteristics of model efficiency hill chart
Model hydraulic turbine usually operates at the head region and output range that the prototype turbine may run because of the time-consuming experiment period and expensive test costs. 13 Considering the optimum operating points as the center, test conditions should cover the entire operation range as widely as possible. The final results of the model test of hydraulic turbine are the model efficiency hill charts; the comparison shows the model turbine hydraulic performances and provides references for running and selecting the prototype turbine. Figure 2 shows the investigated Francis turbine model efficiency hill chart for four kinds of typical head range, respectively, 100, 200, 300, and 500 m, from which the similarities and differences can be analyzed and summarized.

Francis turbine model efficiency hill chart for water head of (a) 100 m, (b) 200 m, (c) 300 m, and (d) 500 m.
General character analyses of model efficiency hill chart
As shown in Figure 2, the Francis turbine model efficiency hill chart can be plotted when n11 and Q11 are taken as ordinate and abscissa, respectively, and marks out the constant guide vane opening curves and constant efficiency curves at the entire test operating conditions. The turbine pressure fluctuation isolines, cavitation inception contours, and the critical cavitation coefficient curve at different measuring points can be scaled out. Within the test range, a blade vortex inception curve and the development curve appear if the optimal region is taken as central under the small opening and small flow; cavitation inception curve of blade leading edges on the pressure side can be observed at high unit speed and large flow region, while it appears on suction side at low unit speed and low flow region, respectively; 95% output limiting curve and cavitation erosion vortex curves are located in the region of large opening and large flow rate. The inherent characteristics of Francis turbine are expressed by all kinds of curves on the model efficiency hill charts, and these curves can be adjusted and moved in a small range but cannot be removed out of the hill chart by means of hydraulic design strategy.
95% output limiting curve
Increasing output is obtained with the increase in the wicket gate opening, but the output will reach its upper limit while the guide vane opens to the maximum position. The prototype turbine can normally achieve power adjustment in maximum output operation, so on the model efficiency hill chart, the points of 95% limit output conditions under the same unit speed were connected to draw an output limiting curve. Generally, the early hydraulic turbine was designed based on one-dimensional or two-dimensional flow theory with manual drawing and semi-mechanization manufacture, which would lead to the model turbine subjected to poor output characteristics, and the turbine arrives its limit output rapidly as a result of the guide vane passing beyond the best efficiency point. The selection of model turbine was restricted vitally due to output limiting curve that often drops into the test range. For modern hydraulic turbine design, before the model test is being performed, several numerical optimizations and geometric shape inspections, combined with advanced processing technology and numerical control machining technology, have been carried out. As a result, the output limit of the model turbine passes far away from the optimum region and rarely falls into test range. The output limiting curves in Figure 2 are only a matter of schematic diagram, which are actually excluded from the entire test range.
Incipient cavitation curve of runner blade pressure and suction side
The model efficiency hill charts of Francis turbine are bound to have much in common according to the analysis of hydraulic design. In general, the cavitation inception curve of blade leading edge on suction side gets closer to optimum region than that of on pressure side; furthermore, the incipient cavitation curve on suction side has an increasingly serious effect on model selection for low-head Francis turbine. It is beneficial for the Francis turbine with slightly positive incidence angle at optimum operating condition to improve prototype turbine efficiency at low-head and rated operating condition; accordingly, the stability and the weighted average efficiency could be improved at weighted operation condition. Cavitation curve of blade leading edge on pressure and suction side is directly related to the incidence angle of runner leading edge; the cavitation inception on suction side will emerge rapidly from the optimum unit speed to the low unit speed on model efficiency hill chart. While the turbine turns from optimal unit speed to high unit speed, the blade leading edge passes zero incidence angle and then turns to negative incidence angle; when reaching a certain intensity, it can induce the cavitation inception on pressure side of the blade leading edge, so it is far from the optimum operating region on the efficiency hill chart.
The model test institutions attend to connect cavitation inception curves of blade leading edge on pressure and suction sides and the blade channel vortex curves. Belonging to the same scope of observation experiment, it is difficult to substantially observe and identify the difference between blade channel vortex and cavitation phenomenon, especially at the operating conditions’ conjunction of the blade channel vortex and the cavitation of the blade leading edge.
For Francis turbine at different water-head ranges, cavitation inception of blade leading edge on pressure is quite different from suction side. As for middle-low water-head Francis turbine, cavitation inception curve of blade leading edge will fall into the model efficiency hill chart because of its wide range of unit speed. In addition, cavitation inception curve on suction side can be observed on the efficiency hill chart, and it is positioned close to the operation zone and difficult to be excluded from the operation range for low-head Francis turbine, as shown in Figure 2(a). While operating at the high or super-high water head, there is lower level of cavitation incipient on efficiency hill chart due to the narrow operation unit speed range and small speed test span.
Blade channel vortex inception and development curves
According to the model test of hydraulic turbine, it is defined as the blade channel vortex inception if vortex flow appears simultaneously in three blade channels of runner; while vortex presents at every channel, it is defined as the blade channel vortex development. Blade channel vortex inception curve and its developing curve will drop in the experimental working range, and both are parallel from high unit speed to low unit speed incurved down at part-load conditions. In comparison, the blade channel vortex of the low water-head turbine is adjacent to optimum region, while the circumstance is contrary for high water head. Many experimental curves showed that the blade channel vortex of the low-head model runner appears in the vicinity of 60% of Pr and one of the medium-high water-head runners is about 45% of Pr, and it is difficult to exclude it completely outside the stability operation region. The blade channel vortex of the high and super-high water-head turbine occurs in minimum flow rate condition and is eliminates far from the 45% of Pr.
Isoefficiency curve
Theoretically, two characterization curves are used to represent the operation state of the runner on efficiency hill chart of the Francis turbine: zero incidence angle (Δβ = 0) curve and zero circulation (Vu = 0) curve. The two orthogonal curves interact and restrict with each other, which play a controlling role for the trend and gradient of the model constant efficiency curve. The constant efficiency ring on efficiency hill chart is affected by the interaction between the inlet incidence angle and the outlet circulation of the runner.
For the isoefficiency curves of the different water heads, the shape and efficiency gradient in all directions shows typical common and distinct difference. It generally believed that the turbine energy performance is the best when the runner operates at zero incidence angle and zero outlet circulation or with slightly positive outlet circulation or alternating outlet circulation; therefore, the slope of the isoefficiency curve is significantly smaller at the direction of the curve Δβ = 0 and Vu = 0 on the model efficiency hill chart. Operation probability of prototype turbine at the high water-head condition is less than the one at the middle-low water head; a positive incidence angle at the blade leading edge is designed to improve the efficiency under large load, but the disadvantage is the negative influence on the hydraulic efficiency under small opening and low unit speed.
The guide vane and the draft tube play a crucial role in the entire shape of the efficiency curve on efficiency hill chart. For the runner, although relatively good inflow conditions are obtained at zero incidence angle direction, the hydraulic loss of tandem cascades will increase sharply with the guide vane opening decreasing. This means that the efficiency of constant efficiency curve will drop sharply under small opening and high unit speed region. The outlet circulation of the runner has a great influence on the energy recovery of the draft tube, and the best energy recovery performance of the draft tube will be achieved by the runner outlet with slightly positive circulation or alternating circulation; thereby, the high-efficiency region of the turbine shows the characteristics of elliptical partial left distribution along zero outlet circulation curve.
In addition, guide vane and draft tube play different roles for the turbine efficiency improvement at different water-head ranges. For the high and super-high water-head Francis turbine, the guide vane opening is generally small and the flow velocity is high, so the hydraulic loss caused by tandem cascades is relatively large. This means that the optimum design of tandem cascades in the high and super-high water-head turbine should be given prior consideration. With regard to middle-low water heads, significant energy recovery of draft tube is presented. From the model efficiency hill chart perspective, the area of high efficiency is wide along zero outlet circulation direction. Interaction between lifting water head and partial optimum unit discharge leads the energy recovery of draft tube to a progressive weakening and the impact factor of tandem cascades on hydraulic performance to increase; the high-efficiency range varies from ellipse near zero circulation gradually to a standard circular along zero incidence angle control, as validated in Figure 2(a) and (d). Furthermore, success or failure on hydraulic design of draft tube tends to extremely effect the low-frequency pressure fluctuation because of its huge momentum in the trailing edge for middle-low water-head Francis turbine.
Characteristics of pressure fluctuation in different quadrants
Unsteady flow such as pressure variation and fluctuation in a large hydraulic turbine usually lead to the instability of operation. The cause and revolution of pressure fluctuation in hydraulic turbine is especially sophisticated and presents different characteristic frequencies. 14 Furthermore, pressure fluctuation in different components or diverse operating conditions shows varied features. According to the principle of hydraulic design, hydraulic characteristics of pressure fluctuation can be discriminated approximately in different quadrants on model efficiency hill chart.
Francis turbine is generally designed according to no impact or slight positive incidence angle in leading edge, and normal outflow or a little bit positive circulation or alternating circulation in the outlet edge at the best efficiency point. As shown in Figure 3, the circumferential velocity component increases with the decrease in load, and then, a strong helical off-centered vortex rope appears in the draft tube. It brings out a low-frequency pressure fluctuation and induces the turbine vibration.

Efficiency hill chart of model turbine.
In Figure 3, the curve AB is the boundary of unstable operation region caused by high-amplitude low-frequency pressure pulsations. At the range of low water head with large flow rate, separation flow and cavitation at leading edge on pressure side could be observed under large negative incidence angle flow conditions. In this case, vortex ropes appear in the draft tube, which seriously affect the dynamic stability of the turbine, and the corresponding boundary curve is BC. Curve CD is the 95% output limiting curve. At high-load region, concentric vortex rope and vibration of the turbine are mainly responsible for the negative circulation in tailing edge, which is represented by the curve DE. At high water head with low flow rate range, flow separation and cavitation are found on the suction side of the blade due to the existing large positive incidence angle in the runner leading edge. Meantime, medium-high frequency pressure pulsations triggered by blade channel vortex have an influence on turbine stability and even blade crack, which is featured by the curve EA. The region surrounded by points A, B, C, D, and E is defined as the stable operation range of Francis turbine.
Prototype turbine selection
Type selection of prototype turbine is influenced by different characteristics of different water-head model efficiency hill charts, and respective selection zone also shows distinguishing feature.
First, low water-head hydraulic turbine customarily operates in a large range of water-head variation, and its operating region on efficiency hill chart is wide, so the type selection is limited by the cavitation inception curve of blade leading edge, especially the suction side cavitation inception curve. On the contrary, as for high and super-high water-head hydraulic turbine, it is rarely linked to the cavitation inception curve. Second, the stability operating region in efficiency hill chart of the high and super-high water-head hydraulic turbine is much wider than that of low water head, so turbine load-adjusting range varies from 45% of Pr to 100% for the high and super-high water-head turbine, while the low water head would be limited within 60% of Pr. Third, in order to keep away from low-frequency pressure fluctuation arising from vortex rope, steady output range of the prototype turbine not lower than 40% of Pr at low discharge is suggested.
Hydraulic characteristics of hydraulic turbines
For low water-head Francis turbine (about 100 m design water head), frequent pressure pulsation in upper load operation makes it difficult to eliminate in model test; furthermore, it presents increasing challenge to remove it with decreasing design water head. Given large unit discharge and cavitation coefficient, running without cavitation requires a larger suction height. It is a failure to exclude blade channel vortex beneath 60% of Pr due to relatively less energy produced by unit water head. The cavitation curve of leading edge on suction side may drop in the turbine operation range in case where water-head variation of prototype turbine is large. The high-amplitude of low-frequency pressure fluctuation exceeds 8% of peak-to-peak value.
With regard to the medium-high water-head Francis turbine (about 200 m design water head), the range of specific speed has enormous advantage in designing super-giant hydraulic turbine with small runner diameter; for instance, the runner diameter of 1000 MW Francis turbine in Baihetan Hydropower Plant is about 8.5 m, while 750 MW turbine in Three Gorges reaches to 10 m. 15 The blade channel vortex and cavitation curve of leading edge on the suction side can be excluded outside the turbine normal operation region, however, which sets a still higher demand on hydraulic design. A high suction height and deeper excavation depth is a requirement for turbine operating without cavitation, which brings expensive construction and operating costs. And the peak-to-peak value of low-frequency pressure fluctuation is below 5%.
With regard to high and super-high water-head Francis turbine (above 300 m design water head), the essential consideration of hydraulic and structural design is silt abrasion problem due to high flow velocity during turbine running, which are prone to wear on the blades and greatly influence their life expectancy.16,17 The blade channel vortex and cavitation curve on the pressure and suction side are far away from turbine stability operation range. For the runner with diameter D = 1–4 m, its manufacturing and repairing are demanding and complex as a result of high synchronous speed, small runner size, and large number of runner blades, especially the weld procedure at the crow and band of the blade midsection, where the ordinary number of blade is 17, even 32 with splitter blades. Lower suction height is required due to small critical cavitation coefficient and cavitation inception coefficient.
Conclusion
The model efficiency hill chart comprehensively reflects hydraulic performance of model hydraulic turbine. The universality and individuality of each model turbine can be explored by detailed analysis and comparison. It can further bring insight into the performance evolvement regulation and provide guide for engineers to conduct performance optimization.
All performance curves on the model efficiency hill chart, for example, the output limiting curve, cavitation inception curve of blade leading edge, cavitation vortex curve, and others, are the natural characteristics of Francis turbine, which cannot be eliminated but can be adjusted in a small range by means of hydraulic design strategy. With the improvement in design and manufacturing technology, the output limit curve has passed far away from the optimum operating range. As for medium-low-head hydraulic turbine, cavitation inception curves on suction side can be observed on the hill chart, that is positioned closer to the operation zone; unfortunately, it fails to be found for the high-head turbine. The curves of blade channel vortex get close to optimum region for the low-head hydraulic turbine, while reverse trend is present for high-head turbines. The interaction between zero incidence angle curve and zero circulation curve has a crucial influence on isoefficiency circles. The slope of isoefficiency curve is significantly smaller at the direction of curve Δβ = 0 and Vu = 0 on model efficiency hill chart. Low-head turbine type selection is limited by the cavitation inception curve of blade leading edge, and the load-adjusting range is widely beneath 60% of Pr, while it varies from 45% to 100% of Pr for the high and super-high water-head turbine. The hydraulic turbines under varied water heads have the points in common with respective characteristics.
Footnotes
Appendix 1
Academic Editor: Peng Guoyi
Declaration of conflicting interests
The author(s) declared no potential conflicts of interest with respect to the research, authorship, and/or publication of this article.
Funding
The author(s) disclosed receipt of the following financial support for the research, authorship, and/or publication of this article: This research was supported by the National Natural Science Foundation of China (51479166).