
Abstract
In this study, we proposed a method for calculating the sonic conductance of a short-tube orifice. First, we derived a formula for calculating the sonic conductance based on a continuity equation, a momentum equation and the definition of flow-rate characteristics. The flow-rate characteristics of different orifices were then measured using the upstream constant-pressure test method in ISO 6358. Based on these test data, the theoretical formula was simplified using the least squares fitting method, the accuracy of which was verified experimentally. Finally, the effects of the diameter ratio, the length-to-diameter ratio and the critical pressure ratio were analysed with reference to engineering applications, and a simplified formula was derived. We conclude that the influence of the diameter ratio is greater than that of the length-to-diameter ratio. When the length-to-diameter ratio is <5, its effect can be neglected. The critical pressure ratio has little effect on the sonic conductance of a short-tube orifice, and it can be set to 0.5 when calculating the sonic conductance in engineering applications. The formula proposed in this study is highly accurate with a mean error of <3%.
Keywords
Introduction
An orifice is a sudden flow restriction of short or zero length (in the case of a sharp-edge orifice), and it is a basic element of pneumatic components such as nozzle-flapper servo valves, solenoid valves and pneumatic bearings. Valves have numerous flow passages, but there is usually an orifice restriction somewhere in the flow passage that controls flow, which is why a valve often behaves like an orifice. Thus, a quantitative understanding of airflow through an orifice is required when designing or analysing a pneumatic system.
The airflow rate through an orifice is a fundamental problem in fluid mechanics. It was originally solved by the effective area approach, 1 which was directly dependent on the discharge coefficient. Many studies have, therefore, focused on identifying a simple way to calculate the discharge coefficient,2–4 and such a formula was derived in Jobson. 5 However, the discharge coefficient is affected by the pressure ratio, the length-to-diameter ratio (L/d), the inlet pressure and other factors. This makes the formula so complicated that it is difficult to use in engineering applications. Deckker and Chang 6 proposed a graph for deriving the value of Cd, based on a series of experiments. However, the experimental data are limited, and the graph cannot be used if the object is outside the known range. The discharge coefficient is so complex that Sanville 7 derived an approximate formula for estimating flow-rate characteristics using sonic conductance. This approach gradually gained acceptance over the last decade and has been adopted as the standard parameter for calculating flow rates in the latest version of ISO 6358-1:2013. 8 Manufacturers are gradually replacing effective area with sonic conductance in their product catalogues, as a convenient and accurate method for the design and analysis of pneumatic components.
Formulae have been proposed for calculating the sonic conductance of orifices.9,10 However, as both were derived by fitting the experimental data, their applicability is limited. A formula such as that proposed by Gidlund is suitable only for orifices in which L/d is <10, and the formula of Belforte et al. is limited to orifices with diameters ranging from 4 to 10 mm and length-to-diameter ratio ranging from 0.33 to 10. However, in many real applications such as pneumatic bearings, 11 pneumatic springs 12 and air conditioning systems,13,14 the diameter and the length-to-diameter ratio are outside this range and cannot be handled by these formulae. As the flow rate decreases with the increase in length-to-diameter ratio,11–14 neither the local loss nor the friction loss should be neglected in these types of application. Similar formulae have been proposed8,15,16 for calculating the sonic conductance of tubes, which a long orifice somewhat resembles. However, many tubes are of large diameter, with lengths ranging from metres to tens of metres. If the formulae are obtained from these tubes, using them directly to calculate sonic conductance may produce errors.
The problems with the existing approaches can be summarised as follows: the discharge coefficient is complex and varies with the pressure ratio, making it unsuitable for engineering applications; the sonic conductance formulae neglect the local and frictional losses in a short-tube orifice, leading to large errors, and the formulae lack a theoretical basis, making it difficult to extend them to other dimensions. The formulae for tubes provide references, but their accuracy is more or less unsatisfactory when the orifices’ dimensions are very different from tubes.
The purpose of this study was to propose a sonic conductance calculation formula for airflow through a short-tube orifice based on a theoretical analysis. The formula considered both the local and frictional losses in the orifice and was amended and verified in experiments. The effects of different parameters were analysed to further simplify the formula, making it suitable for engineering applications.
Sonic conductance in a short-tube orifice
In ISO 6358, the flow-rate characteristics are described by sonic conductance C, critical pressure ratio b and subsonic index m. However, when the flow is chocked, the flow rate depends only on sonic conductance. Sonic conductance is so important for the flow-rate characteristics of pneumatic components that it stands to pneumatic components as does the resistance R to an electrical circuit.
Before modelling the sonic conductance of the orifice, the airflow through the orifice must be identified. Figure 1 shows three distinct patterns of airflow through an orifice. 17 In Figure 1(a), the airflow separates at the outlet section of the orifice, and the flow section is less than the diameter of the orifice. In Figure 1(b) and (c), the flow reattaches with the orifice and also with the wall in Figure 1(c). Thus, the frictional loss can be neglected for sharp-edge orifices such as Figure 1(a) and (b), but for the flow shown in Figure 1(c), the frictional loss will increase with the increase in length and must be taken into account.

Basic patterns of airflow through an orifice: (a) separated flow, (b) marginally reattached flow and (c) fully reattached flow.
The orifices corresponding to these three cases are, respectively, known as a sharp-edge orifice, a thick orifice and a short-tube orifice. However, there is no definite criterion by which these three types of orifice can be distinguished. In JIS B 8390:2000, 1 based on British Standards, orifices with an L/d of 0.05 are treated as sharp-edge orifices and those with an L/d of >0.05 as thick orifices. Ward-Smith 17 uses L/d < 7 for sharp-edge orifices and L/d > 7 for thick orifices. Other definitions are presented in other articles.3–5 However, there is no uniform method for categorising pneumatic orifices.
To facilitate the analysis, we established a model of a short-tube orifice based on the structure shown in Figure 1(c). In this model, the flow is fully reattached to the orifice, and Figure 1(b) was treated as the limiting case of a short-tube orifice. The frictional loss was considered, but the length of the orifice will be discussed only in the penultimate section.
The structure of the short-tube orifice and its parameters are shown in Figure 2. There is no chamfer or rounded corner in the contracted position. The inlet diameter of the orifice is labelled D, the outlet diameter d and the length L.

Structural schematic diagram of the orifice.
Based on the law of mass conservation, when air flows through the abruptly contracted position, the gas flow velocity will increase suddenly due to boundary layer separation and the generation of swirl, which causes a local energy loss. When the air flows in the bore, friction between the gas and the inner wall of the bore causes a frictional loss along with the flow.
To simplify the analysis, the following assumptions were made:
The air is an ideal gas, which satisfies the ideal gas state equation.
The velocity and fluid properties are constant across sections normal to the flow, and the flow reattaches with the wall of the orifice.
The air entering and exiting the orifice has only an axial component to the velocity vector.
The air in the orifice is at constant ambient temperature.
The air is in a critical flow state such that the downstream-to-upstream pressure ratio of the orifice is equal to the critical pressure ratio.
Based on these assumptions, the air between section 1-1 and section 2-2 was set as the control volume. Applying the momentum theorem, and considering the frictional force and defect force, the conservation of momentum equation can be expressed as follows

By merging similar items, equation (1) is reduced to the following expression
The first item of equation (2) is the pressure difference at inlet and outlet, based on assumption 5. It can be rewritten as follows

where b is the critical pressure ratio and also denotes the flow in the short-tube orifice in the chocked state such that the downstream pressure has no effect on the flow rate.
The second item F is the force defect first proposed by Jobson 5 and given by
where fd is a dimensionless force defect coefficient whose value depends on the discharge coefficient of the orifice. If the discharge coefficient of the orifice in Figure 2 is Cd, then the force defect coefficient can be obtained as follows

The third item in equation (2) is the wall friction force in the bore, while

Substituting equations (3)–(6) into equation (2), equation (7) yields

According to the law of mass conservation, the mass flow rate of each section is equal, so that

Combining the gas state equation

The density ρ is mainly determined by the pressure, and under assumption 2, the pressure gradually decreases in the bore. To facilitate the integral, therefore, the average density of the inlet and outlet air is used to approximate the arbitrary density in the bore, and the average density is given as follows

The integral of the density can be solved as

Substituting this into equation (8), the mass flow rate through the orifice can be solved as follows

where
From the definition of flow-rate characteristics, 8 the mass flow rate through the orifice in a chocked state is expressed by

Comparing equations (9) and (10) yields the value of sonic conductance as follows

Equation (12) indicates that the sonic conductance heavily depends on the orifice diameter, but it is also affected by b, fd, λ, β and L/d, where d, β and L/d are structure parameters that can be measured directly. However, it is difficult to determine the critical pressure ratio, force defect coefficient and pipe friction factor directly, as these are affected by the Reynolds number. The Sonic conductance of orifice is constant as it is an intrinsic property and Reynolds number has little affect. For simplicity, therefore, we used experimental data to fit the formula and reduce the undetermined parameters.
Experiment on flow-rate characteristics
Three different methods have been presented for measuring the flow-rate characteristics of pneumatic components:8,18–20 the discharge method, the in-line method and the isothermal discharge method. The discharge test method is air- and time-saving, but the tank volume must be changed as a discharge time of 10–15 s is required. 20 The in-line method, also called the upstream constant-pressure method, 21 has the best accuracy, although the equipment is more expensive and the test procedure is complex. To guarantee the accuracy of the data in this study, the in-line method was adopted.
Orifices under test
The flow-rate characteristics of 14 short-tube orifices with orifice diameters from 0.5 to 5 mm were measured. The length-to-diameter ratio ranged from 0.4 to 25 and the diameter ratio from 0.05 to 0.5. The structure of these machined orifices is shown in Figure 3. The upstream inlet port was constant at G1/4, and the nominal diameter d and length L are shown in Table 1.

Structure of the orifice.
Nominal dimensions of the orifice under test.

To reduce the influence of machining errors, the dimensions of the orifices were carefully measured using three-dimensional (3D) coordinate measurement (Global Performance, 9128) and a tool microscope (19JA). The accuracy was shown to be up to 1 µm. These measured dimensions were used in deriving the formula.
Apparatus and test procedures
The test circuit and apparatus were based on the upstream constant-pressure measurement method proposed in ISO 6358, as shown in Figure 4. They comprised a precision regulator (IR3020-02; SMC Pneumatics), a shut-off valve (VHS02; SMC Pneumatics), a flowmeter (D07-B; SevenStar), two pressure sensors (MB300; Gova), a temperature sensor (GW200; Gova), a throttle valve (AS2000-02; SMC Pneumatics), a data acquisition (DAQ) card (NI 6009; National Instruments), a barometer (BY-2000P; KEJIAN) and the orifice under test. The accuracy of the flowmeter, temperature sensor and pressure sensor were ±2% full scale (FS), ±0.5% FS and ±0.5% FS, respectively.
Schematic diagram of flow-rate characteristics test.
At the beginning of the test, the upstream of the inlet pressure was set at a constant 500 kPa by precision regulator 1, and the mass flow rate through the orifice was then changed by adjusting throttle valve 11; the downstream pressure changed with the variation in the opening of the valve. In the testing process, the recording of data began when the airflow in the orifice had entered a stable state. The upstream temperature and pressure and downstream pressure and flow rate were collected by the sensors and sent to a computer.
Test results
Using these test data, the conductance of each orifice was solved by the definition of flow-rate characteristics from ISO 6358. The conductance of the orifice at different pressure ratios is shown in Figure 5. The sonic conductance is the maximum conductance when flow is chocked and is shown by the horizontal line. As the orifice diameter was increased, the sonic conductance also increased. The effects of the length-to-diameter ratio and diameter ratio were relatively small, but for an orifice of the same diameter, they changed the sonic conductance and cannot be neglected.

Flow-rate characteristic curves of orifices.
The critical pressure ratio and subsonic index were solved by data fitting using the least squares (LSQ) method. The subsonic index is almost constant at 0.5 for an orifice and is not considered here. The critical pressure ratio is shown in Figure 6.

Critical pressure ratio of orifices.
Measurement errors
The main errors introduced into the system are instrument errors and principle errors. Both will lead to deviations in sonic conductance. Therefore, we evaluated these errors in the test system before evaluating the accuracy of the formula.
Instrument error
The main DAQ equipment and its accuracy are shown in Table 2. The accuracy of all sensors used in these experiments met the A-level accuracy required by ISO 6358.
Data acquisition equipment.
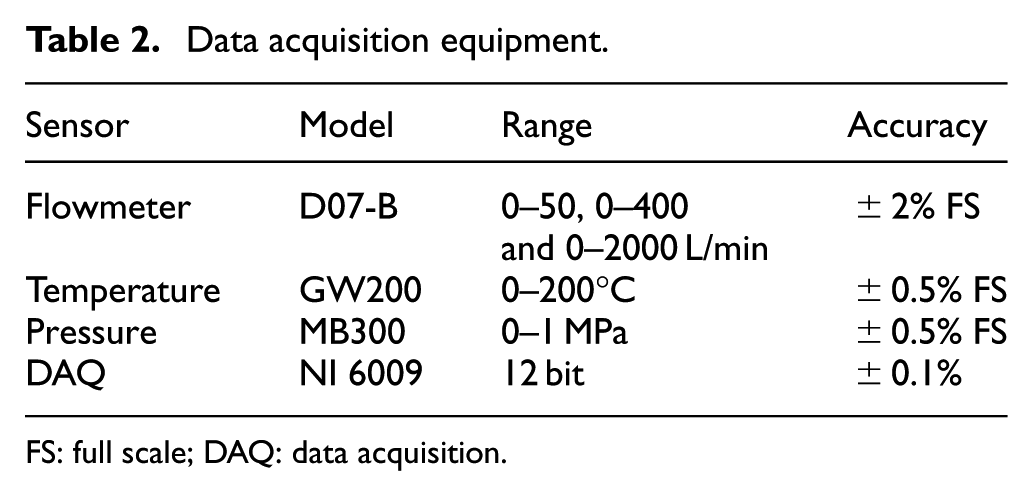
FS: full scale; DAQ: data acquisition.
Principle error
In the upstream constant-pressure test method, the pressure sampled by the pressure sensor is static pressure, and it is smaller than the stagnation pressure that is used to calculate the sonic conductance. Similarly, the temperature sensor measures the static temperature rather than the stagnation temperature. Therefore, in order to improve the accuracy of the calculation, the static parameters should be converted to stagnation values. For the adiabatic flow and steady flow, the energy conservation equation gives the following relationship between the stagnation parameters and the static parameters

The Mach number is

Similarly, the relationship between the stagnation temperature and the static temperature can be obtained as follows

Analysing equations (14) and (15), for the upstream constant-pressure test method, the static pressure
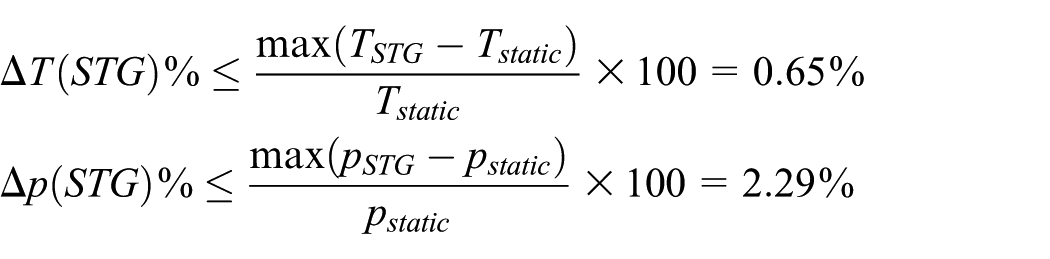
From equation (10), the uncertainty of the sonic conductance of the orifice can be calculated by equation (16) 8
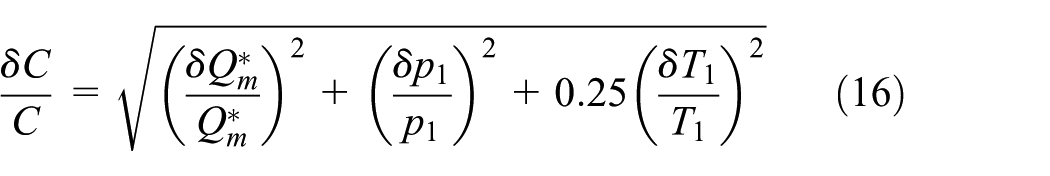
Substituting all these parameter deviations into equation (16) gave a maximum deviation of the sonic conductance of 3.45%. This suggested that the measured data were reliable and could be used for deducing the formula.
Formula for sonic conductance
In representing the sonic conductance of a fixed orifice as in equation (12), certain assumptions were adopted that will produce errors of different degrees. Therefore, we used experimental data to correct the formula.
All the parameters in equation (12) are structural dimensions, except the critical pressure ratio and the friction coefficient. We first identified the critical pressure ratio and friction coefficient.
To calculate the critical pressure ratio of an orifice or tube, three different formulae have been proposed.15,16,22 The critical pressure ratio b depends only on β for sharp-edge orifice, 22 and when β changed from 0 to 1, the maximum change in scope of the critical pressure ratio was 0.03. For an orifice wherein L/d is <10 and β is <0.5, the range variation is <0.2. 15 The critical pressure ratio changed from 0.42 to 0.53 for the test samples, as shown in Figure 6, which matched well with the data presented in Zhang et al. 23 It can be concluded that the orifice size has little influence on the critical pressure ratio.
The friction coefficient is affected by the Reynolds number, and it is mainly determined by the flow regime in the orifice. It can be obtained as follows
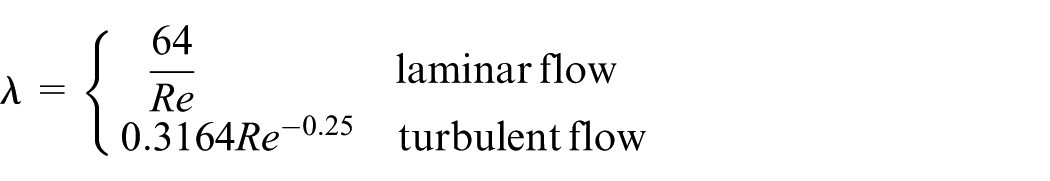
For the chocked flow, the flow state is turbulent, the typical value of the Reynolds number is about 104–105, 17 and λ is in the range of 0.017–0.032, depending on the surface quality.
The force defect coefficient depends only on the discharge coefficient of Cd, according to equation (5). The Cd of an extremely barbed Borda mouthpiece is 0.5, and smooth nozzle is 1.0. 5 The range of fd can be obtained as shown in Figure 7.
Change rate of fd with different Cd.
The variation ranges of these items, including 1 − b, 1/b, (1 + fd) and
The LSQ method was used to solve these unknown constants, using iteration to search for the best values of the coefficients. As the speed and accuracy of the solution are affected by the initial values, the boundary of the initial values should be restricted carefully. Based on the above analysis, b ranged from 0.4 to 0.6;

In order to find the best solution with minimised deviation, the objective function is defined as

Under the boundary condition clarified above, the optimisation toolbox in MATLAB and the lsqnonlin solver were used to solve the objective function, and the optimal solution was obtained as

For the accuracy of the sonic conductance, the root-mean-square error (RMSE) is 1.08 × 10⁻¹⁰. Therefore, the sonic conductance can be derived as follows

This result in SI units was then converted to make it easier for engineering applications

In equation (20), C is the sonic conductance (L/(s bar)), d is the inside diameter of a short-tube orifice (mm) and L is the length of the orifice (mm).
Figure 8 shows the relationship between the sonic conductance obtained experimentally and by calculation. The experimental data points mainly fell within the curved surface given by equation (19). This confirmed that the calculated results were consistent with the experimental data.

Sonic conductance of a short-tube orifice.
The relative errors of the orifices, based on Figure 8, are shown in Table 3. The maximum relative error was 5.09%, and the average error was 2.17%. Considering the system uncertainty, equation (19) was shown to satisfy the requirements of engineering applications.
Deviation of sonic conductance (%).

Results and discussion
In engineering applications, we expect the formula to be as simple as possible and to have only few parameters. If an effect is sufficiently small, it can, therefore, be neglected when estimating sonic conductance. However, if the effect is large enough that it cannot be neglected, then its degree of impact and the scope of the formula’s application must be identified.
Effects of structure parameters
The formula for calculating sonic conductance in equation (19) is deduced on the basis of equation (12) when the coefficients b, fd and λ are set as constant. However, when the structure of an orifice varies, these parameters will change simultaneously, and the degrees of impact will also vary with different β and L/d.
We then changed the values in equation (12) to study the influence of each parameter. We assumed that a parameter that effects a change of <5% can be neglected in engineering terms. The reference value was set according to the characteristic of the parameter and then the change rate of sonic conductance was defined as

where Ci is the sonic conductance when the length-to-diameter ratio, diameter ratio and other parameters have different values.
Effect of the critical pressure ratio
Based on the experimental data shown in Figure 6, the critical pressure ratio of the orifice varied from 0.4 to 0.53. Therefore, we analysed the influence of b within this range. As shown in Figure 9(a) and (b), the change rate of the sonic conductance was always <5% at different values of L/d and β, and the effect of b can, therefore, be neglected. The critical pressure ratio can be set at 0.5 for general calculation.
Change rate of C with different b: (a) L/d is constant and (b) β is constant.
Effect of the force defect coefficient
Force defect coefficient fd can be determined by equation (11), and its variation regularity is demonstrated in Figure 7. For a general orifice, the discharge coefficient Cd ranges from 0.5 to 1.0. We use the mean value Cd = 0.75 corresponding to fd = 0.45 as the reference value, and the change rate of sonic conductance is shown in Figure 10.

Change rate of C with different fd.
Figure 10 suggests that the effect of fd increases with the increase in β. When β = 0.7, the change rate of C is >5%. However, when β = 0.7, the value of fd will be >0.1 because of the small section contraction responds to large discharge coefficient, as shown in Figure 7. Thus, the effect of fd can be neglected when β is <0.7.
Effect of the wall friction factor
In the former section, we have defined that the friction factor ranges from 0.017 to 0.032, and it mainly affects the friction losses. Thus, we change the values of L/d to study the effect of wall friction factor. Figure 11 shows the change rate of C with different friction factors; it is clear that the effect of λ increases with the increase in L/d. However, this effect is always <5% when L/d is <20 and can be neglected.

Change rate of C with different λ.
Effect of the diameter ratio
Figure 12 shows the rate of change of sonic conductance against the diameter ratio, where the reference sonic conductance was obtained at a diameter ratio of 1. This means that the diameter is the same as that of a tube with no local loss. It is clear that as the diameter ratio decreased, the sonic conductance became smaller and the local loss increased.

Change rate of C with different β.
As the length-to-diameter ratio decreased, the friction loss also became smaller, and the local loss became dominant. Thus, the smaller the length-to-diameter ratio, the faster the change rate of the sonic conductance with respect to the diameter ratio. The effect of the diameter ratio was much larger than that of the length-to-diameter ratio; when β changed from 1.0 to 0.6, the sonic conductance increased by >20%. Therefore, this effect must be considered when calculating the sonic conductance of an orifice.
Effect of the length-to-diameter ratio
Figure 13 compares the rate of change in sonic conductance with the length-to-diameter ratio, where the reference value of the sonic conductance is obtained when the length-to-diameter ratio is zero. It is clear that as the length-to-diameter ratio increased, the friction loss also increased, and the sonic conductance became significantly smaller.

Change rate of C with different L/d.
Figure 13 also shows that as the diameter ratio increased, the rate of change in sonic conductance became faster with respect to the length-to-diameter ratio. This was due to the local loss falling as the diameter ratio increased and then the frictional loss becoming dominant. This means that the larger the diameter ratio, the larger the change rate. When L/d is <5, the change in sonic conductance is <5%, suggesting that the effect of the length-to-diameter ratio can be neglected in engineering applications. We can, therefore, classify an orifice as a sharp-edge orifice when its L/d is <5 in engineering applications. However, if L/d is >5, it should be treated as a short-tube orifice, and the effect of L/d must be considered.
Thus, if the length-to-diameter ratio is <5, equation (12) can be reduced to
When β is 0.6 and fd is 0.3, a similar formula to that of Gidlund 9 can be obtained as

Here, the diameter d is in millimetre and C is in litre per second per bar.
The relative deviation of equation (23) and Gidlund’s equation is 1.6%, and the equation can be used for calculating the sonic conductance of an orifice when L/d is <5 and β is in the range of 0.5–0.7.
Comparison with previous work
To verify the advantage of the formula proposed in this article, a comparison was made with previous proposals. A summary of the formulae used for calculating sonic conductance in previous work is shown in Table 4. Figure 14 shows the comparison of each formula. Formulae 1 and 2 are used for orifices of a limited range, but both neglect the influence of β and L/d. Therefore, they cannot reflect the change rate of sonic conductance with β and L/d. The other two formulae are used for calculating the sonic conductance of tubes. They can reflect that sonic conductance decreases with L/d. However, the equation provided by ISO6358 has low accuracy for the dimension is very different; Eckersten’s formula has good accuracy when d = 5 mm because the orifice slightly resembles a short tube. When d = 0.5 mm or d = 1.0 mm, the accuracy of this formula for a tube is unsatisfactory on comparison using equation (19). Thus, equation (19) has much better applicability to short-tube orifices than the existing formulae.
Sonic conductance formulae from the previous literature.


Comparison of different formulae: (a) d = 0.5 mm, (b) d = 1.0 mm, (c) d = 2.0 mm and (d) d = 5.0 mm.
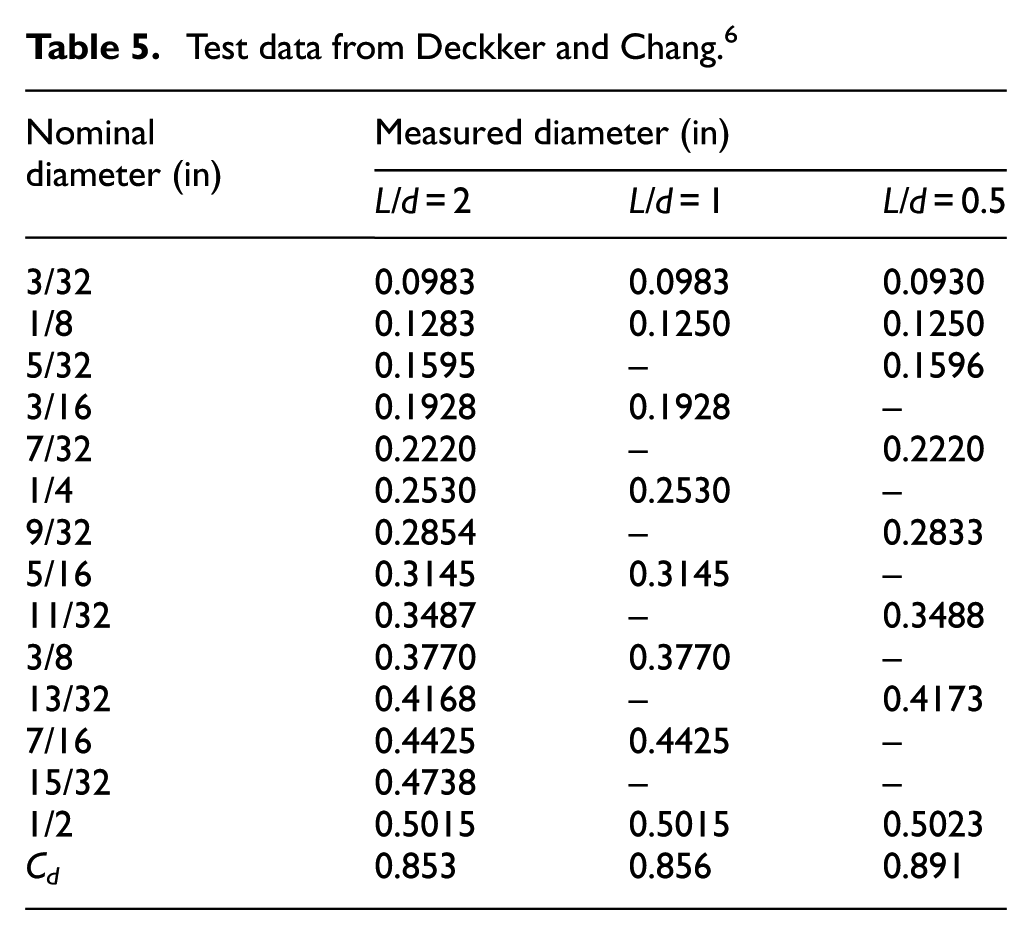
In our experiments, 14 orifices were tested to further verify the applicability of the formula. We enlarged the samples based on the data in Kayser and Shambaugh 2 and Deckker and Chang 6 as shown in Tables 5 and 6. In Deckker and Chang’s experiment, the inlet diameter is constant as 4 in, and the maximum β is 0.125.
Test data from Deckker and Chang. 6
Test data from Kayser and Shambaugh. 2
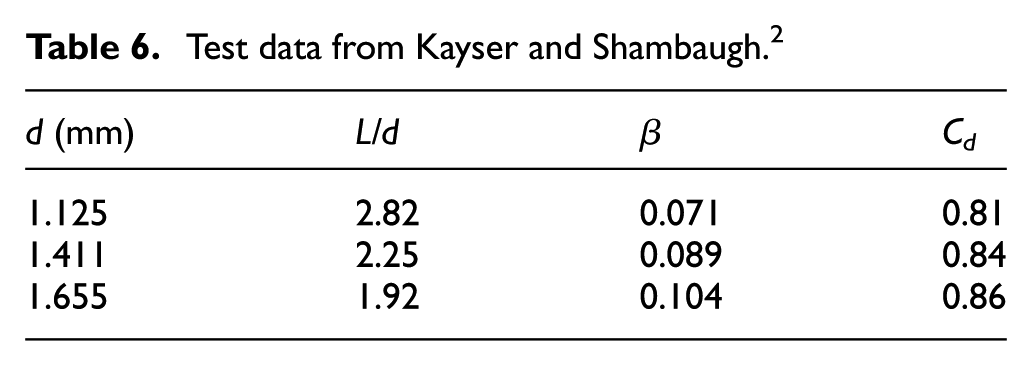
For the data given by the discharge coefficient Cd, we transferred the parameter to sonic conductance

The relationship between the experimental data and the calculated results is shown in Figure 15. The length-to-diameter ratio was sufficiently small to be ignored, and the diameter ratio was neglected as it was <0.125. It is clear that the results were consistent with each other.

Comparison of the data in the previous work.
The length-to-diameter ratios reported in the literatures are relatively small, although Figure 15 also shows that the formula introduced in this study is suitable for limiting cases of short-tube orifices.
Conclusion
In this article, a sonic conductance formula was proposed for short-tube orifices. For engineering purposes, the formula was corrected and simplified using experimental data. The main conclusions are as follows:
The sonic conductance of a short-tube orifice mainly depends on the diameter. However, when decreasing the diameter ratio or increasing the length-to-diameter ratio, the sonic conductance decreases, so that these effects cannot be neglected.
The influence of the diameter ratio is greater than that of the length-to-diameter ratio, and with the decrease in L/d, the effect of β increases.
When the length-to-diameter ratio is <5, its effect can be neglected for engineering purposes.
The formula derived in this study demonstrated better accuracy than the formulae in the previous literature for short-tube orifices. This was confirmed experimentally.
In future work, we will extend the study to the sonic conductance of an orifice with a flapper and use the results to estimate the sonic conductance of pneumatic components. This should provide a reference for the analysis and design of pneumatic systems.
Footnotes
Appendix 1
Academic Editor: Yangmin Li
Declaration of conflicting interests
The author(s) declared no potential conflicts of interest with respect to the research, authorship, and/or publication of this article.
Funding
The author(s) disclosed receipt of the following financial support for the research, authorship, and/or publication of this article: This work was supported by SMC Corporation and National Natural Science Foundation of China (NSFC; no. 51305313).