
Abstract
In order to reasonably assess the railway service quality, a multilevel extensible assessment model is proposed based on the matter element theory and the extension theory. The proposed model is applied to a real case study of some railway lines. The matter element to assess the railway service quality is established on the basis of the characteristics of passenger transit which included 7 primary assessment indices and 26 senior assessment indices. The index weights are determined by the passengers who were interviewed on board during their journey. Railway service quality is assessed by the values of the correlation degree of the matter element with all the assessment grades. The multilevel extensible assessment method can fully reflect the distance between the overall railway service quality or one kind of service attribute and the assessment grades and then it can realize the continuous assessment. The method can provide not only the passengers’ overall satisfaction degree on the railway service quality but also the passengers’ satisfaction degree on one assessment index.
Introduction
Service quality is one of the major concerns of the passengers when they select their trip modes; high levels of service quality can attract more passengers to travel by railway. Therefore, it is necessary for the railway operators to assess the existing service quality and then to improve the service level according to the assessment results.
Some authors treated transit service quality measurement by proposing different methods for assessing service quality. The literature is full of interesting studies concerning these important issues, and more specifically, a part of studies focused on railway service quality. As an example, Ieda et al. 1 introduced the prerequisite conditions and policy which can play important role on the railway service. Liu 2 analyzed the synthetic assessment indices of the passenger service. Nathanail 3 proposed a framework for the railway operators to monitor and control the quality of railway service. Nocera 4 showed the importance of high-quality transit systems within transport policy, also highlighting the role of transport for the reduction of external costs. 5 Xuan 6 set up the assessment index system of the passenger service quality and proposed the assessment model taking the differences on the design and technology quality into account. Cao and Chen 7 analyzed the relationship of service quality, passenger complaints, and passenger loyalty based on the structural equation model (SEM). Eboli and Mazzulla8,9 also proposed SEM to analyze passengers’ assessment on railway services and to find out the key service attributes. De Oña et al.10,11 proposed a methodology with the theory of a classification and regression tree (CART) approach to analyze the key attributes affecting the rail service.
Lots of attributes should be taken into account when assessing the service quality of railway, and these attributes may belong to different categories. The multilevel extensible assessment method seems very appropriate for this kind of measurement, because it is able to fully reflect the distance between the overall railway service quality or the quality of one kind of the several service attributes and the assessment grades and then it can realize the continuous assessment. For these reasons, we decided to assess the railway service by the theory of matter elements and extension method. 12 More specifically, the method allows to calculate correlation degree, which can provide passengers’ satisfaction degree on the railway service on a whole and on one service attribute. We also propose analyses for different classes of passengers; by comparing the correlation degree of one class of passengers with another class of passengers, we can infer the preferences on the railway service attribute of different kinds of passengers. As regards some advanced and more sophisticated methods available in the literature, the proposed method is a very simple and intuitive method that can be useful also for transit operators, because it provides a concise and easily usable measure of service quality.
The main structure of the article is as follows. First, we establish the multilevel assessment model. Second, we describe the case study: we analyze the main attributes of railway passenger service and set up the assessment index system; we introduce the survey which consisted of interviewing passengers on board during their journey; we analyze the data. We specify that the matter element to assess the railway service quality is established on the basis of the transit characteristics which included 7 primary assessment indices and 26 senior assessment indices. Afterwards, section “Results” focuses on the results. Finally, we give a conclusive discussion on the work.
Model
Assessment grade
Assessment grade refers to the set of classifications of all the possible passengers’ assessment remark on the quality of railway service. Assessment grade for all the assessment indices in our analysis is expressed as
Classical domain
Classical domain is the value scope of one assessment index which includes all the possible values when considering one kind of assessment remark. In this analysis, the data range of the transit users’ score on one railway service attribute is taken as the classical domain of the index if they think that the service quality attribute deserves the assessment remark. Let

where d denotes the classification of the assessment indices,
Joint domain
Joint domain is the value scope of one assessment index which includes all the possible values. In this analysis, the data range of the transit users’ score on one railway service attribute is taken as the joint domain. Let

where
Weight
Weight refers to the importance degree of an assessment index compared with another homogeneous assessment index. In the model, we determined the index weights from the point of view of a sample of passengers. And we get the passengers’ score on the weight by questionnaire provided to the passengers. Let
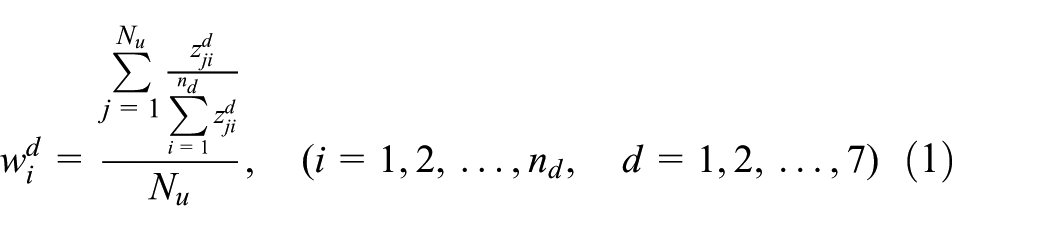
where

Matter element
Matter element refers to the object that will be assessed. Let
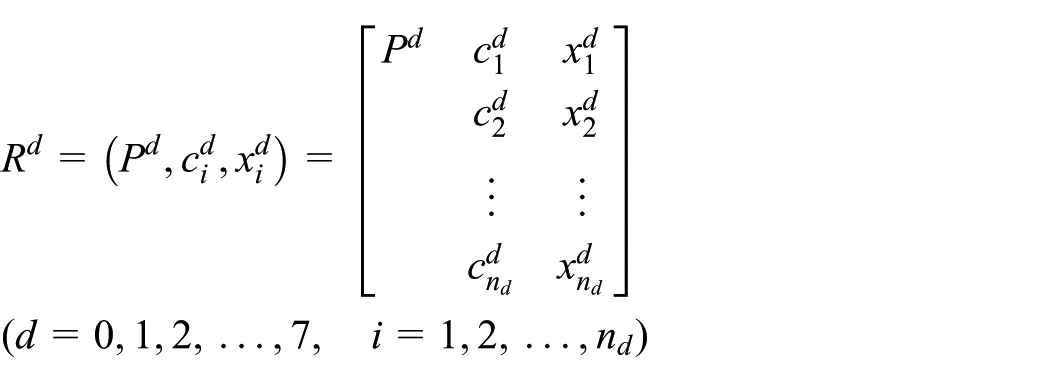
where

where
Correlation degree
The correlation degree can reflect the membership of one index with one assessment grade. The correlation degrees of the 26 senior indices should be calculated first. Let

where

And then the correlation degree of the seven primary indices should be calculated. Let

Finally, the correlation degree of the index of the railway service quality should be calculated. Let

Synthetic assessment
The more the correlation degree is, the more the adaptability degree between the assessment index and the assessment grade and vice versa. For the classical domain and joint domain listed in section “Synthetic assessment of all samples,”

where
If
For the same kind assessment indices
Case study
Assessment indices
In order to assess the passenger service quality of railway, some indices must be considered from the point of view of the passengers. Based on knowledge from some conference12,13–15 and our project, as well as taking the data availability from the railway in the northern Italy, 7 primary assessment indices and 26 senior assessment indices are used in our assessment model, which are specified in the following.
The first primary assessment index concerns “Safety.” Safety refers to the safety degree from crime or accidents and the feeling of security resulting from psychological factors, that is, safety is not only being safe from crimes and accidents while riding or at bus stops but also security related to the behavior of other persons and the railway operation. Safety is further assessed through three senior indices in this article, that is, safety on the journey, personal safety on the train, and personal safety in the station. These three senior assessment indices are entitled the first kind of indices in the following model.
“Cleanliness” is the second primary index and it concerns the physical condition of vehicles and facilities, and specifically the cleanliness of the bus interior and exterior, having busses and shelters clean of graffiti, cleanliness of seating and windows, and so on. The cleaner the transit mode is, the more the public image is and more ridership can be attracted and maintained. Cleanliness is further described by cleanliness of the carriage, cleanliness and general conditions of the seats, cleanliness of the toilets, cleanliness in the stations, and station maintenance and decorum. These five senior assessment indices are the second kind of indices in the following model.
The third primary index is “Comfort,” which is very important for the passengers, both the physical and ambient conditions regarding vehicles or stops. Comfort refers to soft and clean seats, comfortable temperature, not many people on board, 16 smoothness of the bus ride, low levels of noise and vibrations, and no nasty odors. Comfort is further assessed through three senior indices, that is, overcrowding, comfortable temperature on board, and windows and doors working on board in the following analysis. These three senior assessment indices are entitled the third kind of indices in the following model.
The fourth primary index was named “Service reliability and availability,” and it includes many important service characteristics concerning different service aspects. First, service reliability is very important for the passengers which is one of the most investigated service attributes of transit. On-time performance, headway regularity, and running time adherence are the three most common factors to measure the service reliability.17,18 Second, there are some important service characteristics linked to the monetary cost of the journey and the availability of discounted fares. Finally, there are also some service aspects representing the service availability, such as path characteristics and coverage, stops distribution, service frequency, service span, and travel time. 19 For describing service reliability and availability, five senior indices are used in our analysis, that is, ticket price in relation to the service offered, timetable, train punctuality, regular train schedule, price integration with other public transport, and distribution of stations in the region. These five senior assessment indices are the fourth kind of indices in the following model.
The fifth primary index includes other various service characteristics, and for this reason it was named “Other.” Other service refers to the railway service before and after the journey by train. All the passengers want to arrive and leave the station as convenient and soon as possible. The other aspects of the railway service are further described by three senior indices, that is, parking in the station of departure, bike on board, and accessibility for disabled in our analysis to describe these other aspects of the service. These three senior assessment indices are the fifth kind of indices in the following model.
“Information” is the sixth primary assessment index. It is very useful for the passengers to get more information about their journey and then they can plan their trip better. Without the information, potential passengers may not select transit service. 20 The passengers should know beforehand where the access is located, when the train is scheduled to depart and arrive, where to get off in the proximity of their destination, whether they should transfer, and so on. Four senior indices are listed in the following analysis for further assessment information, that is, clear and fast information in the stations, clear and fast information on board, easy communication with train, and information on other types of transports. These four senior assessment indices are entitled the sixth kind of indices in the following model.
“Personnel” is the last analyzed primary index. Customer care can make the journey easier and more pleasant, which includes courtesy and knowledge of drivers, courtesy and helpfulness of ticket agents, and personnel appearance. Personnel is further described by three senior indices in our analysis, that is, courtesy and competence of the traveling personnel, frequency and precision controlling the tickets, and courtesy and competence of the station personnel. These three senior assessment indices are the seventh kind of indices in the following analysis. These seven primary assessment indices are the zero kind of indices.
Survey
Data on the service quality of the railway are collected through a survey addressed to the passengers of the railway in northern Italy. Passengers from different types of lines were interviewed, that is, 31 regional lines and 10 suburban lines mainly connecting different towns of the Hinterland of the city of Milan and 2 express lines connecting Milan with the Malpensa airport. We interviewed the passengers on board during their journey in the period from 21 May to 1 June 2014 and got valid 3879 questionnaires. About 59.53% of the passengers traveled by the regional lines, about 38.15% by the suburban lines, and the remaining by the Malpensa express services.
We analyzed service quality by considering the lines all at once; this analysis includes different kinds of passengers, from the commuters to the occasional users. We also propose a more specific analysis which includes only the suburban lines prevalently used by habitual users.
In order to get the passengers’ assessment information on railway service, two parts of the questionnaire were defined. General information, socioeconomic characteristics, and travel habits of the passengers were listed in the first section. Satisfaction degree and importance degree of the 26 senior assessment indices, listed in the previous section, were collected. Every service attribute was valued based on a scale from 1 to 10, with 1 being the lowest value given to an index, which indicates that the passengers feel most unsatisfied with the railway service attribute or think that the index is the most unimportant one. Based on the requirements of the assessment, third-level assessment collective is established in our analysis, which is [very unsatisfied, basic satisfied, very satisfied]. 21 The score of 1, 2, 3, or 4 shows that the passenger feels very unsatisfied on an index; score of 5, 6, or 7 shows that the passenger feels basic satisfied on an index; score of 8, 9, or 10 shows that the passenger feels very satisfied on an index.
Almost 86% of the sample was investigated in a weekday. 43% of the users were investigated in the off-peak hours, about 13% in the morning peak hours, about 16% in the afternoon peak hours, and about 13% in the evening peak hours. About 39% of the passengers are commuter workers, 24% are students, and 37% are other categories of people. About 57% of the interviewed people are females. Most of the sample (40%) is aged between 16 and 25 years, 32% is between 26 and 40 years, and 24% is between 41 and 65 years. Concerning income levels, about 40% have unfixed income; 12% of people state their income belongs to a class of income lower than €1000 and 22% to a class between €1001 and €1500; about 10% belongs to a class €1501 and €2000, 5% to a class €2001 and €3000, and 2% belongs to a class €3001 and €4000 (Table 1).
Sample characteristics of the passengers of all the lines and of the passengers of only suburban lines.
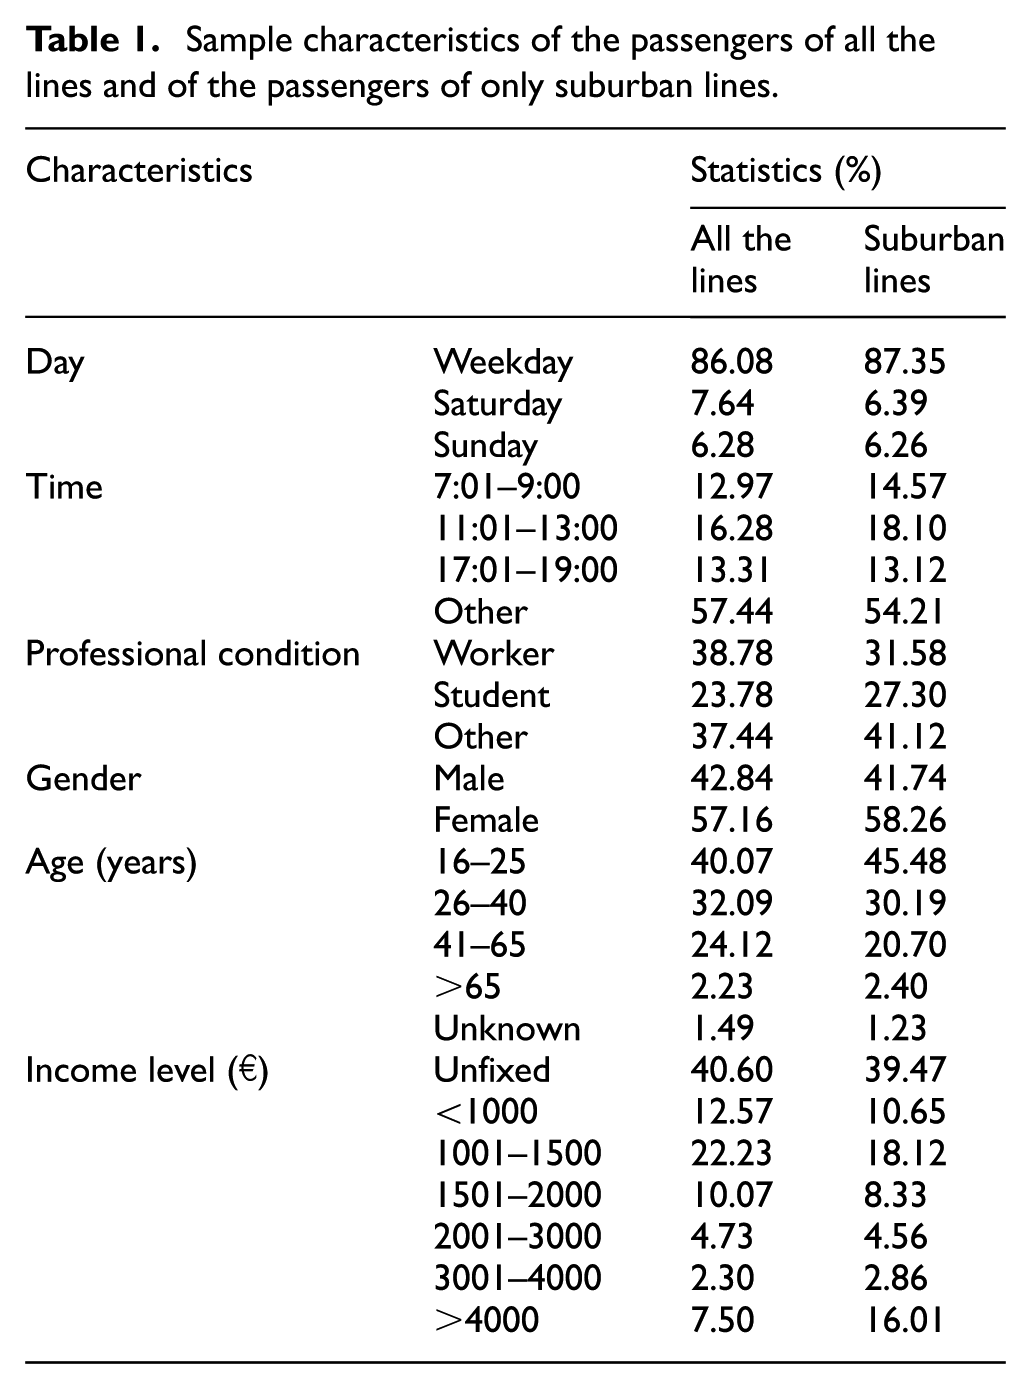
A sample of 1480 interviewed people is passengers of the suburban lines. Also, for this sub-sample, 87% of the passengers were investigated in the weekday. 46% of the sub-sample was investigated in the off-peak hours, about 15% in the morning peak hours, 18% in the afternoon peak hours, and the remaining 13% in the evening peak hours. About 32% of the sub-sample is commuter workers, 27% students, and 41% other categories of people. Also, in this case, almost 60% of passengers are females. About 45% of interviewed passengers are aged between 16 and 25, 30% between 26 and 40, 21% between 41 and 65, and about 2% more than 65 years old. About 39% of passengers have unfixed income; also, in this case, most of the sub-sample belongs to a class of income between €1001 and €1500 (18%) (Table 1).
From the scores frequencies of the whole sample (Table 2), we can infer that most of the scores for the 26 senior indices are in the intermediate section of the value range (from 5 to 8), except for two indices (cleanliness of the toilets and train punctuality), which are prevalently thought as very unsatisfactory (from 1 to 4). Safety on the journey and personal safety on the train and in the station, together with the index concerning the personnel, appear as the most satisfactory indices; safety on the journey is the most satisfactory index presenting a frequency of 34%. The indices regarding cleanliness and comfort appear as particularly critical, showing frequencies around 40% in the lower range of scores (from 1 to 4).
Frequencies of the satisfaction scores expressed by the passengers of all the lines and of only suburban lines.

Passengers traveling by the suburban lines more or less express similar judgments of the whole sample. Safety of the journey is judged even better in this case.
Results
Synthetic assessment of all samples
According to the questionnaire and the value of the assessment grade, we can set up the classical domains, which are denoted as

We can get the joint domain, which is denoted as

According to the steps described in sections “Weight” and “Matter element,” we can get the seven weight vectors and the scores for the 26 assessment indices.
According to the steps described in sections “Correlation degree” and “Synthetic assessment,” we can get the correlation degrees of the 26 senior indices, the synthetic correlation degrees of the 7 primary indices (Table 3), and the overall correlation degrees for all the passengers, reported in the following

Weight, score, and correlation degree of all the lines.

VUS: very unsatisfied; BS: basic satisfied; VS: very satisfied.
According to the assessment criteria, we can get that
Synthetic assessment on the sub-sample of the suburban lines
The overall correlation degrees for the passengers traveling by suburban lines are the following

Being
Table 4 shows the correlation degrees of the 7 primary indices and the 26 senior indices. Not important differences emerge with respect to the whole sample.
Weight, score, and correlation degree value of suburban lines.

VUS: very unsatisfied; BS: basic satisfied; VS: very satisfied.
Synthetic assessment and passengers’ characteristics
Table 5 shows the synthetic correlation degree for both the whole sample traveling by all the selected lines and the sub-sample traveling by suburban lines, by taking the sample’s characteristics into account.
Synthetic correlation degree for all the lines and suburban lines.
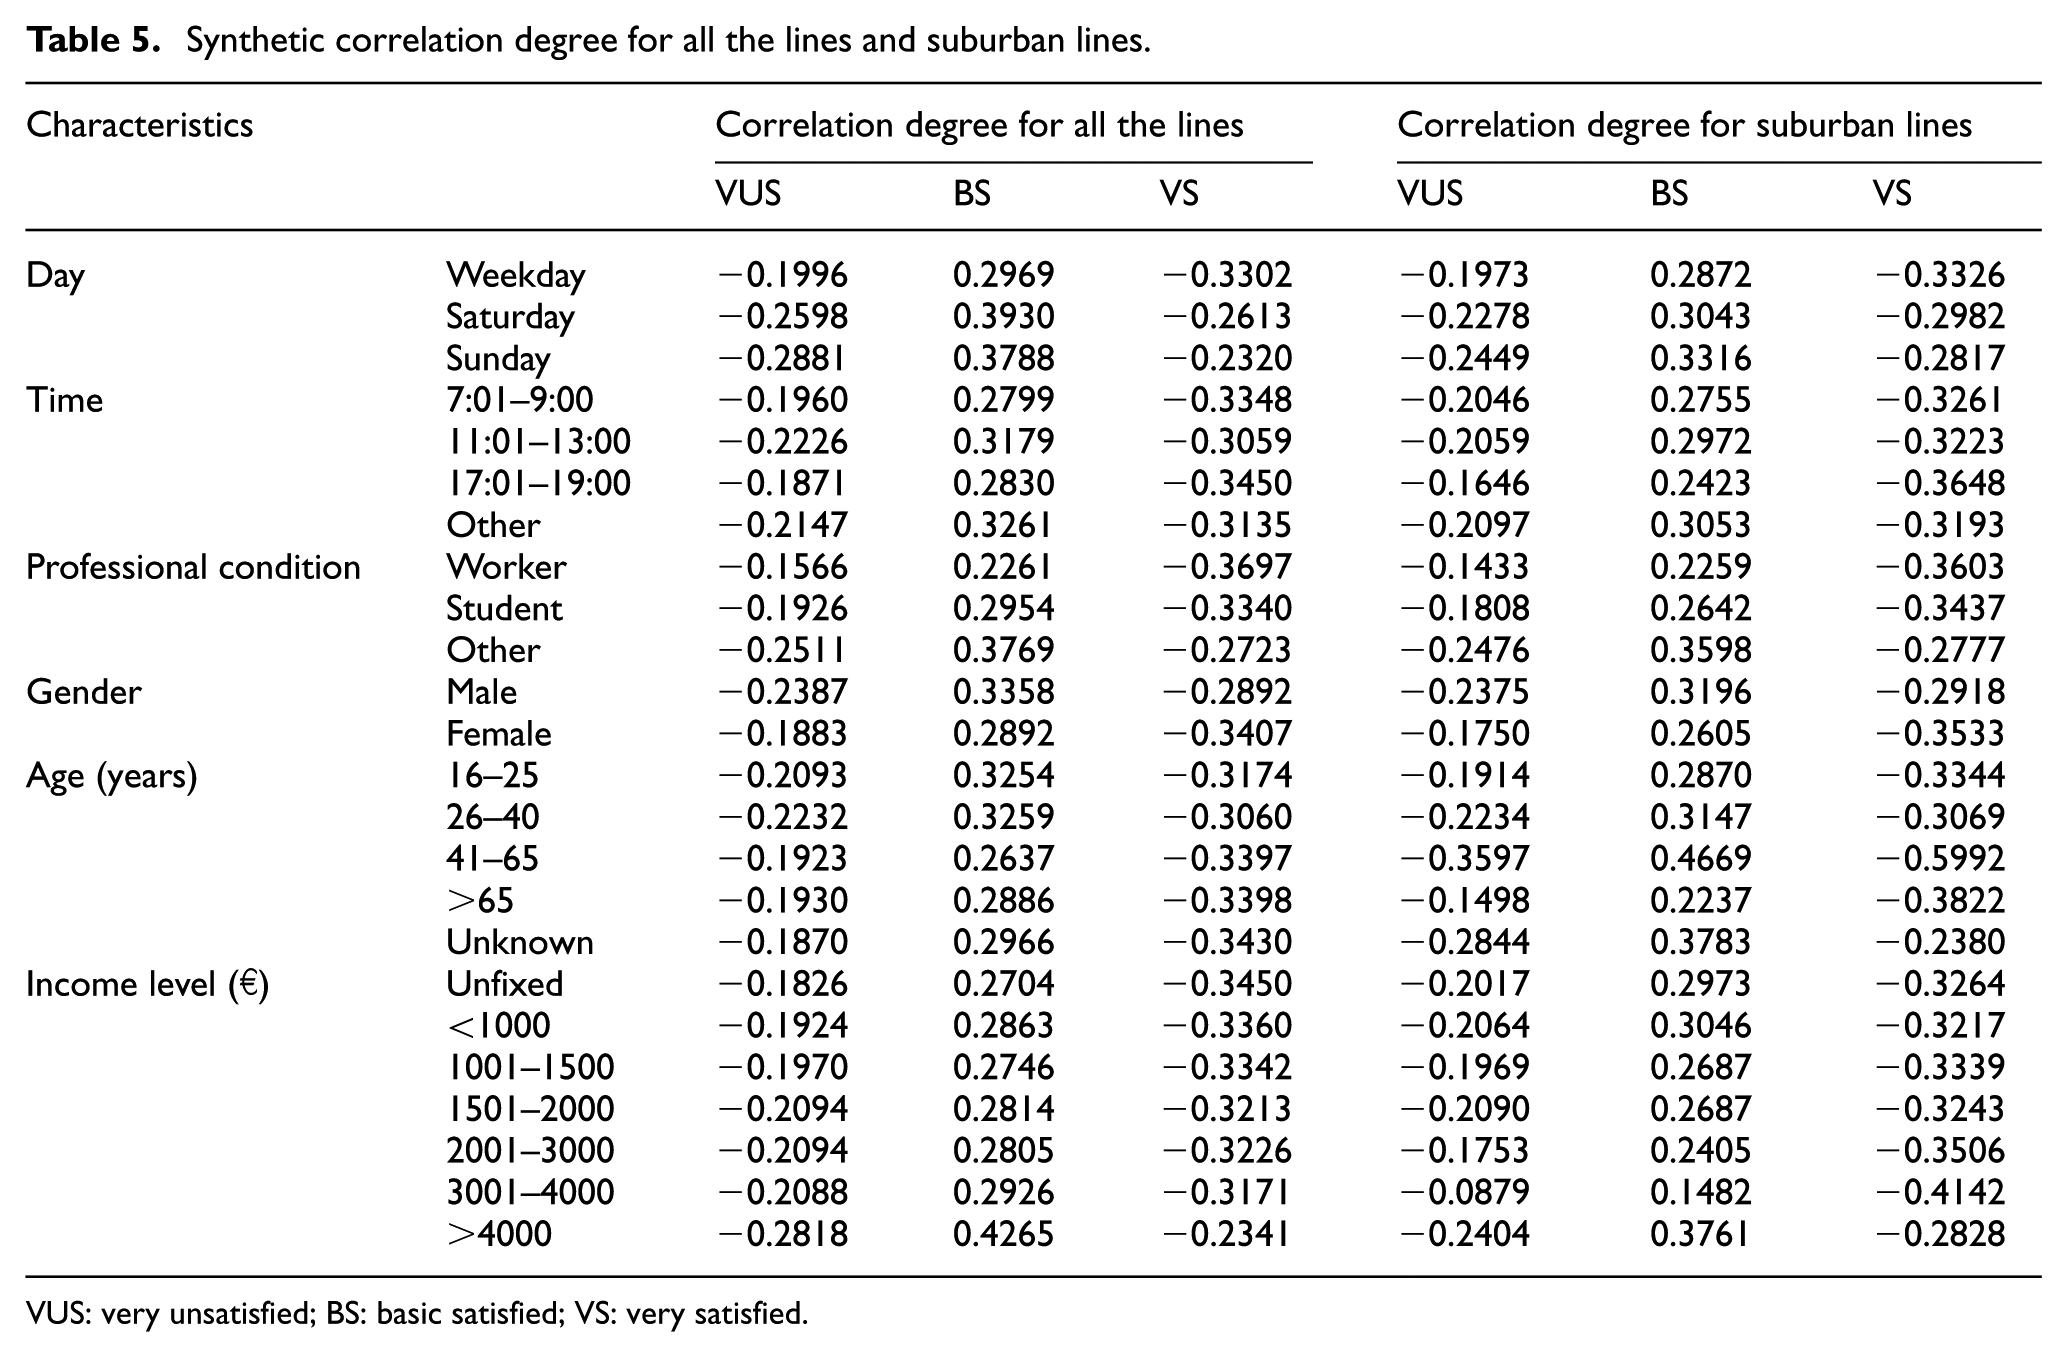
VUS: very unsatisfied; BS: basic satisfied; VS: very satisfied.
By separating the interviewed passengers into different categories according to their travel and socioeconomic characteristics, we can get that all the passengers feel basic satisfied with the railway service. The passengers traveling on the weekday feel more unsatisfied on railway service than on Saturday or on Sunday. The passengers traveling during “17:01–19:00” are most unsatisfied with railway service. The workers feel mostly unsatisfied with the railway service. Definitively, we can conclude that commuter passengers feel more unsatisfied on the railway service than other passengers. Females are more unsatisfied with railway service than males. For the passengers whose age is between 16 and 65 years, young people traveling by suburban lines are more unsatisfied with railway service than the elders, while this difference is not relevant for the whole sample. Passengers traveling by suburban lines who have a high income are more unsatisfied with railway service.
Assessment and income level of passengers of suburban lines
We analyzed two kinds of samples of the suburban lines whose income is between €3001 and €4000, and whose income is lower than €1000, in order to know the difference of the passengers’ satisfaction degree between high- and low-income classes. The correlation degree values of the 26 senior assessment indices are shown in Table 6.
The index system and its value of assessment.

VUS: very unsatisfied; BS: basic satisfied; VS: very satisfied.
By analyzing the correlation degree values of the passengers of the suburban lines whose income is less than €1000, we can know that the passengers are basic satisfied on those 26 service attributes, while passengers with a high income feel unsatisfied with several indices.
Concerning safety assessment indices, both the two kinds of passengers are basic satisfied and near to be very satisfied with the service attributes, so they approve the railway service in terms of safety; particularly, they are most satisfied with the index “safety on the journey.”
Regarding cleanliness assessment indices, passengers with a high income feel very unsatisfied with cleanliness of the carriage, of the seats, and of the toilets, but feel basic satisfied with the indices describing the quality of the stations. However, passengers with a low income feel basic satisfied with all the indices; this fact indicates that wealthy passengers claim to travel in clean places.
Comfort is judged better than cleanliness by both the two kinds of passengers; specifically, “windows and doors working on board” is the most satisfactory index.
Passengers of both the two sub-samples feel basic satisfied with the “service reliability and availability” and the “other” assessment indices; particularly, they are most unsatisfied with “train punctuality” and with “parking in the station of departure.”
Passengers with a high income feel very unsatisfied with the four assessment indices information, especially “clear and fast information on board,” while passengers traveling by suburban lines are basic satisfied with these indices. As for cleanliness, wealthy passengers do not accept services with low levels of information; they would want to travel by train having information on board and in station. On the contrary, people with low income, who probably are constrained to travel by train, do not pay attention to this service characteristic.
Finally, passengers of both the two categories of income feel basic satisfied with the three personnel assessment indices, but passengers with a high income are near to be very unsatisfied with the service attribute, while passengers whose income is less than €1000 are near to feel very satisfied; we can also state that for this aspect of the service, wealthy passengers are more demanding than poor passengers.
Conclusion
The railway operators should know whether the passengers are satisfied with the quality of the main service attributes and then they can improve their service and the overall satisfaction degree of their passengers. We set up a multilevel extensible assessment model to assess the railway service and apply the methodology to some experimental data gotten by an investigation. The application results show that the proposed model is very useful. The correlation degree can fully reflect the distance between the overall railway service quality or one kind of railway service attribute individually and assessment grade. In addition, correlation degree can provide the passengers’ satisfaction degree on the railway service on a whole and on one service attribute. By comparing the correlation degree of one class of passengers with another class of passengers, we can infer the preferences on the railway service attribute of different kind of passengers.
We analyzed two different kinds of sample: the passengers of the whole sample and the passengers of the suburban lines who can be considered as habitual users of the railway services. Specific results indicate that passengers of both the two analyzed samples are basic satisfied with overall railway service quality and with the primary and senior service attributes. More specifically, they are most satisfied with “safety” and most unsatisfied with “cleanliness,”“information,” and “comfort.”
By analyzing the investigation data from groups of suburban passengers distinguished according to the socioeconomic characteristics, we obtained interesting differences between two groups of passengers belonging to different income classes: income between €3000 and €4000 (high income) and less than €1000 (low income). Particularly, passengers with a high income feel very unsatisfied with several indices of cleanliness and information, while passengers with a low income feel basic satisfied with them. We can conclude that wealthy passengers are demanding more than poor passengers; they claim to travel in clean places, by train having information on board and in station, while people with low income do not pay attention to these service characteristics.
The methodology could be easily and conveniently applied to any kind of transit service or services serving different regions or places. As an example, by referring to the railway service in Italy, interesting findings and differences with the services analyzed in this article could be verified if we analyzed the services offered in the southern Italy, which presents a very different and critical reality as regards the northern Italy. Surely, methodology applied to the services of the southern Italy would give useful suggestions for improving the railway service.
Footnotes
Academic Editor: Xiaobei Jiang
Declaration of conflicting interests
The author(s) declared no potential conflicts of interest with respect to the research, authorship, and/or publication of this article.
Funding
The author(s) received no financial support for the research, authorship, and/or publication of this article.