
Abstract
Failure mode and effects analysis and value engineering are well-established methods in the manufacturing industry, commonly applied to optimize product reliability and cost, respectively. Both processes, however, require cross-functional teams to identify and evaluate the product/process functions and are resource-intensive, hence their application is mostly limited to large organizations. In this article, we present a methodology involving the concurrent execution of failure mode and effects analysis and value engineering, assisted by a set of hierarchical functional analysis diagram models, along with the outcomes of a pilot application in a UK-based manufacturing small and medium enterprise. Analysis of the results indicates that this new approach could significantly enhance the resource efficiency and effectiveness of both failure mode and effects analysis and value engineering processes.
Keywords
Introduction
Competition has led manufacturing organizations to move up the value chain 1 by delivering high-quality, innovative products while maintaining costs at competitive levels.2,3 Failure mode and effects analysis (FMEA) and value engineering (VE) were introduced during World War II and they equip the “toolbox” of many major quality management systems. Both FMEA4,5 and VE6,7 require the collaboration of different business functions such as marketing/sales, quality, design, and operations. 8 Moreover, they require a sufficient level of functional understanding and the ability to abstract from the users/participants, as the lack of these abilities adversely affects the effectiveness and efficiency of these methods.8–11
Due to their cross-functional collaborative nature, both FMEA and VE processes are considerably resource-intensive, and for this reason, their use is often limited to large organizations. 12 Accounting for ∼50% of both UK’s and US’s gross domestic product,13,14 the authors argue that the importance of small and medium enterprise (SME) highlights the need for the development of methods tailored to their needs and constraints.
The functional analysis diagram (FAD) method, originally developed to assist design methodologies such as VE, TRIZ,11,15 and FMEA, is a visual representation of decomposed systems, providing a format and a specified set of simple rules to perform functional analysis of all functions of a system (Figures 2 and 3). FAD is compatible with images, three-dimensional (3D) models, and sketches allowing an illustrative representation of system’s components, and several case studies report excellent results of the method on assisting interdisciplinary collaboration within cross-functional teams.16–19
This article presents the process and the outcomes of a pilot introduction of a methodology combining FMEA and VE assisted by a set hierarchical FAD models, aiming to improve the efficiency of both processes. This methodology was based on FMEA-FAD, 19 a methodology developed to improve the resource efficiency and effectiveness of the first phase of the FMEA process. FMEA-FAD was first introduced in March 2014 and is the standard FMEA practice in the company ever since.
Aims and objectives
The primary aim of this work was to develop a FAD-assisted methodology combining FMEA and VE or VA in a single process and evaluate its resource efficiency in a manufacturing SME.
Background
FMEA
FMEA processes4,5,8 can be used for products or processes to identify and address any potential failure modes (ways in which the product or process may become dysfunctional or non-functional). FMEA is a cross-disciplinary process and involves the assessment of a product or process in a holistic manner. Generally, FMEA processes can be divided into three main phases:
The identification of a system’s (product or process) functions and potential failure modes (in which ways can a system or component fail to deliver). The use of function block diagrams and flowcharts to study the components of the product/process is recommended for assisting this stage.
Risk evaluation (risk priority number (RPN)) of each component’s potential failure mode. RPN calculation is based on the perceived severity and potential occurrence of a failure mode, as well as the ease of detection during production. A generic FMEA spreadsheet is available from several sources such as the ASQ website. 20
Plan and perform corrective actions and evaluate the resulting improvements using an FMEA spreadsheet tool.
FMEA has been subject to criticism, most of which relates to the absence of a structured method for identifying a product’s primary functions (phase A) and subsequently the key failure modes4,19,21,22 which, in turn, results in two major issues:
The process fails to capture all key failure modes.
The process can be long and tedious, discouraging companies and individuals from performing the process regularly.
VE/value analysis
VE/value analysis (VA)7,8 is an interdisciplinary quantitative approach that focuses on improving the effectiveness and efficiency of the functions of a product, process, or organization. While VE concerns new products, VA is applicable to the existing products or processes. 6 However, as new products are often based on the existing products, the differentiation between the two can be challenging. According to this theory, the value (V) of a product/process is defined to be the ratio of its function (fit for purpose) to cost (value = function/cost) and can be increased either by improving the functions to better deliver the product’s goals or by reducing its cost.
However, the effectiveness of the solutions (on improving functions) yielded by this process lies in the users’ ability to identify a system’s functions at higher orders of abstraction. 10 As with FMEA, VE/VA processes conducted by inexperienced team members can be inefficient due to failure in identifying the primary, abstract functions of the product process in question.
Functional modeling
VE and the functional flow block diagram were two of the first methodologies involving the use of functional models widely used in classical systems.8,23 In the VE method, 7 each function is simply represented by the combination of an active verb and a measurable noun. This has been adapted by the majority of functional modeling methods such as the function tree, data flow diagram (or function flow diagram), and function structure and function analysis system technique (FAST).
Unlike most functional modeling methods, FAD is a form-dependent functional modeling method. 24 Each node (block) represents a part and not a function (as with the form-independent models). The nodes are connected to annotated arrows (see Figure 2), which denote the function performed by each component, its functional relationship with other components, and the type of function performed. FAD models support three types of functions: useful (as designed), harmful (undesired by products of useful functions), and insufficient functions.
Although it could be argued that form-dependent methods may be unsuitable for the development of “original” designs, they can be highly effective for assisting processes involving the functional analysis of the existing systems such as FMEA. 19
Methodology
This work is a result of a 5-year participatory action research program 25 in a UK-based manufacturing SME where functional decomposition and, in particular, the FAD method were introduced for assisting product design and manufacturing quality optimization processes. The findings of this research agree with those published by a number of researchers,21,22,26 regarding the efficiency issues of the FMEA process (see section “FMEA” of this article). Moreover, the findings indicated the lack of communication between different organizational functions 27 as a significant constraint on the efficiency of cross-functional processes such as FMEA and VE.
The methodology proposed in this article was based on the FAD-FMEA methodology, 19 initially developed to optimize the first phase (phase A) of FMEA by assisting cross-functional teams in the understanding of product functions. The process is now company standard for all FMEA processes conducted in the company. As both FMEA and VE methods involve the analysis of product functions and their criticality to the end-user, we propose a single process with a dual output:
The identification of high-risk components/processes (highest RPN values) for reliability improvement purposes (FMEA);
The revealing of any superfluous components (lowest RPN values) that could be safely downgraded (Figure 1) to reduce unnecessary costs (VE).

FAD-assisted FMEA-VE process: FAD models assist on the first phase of the FMEA process by “filtering” the input to the tabular tool. For the third phase, the process has an additional to the standard FMEA process output.
The second improvement for the FAD-FMEA process arose from feedback received from the participatory action research. FAD models of the systems presented in a single map can be confusing and difficult to read, especially when modeling complex systems. For this reason, a hierarchical FAD model structure was developed 28 to improve clarity using a single map for each level of abstraction (Figure 2).

Hierarchical FAD model structure 28 showing a hair-dryer at top, sub-assembly, and part level.
In detail, the proposed process involved the following steps. The exact number of sessions required will depend on the complexity of the product assessed:
Prior to the sessions, develop FAD models of the product at top, sub-assembly, and part (template) levels, such as the ones shown on the top center and bottom of Figure 2, respectively. A team or an individual can develop the models; for information on the software requirements, see section “FAD model development.”
During the first session, use the product’s top-level FAD (Figure 2, top) to define and evaluate its primary product functions (e.g. light bulb: (a) emits light, (b) emits heat). The sales or customer representatives and the design team members have a primary role during this step.
Examine the sub-assembly/system-level FAD (Figure 2, center) and complete the (partially complete) model by adding or modifying functions. Based on the primary function(s) evaluation from Step 2, identify the most critical sub-assemblies and use the FMEA spreadsheet tool to evaluate their criticality (RPN) at assembly level. The quality and operations representatives have a primary role during this step.
Repeat Step 3 for the sub-assemblies performing the least critical functions (VE) and associated components, to evaluate and prioritize by their lack of criticality.
Develop FAD models for each of the sub-assemblies prioritized by Steps 3 and 4 to analyze their criticality (or lack of it) at part level (Figure 2, bottom) using the FMEA spreadsheet (see Table 1). Every sub-assembly should be clearly separated in a different section or pages of the spreadsheet and its components grouped by the function they perform (see FMEA results of the “piston” part on Table 1).
The parts scoring the highest RPN should be considered for redesign or increasing quality controls (standard FMEA process). The ones scoring the lowest RPN should be considered for downgrading their quality (i.e. removing superfluous features, downgrading materials, using wider manufacturing tolerances).
FMEA session results for the piston sub-assembly.

The components were grouped based on the function they perform and prioritized based on severity.
RPN: risk priority number; light green: low criticality; dark red: highly critical.
The number of sessions required is dependent on the complexity of the product/system in question and the number of new sub-systems employed by it.
Measurable criteria
The measurable outcomes of this work were defined to be as follows:
Quantitative
Resource efficiency—the person-hours and any other resources used for the process were to be measured and compared against any previously conducted FMEA and VE sessions.
VE output—the captured “over-engineered” components in the system were to be measured to estimate any potential cost savings from “downgrading.”
FMEA output—the captured high-risk components were to be measured to estimate the potential compensation and reputation savings from the early identification of any critical design flaws.
Qualitative
The effectiveness of the proposed methodology was to be assessed through a follow-up questionnaire (Table 2) and interviews in terms of (a) assistance in understanding product functions, (b) method intuitiveness/compatibility with cross-functional teams, (c) time efficiency, and (d) user/participant satisfaction. Responses to all the items on the questionnaire were recorded on a 5-point Likert-type scale (l = strongly disagree, 5 = strongly agree).
Survey results (six participants).
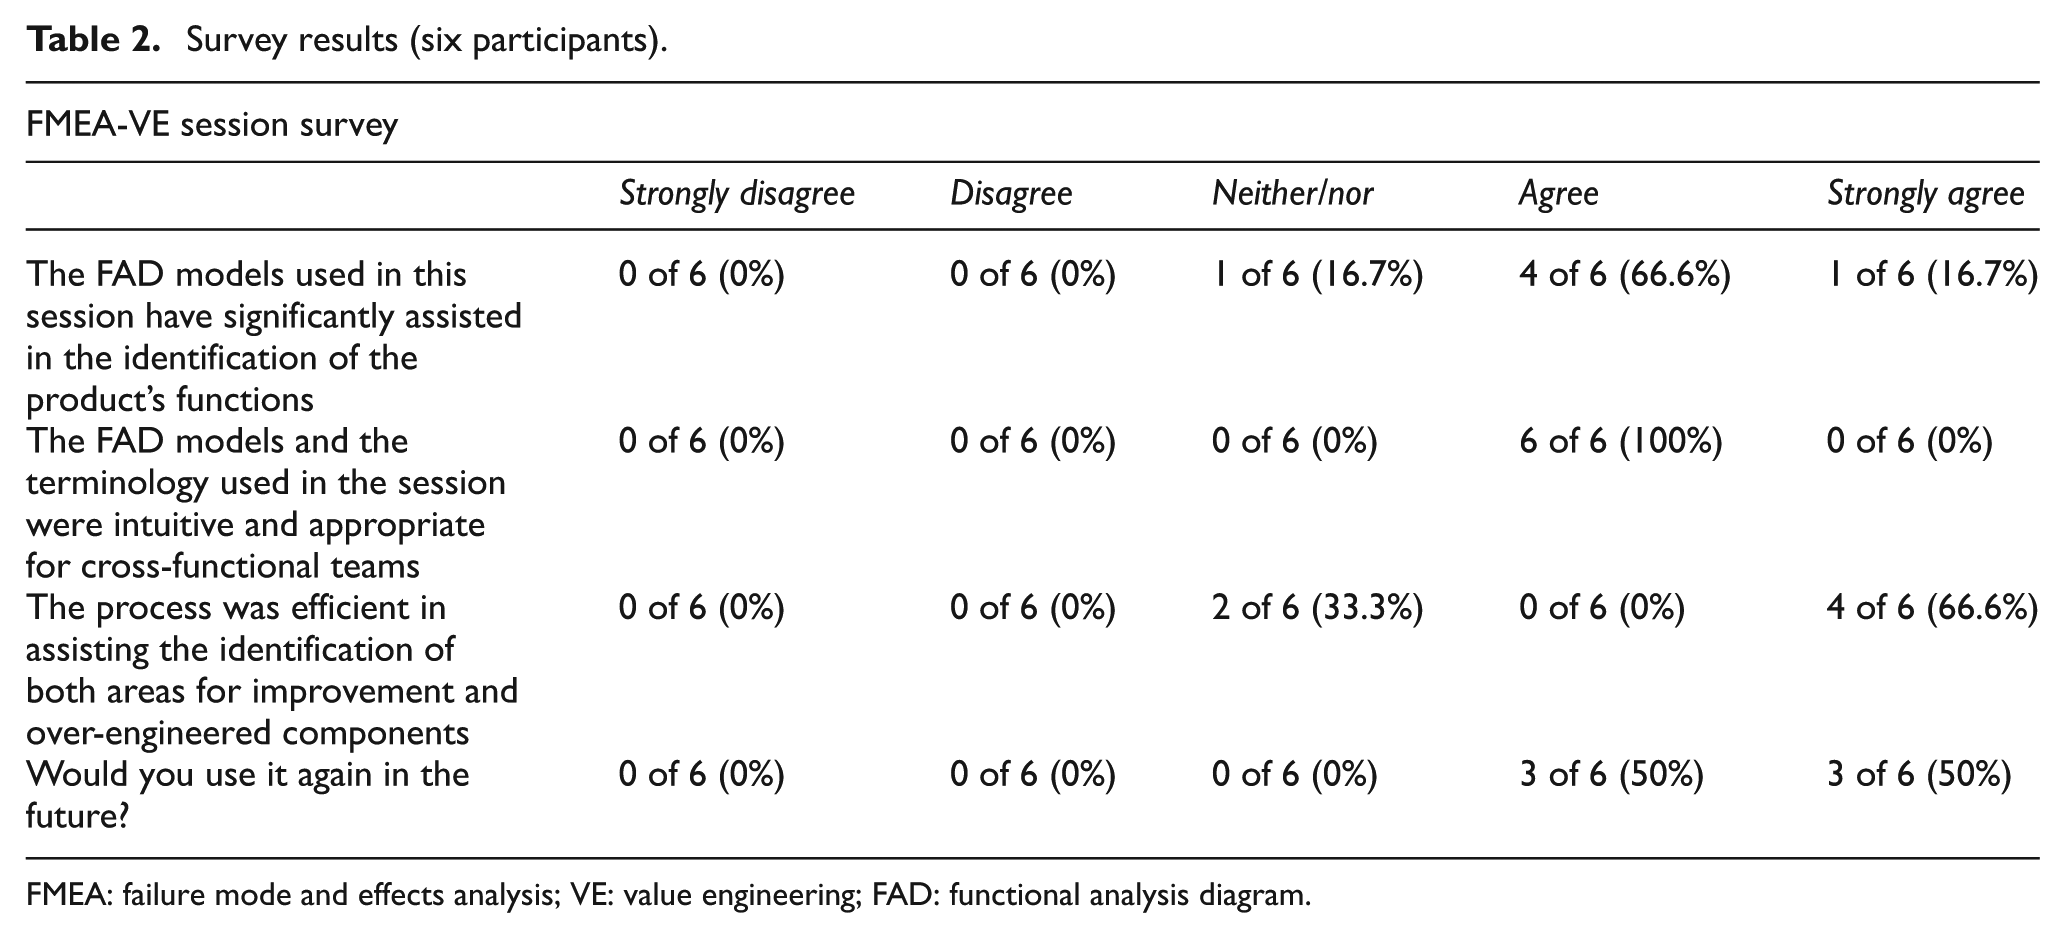
FMEA: failure mode and effects analysis; VE: value engineering; FAD: functional analysis diagram.
Case study—results and discussion
Background and intervention plan
The case study described in this article involves the application of the proposed methodology at a UK-based gas spring and damper manufacturing SME, aiming to optimize the reliability and production costs of a newly developed product. The product in question was a new lockable gas spring product at its development testing stage. While there was no direct knowledge of the potential failure modes of this product, known failure modes of similar products and parts could be used by analogy where appropriate.
The process involved six participants from sales (first session only), design, operations, and quality departments. Excluding the principal researcher and facilitator of this study–who was also leading the design team at the time—none of the participants had experience with VE techniques. In addition, their experience on the FMEA process was limited to two previously conducted sessions, one using the traditional FMEA and the other the FAD-FMEA process. 19
The cost/time efficiency of the proposed methodology was seen as of paramount importance due to resource limitations often seen in SMEs. In collaboration with the operations management, the study was planned to be conducted in two 90-min sessions. The first session was to include Steps 1–4 of the methodology (see section “Methodology”) and the second session was to include Steps 5 and 6.
FAD model development
The FAD models shown in Figures 3 and 4 were developed using the hierarchical FAD model structure illustrated in Figure 2. The model shown in Figure 3 and the template for the part-level models such as the one given in Figure 4 were developed by the principal researcher prior to the sessions and completed during the sessions collaboratively.

Top and sub-assembly level FAD of the product. The top level depicts the product, its user, and operating environment. The sub-assembly level illustrates the product’s sub-assemblies, the functional interactions between them, and to the top-level functions.
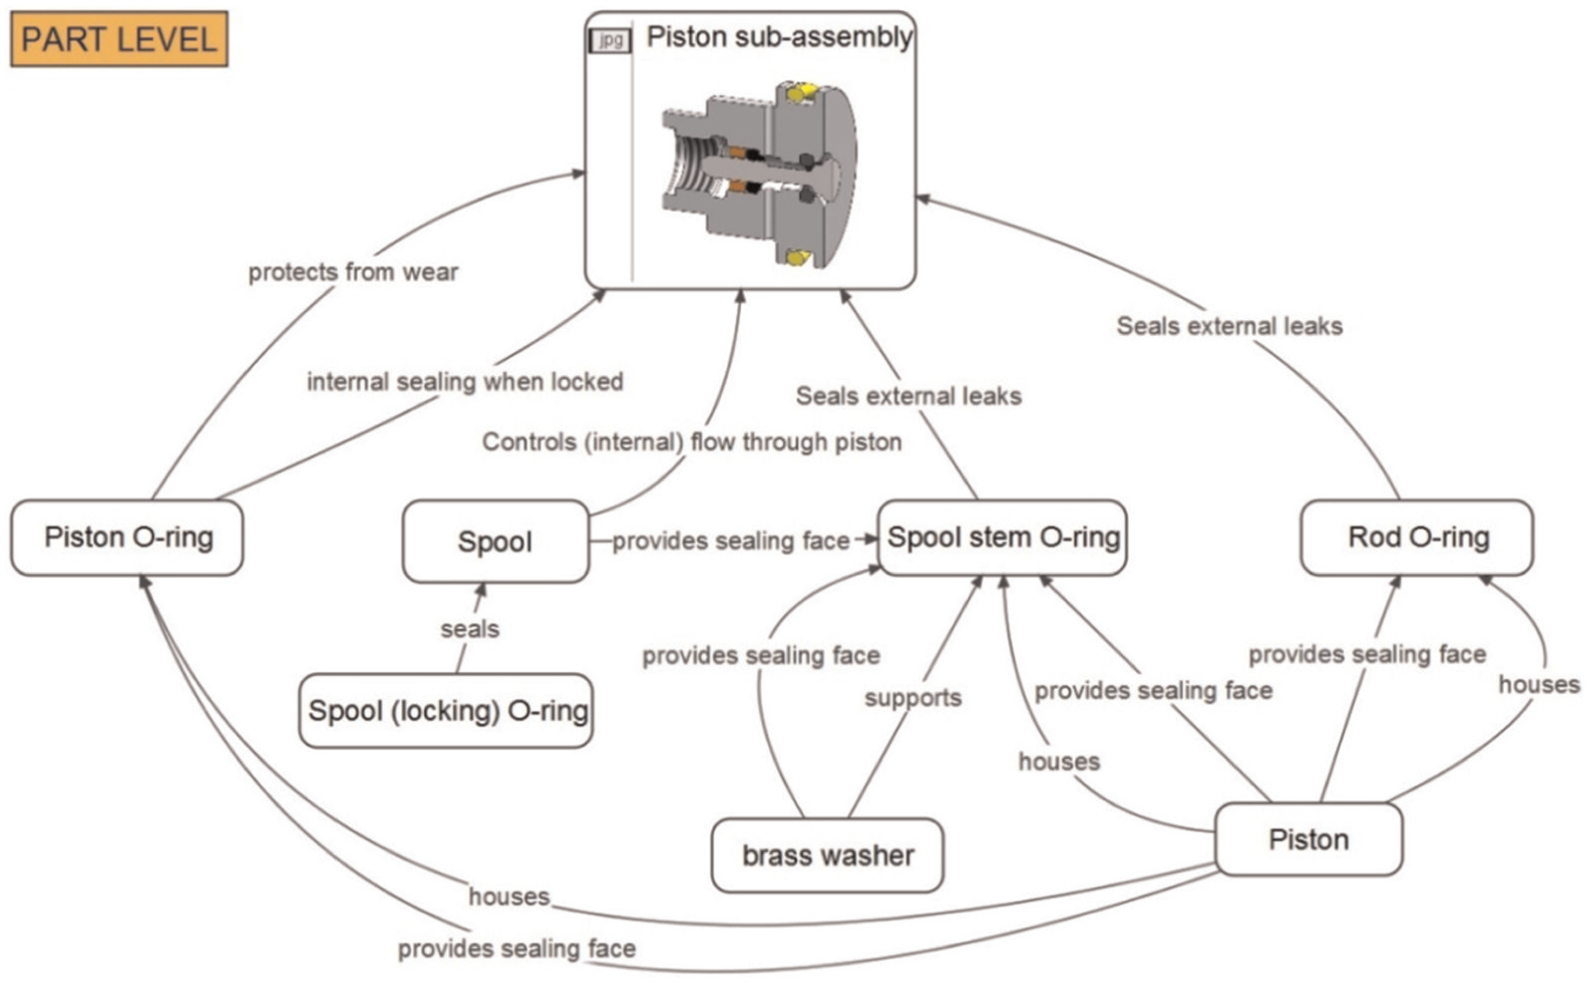
FAD model at part level.
All models shown in this article were developed using the “DesignVue” software package, 29 which is freely available from the Imperial College London, Design Engineering Group website. However, a number of available proprietary (e.g. MS PowerPoint) or the open-source software (e.g. DIA) could be used instead.
The intervention
Session 1
As defined in section “Methodology” of this article, the first session started with the analysis of the product’s primary functions (Step 2) using the top-level FAD model of the locking gas spring product shown on the top of Figure 3. At this stage, the input of the sales representative was essential, as he provided an insight of the customers’ expectations (primary functions) from the product, often unknown or misaligned to the understanding of members of other business functions (departments).
During Step 3, the participants examined the sub-assembly level FAD model (Figure 3, center) and most of them contributed in refining some function descriptions. The FMEA spreadsheet tool was then used to evaluate their criticality based on the severity, occurrence, and detection controls’ information provided by all participants. This step identified the piston and rod sub-assemblies to be of high risk (high RPN values).
During Step 4, it is noteworthy that while the investigation for design flaws was something natural to the participants, the investigation for components performing more than satisfactorily has initially introduced some discomfort to all participants, raising some concerns about the effectiveness of the method. However, when the resulting (from Step 3) RPN values of the remaining sub-assemblies were examined, the floating piston sub-assembly was identified as the one with the lowest RPN value.
Session 2
In this session, the part-level FAD templates were used to develop FAD models for the two sub-assemblies identified as critical in Step 3, the piston (Figure 4) and rod sub-assemblies. The FAD development process ran smoothly and efficiently with the majority of the participants actively contributing with part function descriptions. Surprisingly, during the FMEA analysis of the piston part (Figure 4), a member of the design team identified a superfluous machined feature on the piston part. The feature formed a “step” into the piston, a legacy feature carried from a similar piston design with no useful function to this product. Removing this feature would save two machining operations (tool change and drilling) resulting in an approximately 7% cost saving.
As dictated by Step 5 of the process, a separate sheet of the FMEA spreadsheet was used for each of the two sub-assemblies and the parts were grouped based on the function they perform (see Table 1). The resulting RPN values identified two parts that required further attention, the piston seal-housing feature and a sealing groove on the rod part. Moreover, in addition to the piston feature identified during the FAD model analysis, two excessively “tight” dimensional tolerances on the piston and rod part were highlighted by the low RPN values. An approximate 10% manufacturing cost saving on each part was estimated as the result of “relaxing” the dimensional tolerances on the piston and rod parts. The analysis of the separator piston assembly identified in Step 4 has identified the part as over-engineered for the application and a material review was planned.
Results’ summary
Quantitative results
The time values in this section derive from time measurements of the sessions and their comparison to the measurements obtained on a previous study. The part cost optimization values are the estimates obtained in collaboration with the company’s operations management.
The section letters correspond to the measurable criteria defined in section “Methodology” of this article.
The process was completed in two 90-min sessions as planned. The total resources used were summed to 18 person-hours including the time spent on developing the models, which were 50% higher and 25% lower than the previously conducted FAD-FMEA and traditional FMEA sessions, respectively. 19 Taking into account its dual output, it could be stated that the FAD-assisted FMEA-VE process was 25% and 75% more efficient than the FAD-FMEA and the traditional FMEA process, respectively.
The identification of a superfluous feature on the piston part saved a tool change and a drilling operation during machining, resulting in an approximate 7% machining cost reduction. The identification of over-engineered tolerances resulted in an approximate 10% manufacturing cost reduction on each piston and rod parts.
The corrective actions implemented as a result of the identification of the two critical part features have saved potential reputation and compensation costs.
Qualitative results
The results reported in this section were extracted by a survey (see Table 2) and from the research-diary recorded by the facilitator during the study. Each identifier (a–d) corresponds to the survey questions.
The hierarchical FAD models used on this case study have assisted the majority of the participants (73%) to identify product functions.
Moreover, all participants agreed that the models used were intuitive and appropriate for cross-disciplinary teams. Although there was no preparation of the participants on the session specifics, the proposed methodology was readily adopted by all participants.
Although the majority (67%) found the process very efficient, some stated that the process was still taking too long and proposed that a participant preparation session would benefit the process. When interviewed, a member of the design team stated: “The process has helped me to focus on the function of each part and feature, allowing for potential flaws to be identified were previously missed.” Moreover, a member of the operations team stated that “the process has significantly assisted the team to highlights weaknesses, failure modes and on the other hand cost savings that perhaps are not identified during our everyday processes.”
Finally, all participants stated that they were happy to use this process in the future.
Future work
The data collected from this case study have highlighted areas where improvement was required and yielded two potential efficiency improvements: (a) introduce a participant preparation document and (b) develop a commonly used part’s FMEA results’ database to improve the efficiency of future sessions.
Due to the size of the organization, the sample size was relatively small. Further testing at the same and other manufacturing organizations is required to fully validate the effectiveness of this methodology.
Conclusion
The methodology presented in this article intended to improve the resource efficiency of FMEA and VE applications, mainly by assisting users—regardless of their business function—in abstracting the requirements for a product or process. It also aimed to provide a framework to analyze the criticality of each component. The results of the present case study exhibited a resource efficiency improvement in the order of 75% in comparison to previous FMEA sessions within the same organization. Moreover, participants stated that they found the method to be useful in identifying both high-risk and over-engineered components and expressed an interest in using it again. The results also suggest that the methodology proposed here has high potential on improving the FMEA process, further strengthening the case for further exploratory work in this direction.
Footnotes
Academic Editor: Teen-Hang Meen
Declaration of conflicting interests
The author(s) declared no potential conflicts of interest with respect to the research, authorship, and/or publication of this article.
Funding
The author(s) disclosed receipt of the following financial support for the research, authorship, and/or publication of this article: The Article Processing Charges (APC) for this article were funded by the EPSRC.