
Abstract
Due to the characteristics of unsteady flow in the centrifugal pump at low flow rate is not revealed well, a simulation of the internal flow at different flow rates is carried out with renormalization group k–ε turbulence model and multiple reference frame. For analyzing the influence of flow rate, ratios of flow rate (Q/Qd) are set to 0.1, 0.3, 0.6, and 1.0 at this study. The hydraulic performance of the centrifugal pump obtained by numerical calculation has matched well with the corresponding experimental result. From the characteristics of the internal flow captured by the numerical simulation, it can be seen that backflow occurs in the inlet of impeller at low flow rate, which prevents fluid discharging into impeller passages and leads to vortical structures in suction region. With further decrease in flow rate, the strength of backflow has been intensified, and the number of vortex has significantly increased. A visualization experiment of the backflow evolution in suction pipe is carried out to validate the unsteady simulated results. Results show that the prerotation is an important factor for the deterioration of centrifugal pump performance.
Introduction
Centrifugal pumps are widely used in different manufacture departments such as agriculture, power plants, and petroleum chemical industry. 1 Accordingly, the operating conditions varied widely. Due to the change of system device, centrifugal pumps are usually used to work at off-design conditions. In most of the cases, centrifugal pumps operate at low flow rate. At this time, a variety of unstable patterns such as flow separation, backflow, and rotating stall will occur, which will greatly lower the efficiency of pump, even out of operation. In order to obtain inner flow characteristics, many researchers applied experiment and simulation to investigate the unstable flow. Pedersen et al., 2 Liu et al., 3 and Akhras et al. 4 applied the laser Doppler velocimetry (LDV) technique to measure the velocity field of the impeller passages and reported that flow separation occurred in blade surfaces under off-design conditions. Hong and Kang 5 and Hagelstein et al. 6 studied the unsteadiness of the flow field at the impeller exit and volute separately to research the pressure distribution in the case of impeller–volute interaction. The numerical simulation made by Siekmann and colleagues 7 showed that the strong secondary flow can be observed in volute casing. Byskov et al. 8 simulated a six-blade impeller with shroud. It was found that a steady rotating stall phenomenon was observed in the entrance at off-design point. H Dou et al. 9 found that instability was easier to be excited near impeller outlet area and volute tongue in a centrifugal pump. J Mao et al. 10 investigated the mechanism of hump, and the relationship between head and inner flow distribution was established. J Zhang et al. 11 used the numerical simulation to analyze the velocity distribution of the recirculation flow field and the vortex morphology. It was found that high-pressure water injection can effectively control inlet recirculation and improve the velocity distribution in inlet flow field. H Ma et al. 12 adopted particle image velocimetry (PIV) system to test the flow in a centrifugal pump. The results showed that low speed area at the pressure side of the impeller blade increased rapidly, and vortex appeared at blade pressure surface of several channels when performance curve appear hump. J Pei et al. 13 found that stronger flow unsteadiness in a pump occurred near blade suction side, and in the wake flow area, the flow varies with time strongly. B Gao et al. 14 simulated the unsteady flow characteristics in the single-stage volute centrifugal pump. It showed that the flow separation phenomenon occurred under small flow rate condition and vortex occurred under large-scale separation. Y Ren et al. 15 applied PIV to research flow instabilities of centrifugal pump. It showed that the flow was separated at 0.6Qd, developed at 0.4Qd, and spread almost the whole impeller passage at 0.1Qd. W Shi et al. 16 simulated inlet prewhirl flow in centrifugal pump and found that the circumferential velocity at the exit of guide vanes increases with the enhancement of the inlet prewhirl. J Yuan et al. 17 researched the inlet recirculation characteristics of centrifugal pumps. The onset of the recirculation in the pump inlet was at 0.6Qd. R Zhu and M Ou 18 studied reverse flow in double-suction centrifugal pump. The curve obtained from simulation accords with the theory analysis and experimental curve. To disclose the development of flow separation, PIV was applied by X Wu et al. 19 to measure the inner flow field in a centrifugal pump. When the flow rate was smaller than 0.6Qd, the flow separation began to occur and that developed fully under 0.2Qd. Numerical simulation was used to investigate the unsteady flow in a centrifugal pump by Y Wang et al. 20 It was found that the dominant frequencies were the rotational frequency fi or 2fi in the impeller and the blade passing frequency fBPF in volute.
Model and numerical method
Turbulence model
Considering high Reynolds number of the flow in pump, renormalization group (RNG) k–ε turbulence model is chosen to close the Navier–Stokes equation. The equation is shown as follows

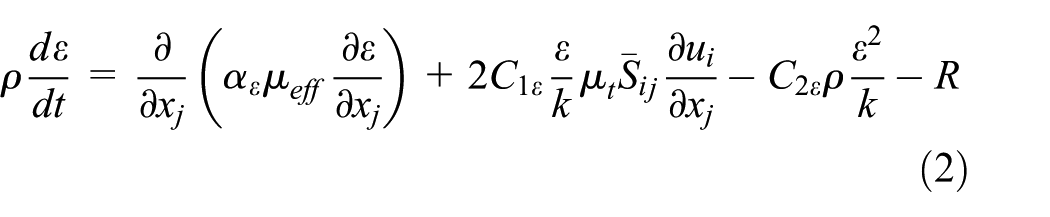


where k is the turbulent kinetic energy, ε is the turbulent kinetic energy dissipation rate, µ is the fluid dynamic viscosity, µt is the turbulence viscosity coefficient, µeff is the effective viscosity,
Solution configuration
The commercial code Fluent 16.0 is employed to solve the three-dimensional incompressible Navier–Stokes equations. The pressure–velocity coupling is calculated based on the SIMPLEC algorithm. Second-order, upwind discretization has been used for convection and central difference schemes for diffusion terms. The residual criterion is set to 1e−04.
Boundary conditions
The velocity inlet boundary conditions are applied at the inlet of the suction region. The inlet velocity is calculated according to volume flow rate and impeller inlet diameter. The outflow boundary conditions are adopted at the outlet of discharge region. Surfaces between inlet–impeller and impeller–volute are defined as the grid interfaces. The present numerical simulation is carried out with multiple reference frame. Nonslip boundary conditions are used for the near-wall function.
Geometry model and grid
The main parameters of the centrifugal pump are shown in Table 1. A three-dimensional model was built by applying Pro/E software.
Main parameters of the pump.

The numerical simulation model of the pump is shown in Figure 1(a). It includes suction pipe, impeller, and volute. The generated grid can be seen in Figure 1(b). The whole flow field is meshed with unstructured tetrahedral grid.
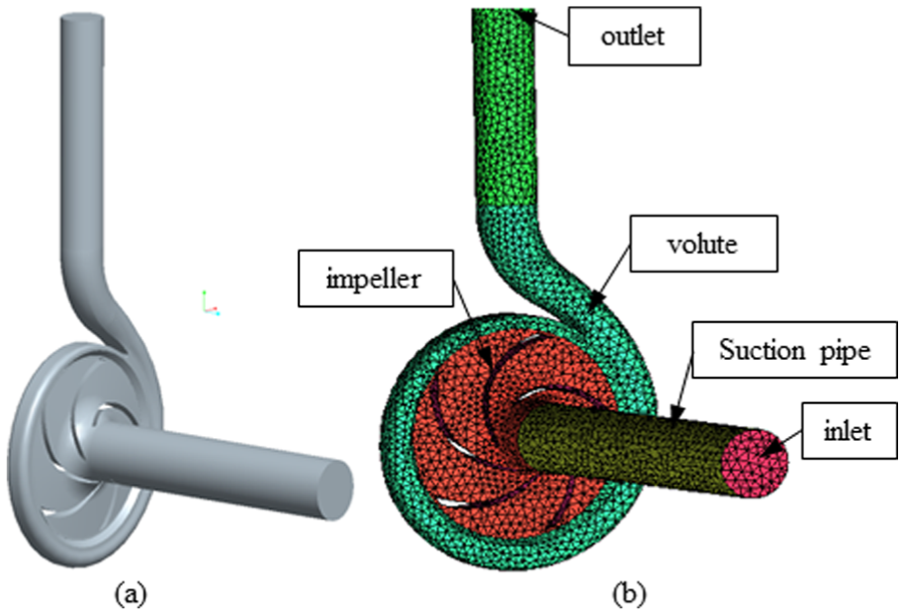
(a) Calculation domain and (b) grid.
In order to make numerical simulation results more accurate and credible, the grid independence of the model was carried out. Based on eight computational grids, the influence of mesh number on the head prediction of this centrifugal pump is analyzed. The head at the design condition for eight computational grids is presented in Figure 2. It is found that head remains almost constant when the number of mesh reaches approximately 2.2 million. Therefore, the mesh selected for simulation is composed of 772,577 nodes and 2,215,391 cells.

Curve of grid independency analysis.
Experimental verification
In order to confirm the computational results, performance and visualization experiments had been carried out. The suction pipe was made of transparent material. A high-speed camera, whose model was pco.dimax HD, was used to capture the flow pattern in the suction pipe. The camera exposure time was set to 0.5 ms in this experiment. The test loop is shown in Figure 3.

Test loop.
The performance curves of this pump are presented in Figure 4. The simulated results are matched very well with the experimental data. At design flow rate, the head of computational fluid dynamics (CFD) and experiment are 20.62 and 19.97 m, respectively. The efficiency of CFD and experiment are 69.75% and 66.28%, respectively. The comparison of head and efficiency errors between numerical prediction and experiment is shown in Table 2. It is found that the prediction head is close to the experimental value at different flow rates. However, the efficiency error value between prediction and experiment is increased with the decreasing flow rate. Both of maximum relative deviations between head and efficiency are under acceptable error band, so that the method of numerical simulation can apply to investigate the complex inner flow of centrifugal pump at low flow rate.

Comparison of numerical and experimental results: (a) head and (b) efficiency.
Head and efficiency errors between numerical prediction and experiment.
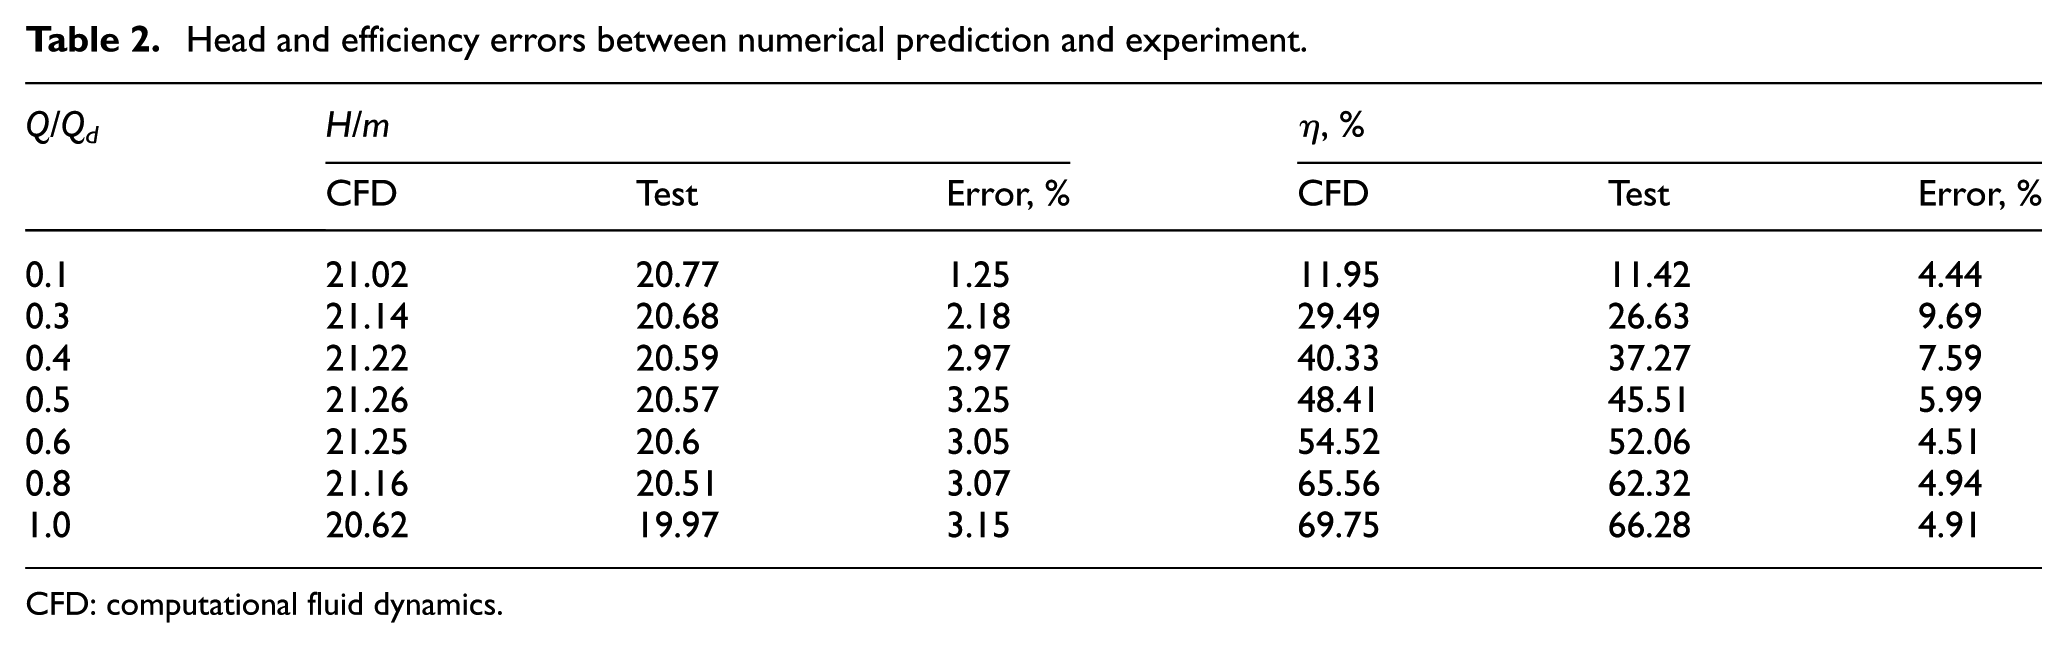
CFD: computational fluid dynamics.
Results and discussion
The change of circumferential velocity and axial velocity in the suction pipe at different flow rates is shown in Figure 5. L is the distance from the impeller inlet to the monitoring point, and R is the inlet radius. L/R = 0 and L/R = 10 denote separately the position of impeller inlet and the suction pipe inlet, respectively.

(a) Circumferential velocity and (b) axial velocity in the suction pipe at different flow rates.
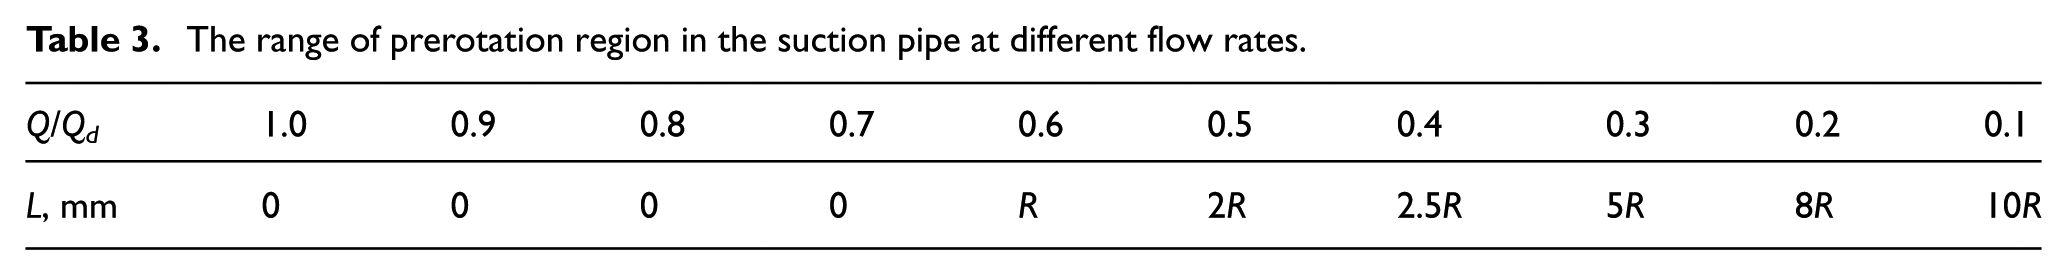
In Figure 5(a), it is found that the values of circumferential velocity are basically zero when flow rates change from 1.0Qd to 0.7Qd. As flow rate decreases to 0.6Qd, a small non-zero circumferential velocity occurs at the impeller inlet. It indicates that prerotation phenomenon occurs. The range of prerotation region on the different conditions is shown in Table 3. Meanwhile, prerotation phenomenon also induces the axial velocity that is opposite to mainstream. Negative value of the velocity represents the same direction as the mainstream in Figure 5(b). It can be seen that the axial velocity changes obviously when flow rate is smaller than 0.6Qd. The axial flow velocity opposite to the direction of the main flow occurs. It means that backflow occurs.
The range of prerotation region in the suction pipe at different flow rates.
As illustrated in Figure 5, flow patterns change significantly when flow rate is smaller than 0.6Qd. Therefore, in order to further analyze the development of flow pattern at low flow rates, visualization experiment is carried out according to the flow rates 0.6Qd, 0.3Qd, and 0.1Qd separately. The experimental results are shown in Figure 6.
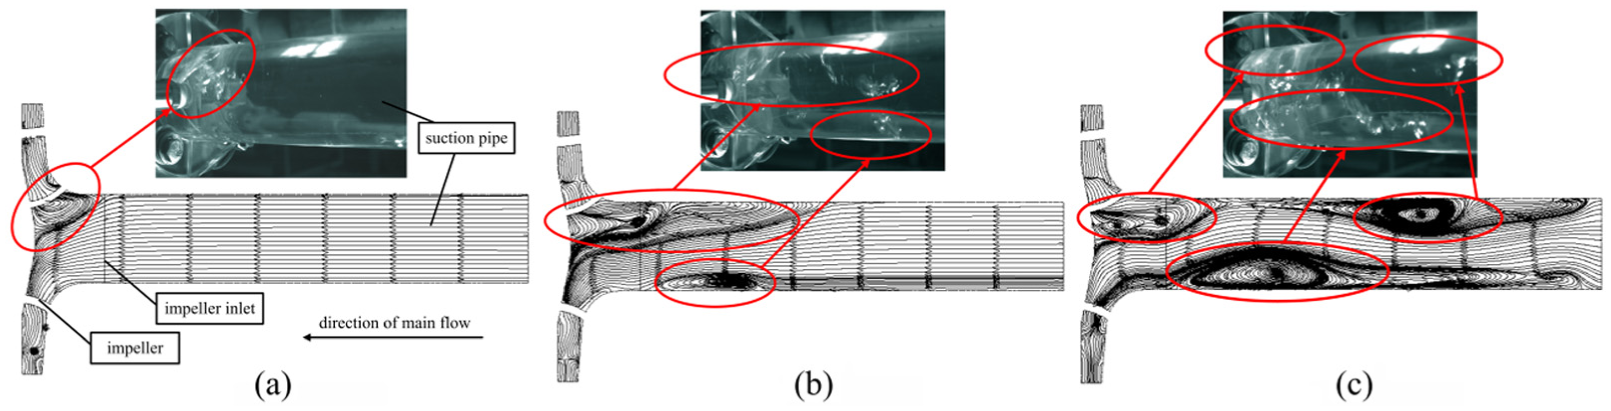
Streamline in the suction pipe: (a) Q = 0.6Qd, (b) Q = 0.3Qd, and (c) Q = 0.1Qd.
At Q = 0.6Qd, the streamline from the inlet of suction pipe to impeller inlet is quite stable. And, backflow only can be observed at the inlet of impeller, which has no obvious influence on the pattern of the suction pipe. When centrifugal pump operates at low flow rate, the change of the relative velocity and the pressure gradient in impeller passages generates inlet backflow. It can induce vortexes in suction zones. At Q = 0.3Qd, backflow has expanded to the suction pipe region, and vortical structures have been formed. The strength of backflow has been intensified, and the size of vortex has been enlarged with further decrease in flow rate. When the flow was decreased to 0.1Qd, the distance of prerotation from the impeller inlet increased significantly. It can be observed that there is a long backflow region upstream the pump. And, the number of backflow vortex has increased. The whole flow pattern becomes disordered.
By analyzing the circumferential velocity and axial velocity distribution of fluid in the suction pipe, the change rules of backflow region can be obtained. The distribution of circumferential velocity and axial velocity on the section of suction pipe is shown in Figure 7. The sections are parallel to the pipe axis. The distance from the pipe axis to the section is 6, 11, 16, and 19 mm, respectively.

Circumferential velocity and axial velocity at different positions of the suction pipe: (a) circumferential velocity (0.6Qd), (b) circumferential velocity (0.3Qd), (c) circumferential velocity (0.1Qd), (d) axial velocity (0.6Qd), (e) axial velocity (0.3Qd), and (f) axial velocity (0.1Qd).
As circumferential velocity is not equal to zero, it indicates that the prerotation has formed. At Q = 0.6Qd, the region near the impeller inlet generates prerotation. The region of prerotation has being expanded with the reducing flow rate. At Q = 0.3Qd, the prerotation has expanded to the position of 5R. And, at Q = 0.1Qd, the prerotation has expanded to the suction pipe entrance. The section is closer to the pipe axis, and the circumferential velocity is smaller within the prerotation region at the same flow rate.
At 0.6Qd, the velocity direction of fluid in the suction pipe is the same as the mainstream velocity direction. With the flow rate further decreasing, the fluid in the suction pipe has axial velocity that is opposite to the mainstream direction. At 0.3Qd, from the impeller inlet to the position of 5R, the fluid near pipe wall has reverse axial velocity. When the flow rate decreases to 0.1Qd, the backflow region has reached the position of 10R. It is found that the section near the pipe wall is easy to generate backflow, and the backflow region is closely related to the flow rate. The lower flow rate generates the larger region of backflow.
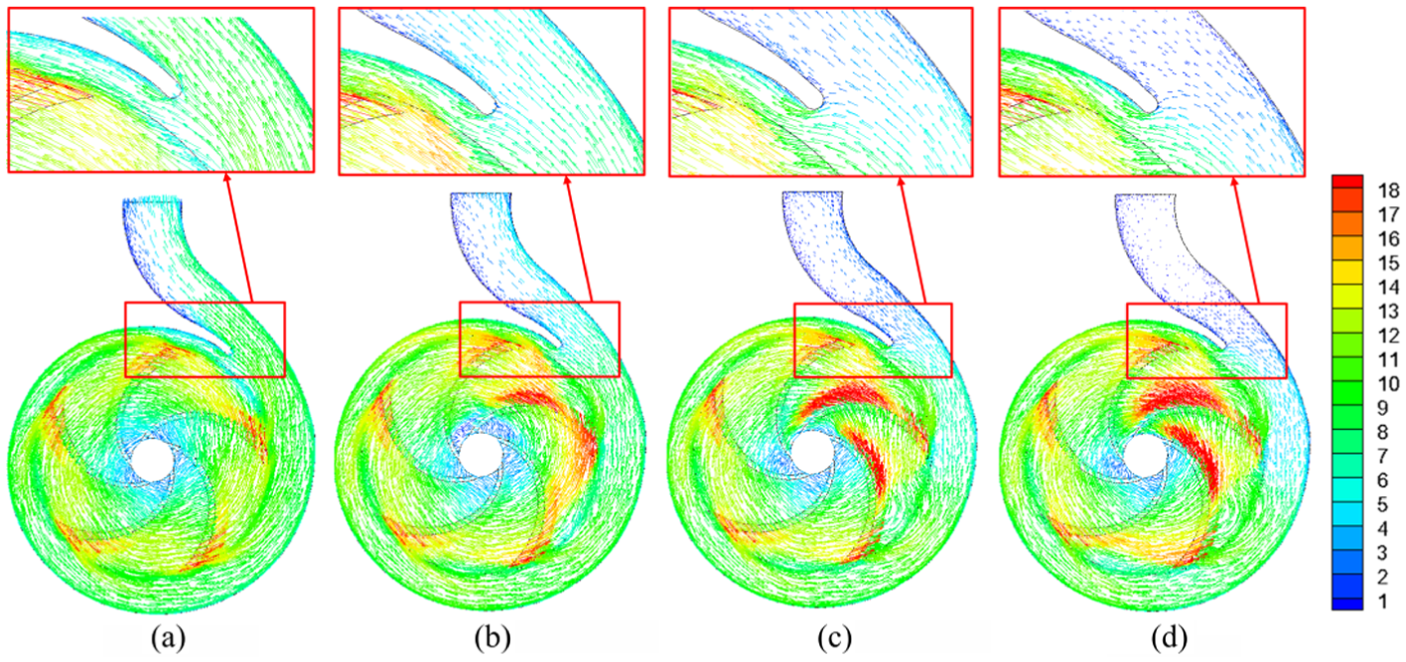
Figure 8 shows streamlines of the relative velocity in the impeller passages under different operating conditions. At design point, streamlines are very smooth. When operating at 0.6Qd, vortexes appear in impeller passages near volute tongue. This kind of unstable flow is caused by the interaction between the impeller and the volute tongue. With the dropping flow rate, the effect of impeller–tongue interaction has been aggravated. The vortical structures developed predominantly and expanded to the adjacent impeller channels. Low-speed areas appear near all the pressure side of blades, which increasingly expand to the impeller passage as flow rate decreases. The development of low-speed area has a great effect on the working ability of impeller and makes efficiency much lower.

Streamlines of the relative velocity in the impeller: (a) Q = 1.0Qd, (b) Q = 0.6Qd, (c) Q = 0.3Qd, and (d) Q = 0.1Qd.
The velocity vector distribution of the pump is presented in Figure 9. The high-velocity region is observed in the passages and increasingly expands with the dropping flow rate. At 0.3Qd, a strong backflow is captured near the volute tongue region. The intensity of backflow has been aggravated at 0.1Qd.
Velocity vector distribution of the pump: (a) Q = 1.0Qd, (b) Q = 0.6Qd, (c) Q = 0.3Qd, and (d) Q = 0.1Qd.
Figure 10 shows streamlines of the relative velocity on the section I and section VII. The volute entrance has larger relative velocity, and the velocity decreased quickly with the fluid discharging to the volute casing. This is because of the fluid near volute entrance is deeply influenced by the high-speed rotating impeller. On the contrary, relative velocity of the fluid near volute wall decreases. Due to secondary flow in the volute, vortexes can be seen at the section I. There is leakage from the gaps between hub, shroud, and volute casing, which makes the flow field in volute symmetrical. It can be seen that the size and position of vortexes are quite symmetric under different flow rates.

Streamlines of relative velocity on the section: (a) sketch of volute section, (b) section I (Q = 1.0Qd), (c) section I (Q = 0.6Qd), (d) section I (Q = 0.3Qd), (e) section I (Q = 0.1Qd), (f) section VII (Q = 1.0Qd), (g) section VII (Q = 0.6Qd), (h) section VII (Q = 0.3Qd), and (i) section VII (Q = 0.1Qd).
The distribution of streamlines on the section VII is the same as section I at 1.0Qd and 0.6Qd. However, the flow pattern has changed dramatically with further decrease in the flow rate. The asymmetrical vortexes can be seen at 0.3Qd and 0.1Qd. It is showed that secondary flow has even stronger effect on the section VII with the dropping flow rate.
Conclusion
The numerical simulation and experiment are applied to investigate the complicated flow in a centrifugal pump. From the analysis of results, the following conclusions have been drawn:
The pump performances predicted by numerical simulation matched very well with the experimental data. With decrease in the flow rate, the prediction head is closer to the experiment one. But the error of predicted efficiency is larger.
At low flow rate, backflow can be observed in suction pipe. With decrease in the flow rate, the strength of backflow has been intensified, and the number of vortexes increased significantly.
Backflow location at different flow rates is obtained by analyzing the circumferential velocity and axial velocity of the fluid in the suction pipe. At 0.6Qd, backflow just can be observed at impeller inlet. At 0.3Qd, backflow region has extended to the position of 5R. At 0.1Qd, backflow region has extended to the inlet of suction pipe.
At design point, the flow follows the blade curvature in impeller passages. When operating at off-design point, the flow structure has changed significantly. Vortexes can be observed in the impeller passage near the volute tongue because of the impeller–volute tongue interaction. When flow rate reduces from 0.6Qd to 0.1Qd, the intensity of vortexes has been aggravated.
Footnotes
Academic Editor: Oronzio Manca
Declaration of conflicting interests
The author(s) declared no potential conflicts of interest with respect to the research, authorship, and/or publication of this article.
Funding
The author(s) disclosed receipt of the following financial support for the research, authorship, and/or publication of this article: This research was supported by National Natural Science Foundation of China (No. 51536008), Zhejiang Provincial Natural Science Foundation of China (No. LZ15E090002), and the Project Grants 521 Talents Cultivation of Zhejiang Sci-Tech University.