
Abstract
This article presents a multi-objective optimization to improve the hydrodynamic performance of a counter-rotating type pump-turbine operated in pump and turbine modes. The hub and tip blade angles of impellers/runners with four blades, which were extracted through a sensitivity test, were optimized using a hybrid multi-objective genetic algorithm with a surrogate model based on Latin hypercube sampling. Three-dimensional steady incompressible Reynolds-averaged Navier–Stokes equations with the shear stress transport turbulence model were discretized via finite volume approximations and solved on a hexahedral grid to analyze the flow in the pump-turbine domain. For the major hydrodynamic performance parameters, the pump and turbine efficiencies were selected as the objective functions. Global Pareto-optimal solutions were searched using the response surface approximation surrogate model with the non-dominated sorting genetic algorithm, which is a multi-objective genetic algorithm. The trade-off between the two objective functions was determined and described with regard to the Pareto-optimal solutions. As a result, the pump and turbine efficiencies for the arbitrarily selected optimum designs in the Pareto-optimal solutions were increased as compared with the reference design.
Keywords
Introduction
Global climate change and depletion of fossil fuels are two of the biggest problems that the world is currently facing. Therefore, it is necessary to develop renewable energy, such as solar power, solar heat, wind power, geothermal, and small hydropower, to replace fossil fuels. However, renewable energy generation systems have difficulty in continuously supplying constant energy because of irregular natural environmental conditions. As an alternative to the aforementioned problem, power stabilization system combined with the pumped storage and renewable energy sources can produce stable power responding properly to the irregular natural environmental conditions. As one of these techniques, power stabilization system using the counter-rotating type pump-turbine with wind turbine unit has been studied for decades by Kanemoto and his colleagues.1–4
Thus far, many kinds of studies have been conducted on counter-rotating type pump-turbines to understand the mechanisms, internal flow characteristics, and hydrodynamic performance characteristics.5–9 Kim et al.6,7 enhanced the turbine efficiency of a counter-rotating type pump-turbine unit being operated in turbine mode using various optimization techniques. The results showed that the turbine efficiency was improved by 2.68% at the best efficiency point as compared with the reference design. Momosaki et al. 8 conducted both numerical analysis and experimental tests to understand the internal flow structure of counter-rotating type axial flow pump rotors, especially at the rear rotor. Moreover, transient analysis was performed by studying the interaction of the front and rear rotor to obtain much more realistic solutions. Oba and Kanemoto 9 invented unique double rotational armatures for coupling with the counter-rotating type impellers/runners to suppress unstable performance and cavitation throughout the entire operation region. They have called such features “smart control” for 13 years. Kasahara et al. 10 analyzed the internal flow characteristics for the pump and turbine modes of a counter-rotating type axial flow pump-turbine through detailed numerical analysis. They also analyzed the cause of performance loss to find that reverse flow and separation occurred near the hub and shroud tips of both the front and rear impellers/runners. From the aforementioned studies, the mechanisms and performance improvement of counter-rotating type pump-turbines have been sufficiently researched; however, there have been no attempts to perform multi-objective optimization in order to simultaneously increase the pump and turbine efficiencies considering the variation of the blade angles.
Therefore, this study includes a multi-objective optimization based on the hybrid multi-objective evolutionary algorithm (MOEA) and three-dimensional steady incompressible Reynolds-averaged Navier–Stokes (RANS) simulations for the simultaneous efficiency improvement of the pump and turbine modes in a counter-rotating type pump-turbine. For optimization, the blade angles of the hub and tip profiles in the impeller/runner with four blades were selected as the design variables. There are three main objectives for this study: (1) simultaneous improvement of the pump and turbine efficiencies of a counter-rotating type pump-turbine using the aforementioned multi-objective optimization technique; (2) understanding the trade-off relation between the two objective functions with the design variables; and (3) providing reasonable guideline for economic solutions according to the required design conditions of a counter-rotating type pump-turbine.
Counter-rotating type pump-turbine
In this study, the reference design of a counter-rotating type pump-turbine was designed from previous work. 3 The flow rate and rotational speed were established to meet the required total head (2 m) for the pump and turbine modes. The counter-rotating type pump-turbine (Figure 1) consisted of a front impeller (rear runner) with five blades and a rear impeller (front runner) with four blades, and it was operated at a fixed head condition in this work. The tip clearances of both of the impellers/runners were 0.5 mm. The blade sections were defined according to the NACA4409 hydrofoil (based on mid-span profile) with the single arc camber and thereafter being redesigned numerically using a commercial computational fluid dynamics (CFD) code to improve the pump mode efficiency. 9 The counter-rotating type rotors were installed on the counter-driving single shafting, which consisted of the inner and outer armatures, and the unit can be operated in pump and turbine modes according to the operating purpose. The experimental designed mass flow rate and hydrodynamic efficiency of the reference design were 5.18 kg/s and 77.03%, respectively, in pump mode and 5.95 kg/s and 81.26%, respectively, in turbine mode. Detailed specifications for the pump and turbine modes are given in Tables 1 and 2, respectively.
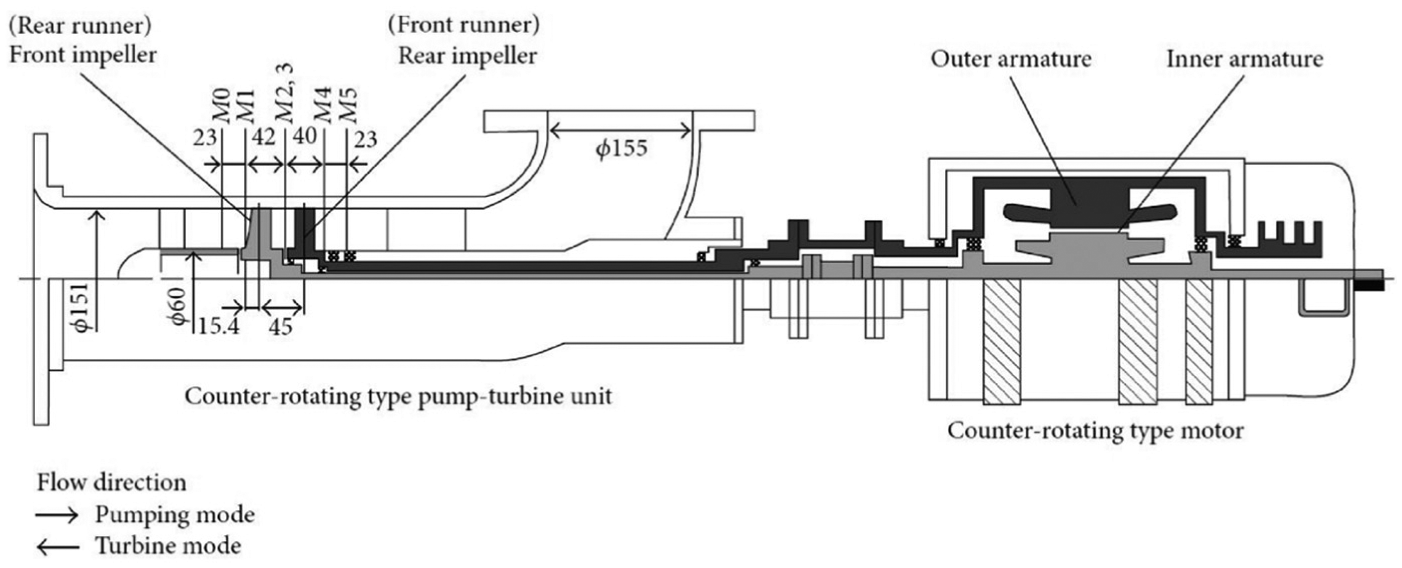
Counter-rotating type pump-turbine. 6
Design specifications of the counter-rotating type pump-turbine in pump mode.

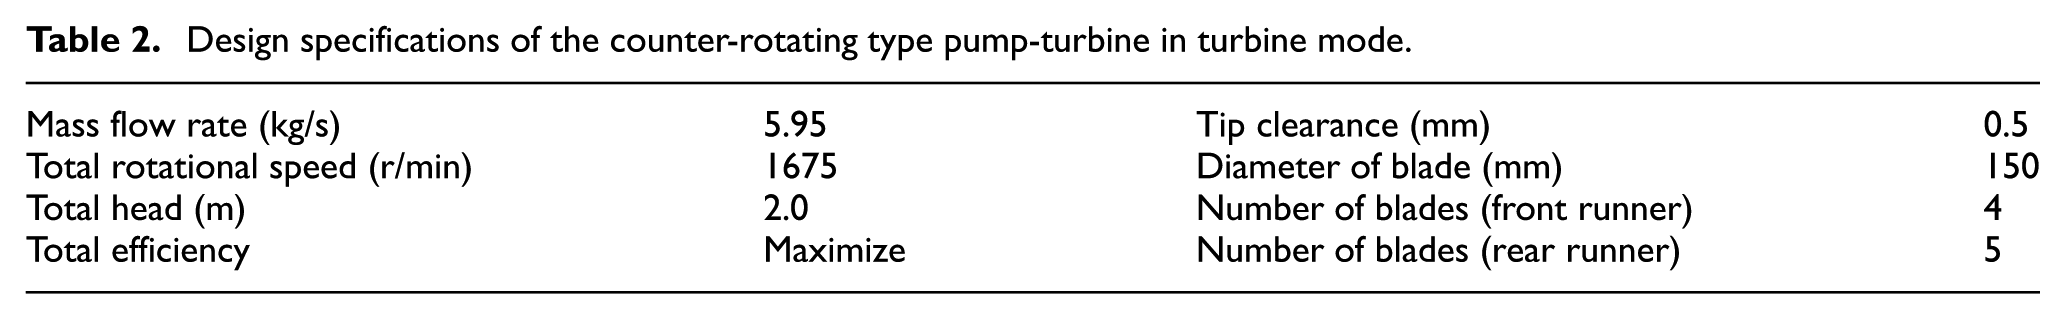
Design specifications of the counter-rotating type pump-turbine in turbine mode.
Numerical analysis method
In this study, the flow analysis was performed using three-dimensional viscous fluid analysis software: the commercial code ANSYS CFX-14.5. 11 The internal flow characteristics of the counter-rotating type pump-turbine were analyzed using three-dimensional steady RANS equations with a k–ω-based shear stress transport (SST) turbulence model, which was discretized via finite volume approximations and solved on hexahedral grids to analyze the flow in the pump-turbine unit. This k–ω-based SST turbulence model is well known to make accurate predictions of flow separation under adverse pressure gradients. This model uses the k–ω and k–ε models in the near-wall region and bulk domain, respectively, and a blending function ensures smooth transitions between these two models.
The counter-rotating blade profile and computational mesh generation were defined using ANSYS Blade-Gen and Turbo-Grid, respectively. The boundary conditions, solver governing equations, and post processing of the results were performed using ANSYS CFX-Pre, CFX-Solver, and CFX-Post, respectively. The working fluid was established as standard 25°C water. For the boundary conditions, the inlet and outlet conditions were set to the desired mass flow rate and atmospheric pressure, respectively, for the pump and turbine modes.
The computational domain for the numerical analysis, which is shown in Figure 2, consists of each single passage for the two rotational impellers/runners of the counter-rotating type pump-turbine. The flow between two adjacent impellers/runners was assumed to be periodic in the direction of rotation. At the best efficiency point, the designed mass flow rates of 5.18 and 5.95 kg/s were set for the pump and turbine modes, respectively, at the inlet, and the atmospheric pressure was set at the outlet of the computational domain. The solid surfaces of the computational domain were considered to be hydraulically smooth with adiabatic and no-slip conditions. The periodic boundaries were set at the blade passage interfaces, and the tip clearance was designed along the blade tip for the two impellers/runners. The stage method, which performs a circumferential averaging of the fluxes through bands on the interface, was used for the connection between the front and rear impellers/runners.

Computational domain and hexahedral grid system.
The computational domain was constructed as a hexahedral grid type: regions near the blade surface consisted of O-type grids and other regions consisted of H/J/C/L-type grids, as shown in Figure 2. A grid-dependency test was performed in previous work. 12 Based on the grid-dependency test, the grid systems for the front and rear impeller/runner domains were constructed using approximately 510,000 and 420,000 grid points, respectively. Here, to benefit from the k–ω-based SST model, the near-wall grid resolution was adjusted to maintain y+≤2 to implement the low-Reynolds-number SST model and accurately capture the wall shear stress. Consequentially, the total grid system has approximately 930,000 grid points for the numerical analysis.
For the convergence criteria, the root-mean-square (RMS) values of the residuals of the governing equations were set to less than 10−5 for all equations. The computations were conducted using an Intel Xeon processor CPU (E5-2680 V3) with a clock speed of 2.5 GHz. Here, each calculation was subdivided into four tasks, and data transfer was performed using MPICH2. The converged solutions were obtained after 1000 iterations to satisfy the convergence conditions, and the computational times were approximately 4 h for turbine mode and 6 h for pump mode.
The accuracy of numerical analysis was validated by comparing the numerical analysis results to the experimental results from the previous work. 13 Figure 3(a) shows the result of the validation for the power and efficiency with the rotational speeds of each mode. Here, the coefficients related to the power and rotational speed for simultaneously expressing both the pump and turbine modes are defined as follows


where Nt, D, H, and P denote the total rotational speed, diameter, total head, and power, respectively. As shown in Figure 3(a), the numerical simulation results for the power and efficiency are in good agreement within the error of 1% with the experimental results across the entire range, except for the relatively lower region which induces an unstable flow at turbine mode. Figure 3(b) shows the result of the validation for the torques of the front and rear blades with the rotational speeds of each mode. Generally, the numerical results for the torque are in reasonable agreement with the experimental data, although the steady RANS analysis with the single passage domain is conducted with no consideration of the mechanical losses. Similar approach has been already verified to optimize the axial type turbomachines in the previous works.14–16 Accordingly, the numerical result of this work was proven to be valid and reliable.
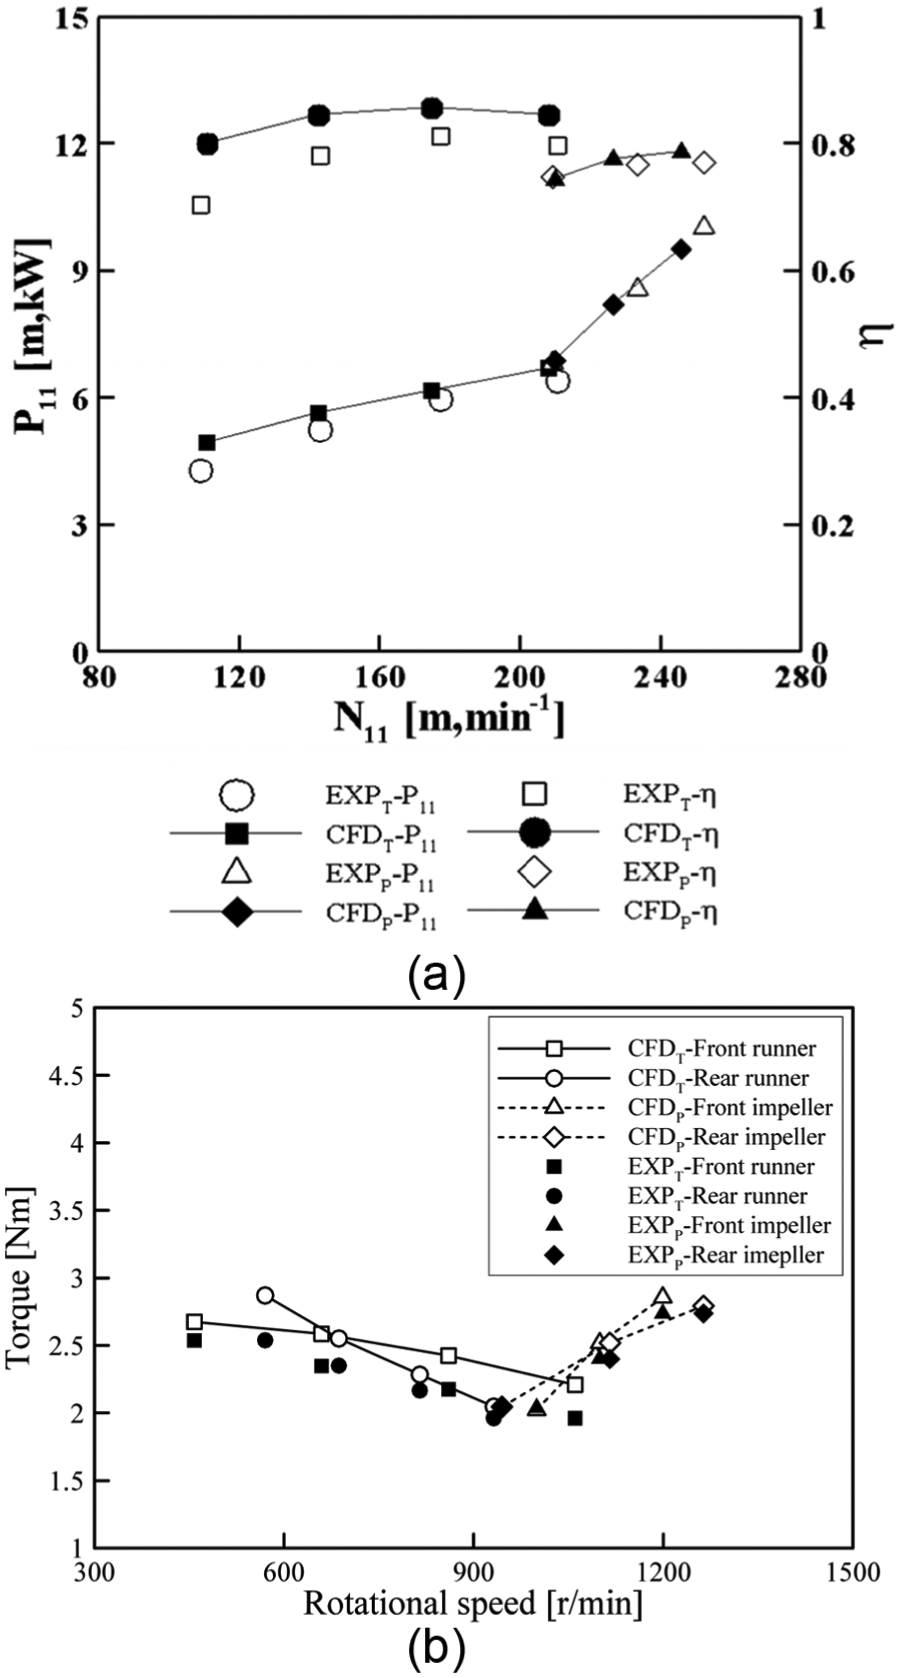
Validation of the numerical results: 13 (a) performance curves and (b) torque curves.
Optimization techniques
The objective functions generally have the trade-off that the pump efficiency increases as the turbine efficiency decreases and vice versa. The purpose of the current optimization is to simultaneously maximize the pump and turbine efficiencies (ηp and ηt, respectively), which are defined as follows


where ρ, g, Q, T, and ω represent the density, acceleration of gravity, volumetric flow rate, blade torque, and angular velocity, respectively.
In general, the design variables that influence the geometric construction of the pump-turbine unit are the blade profile, blade angles at the counter-rotating blades, camber line, and thickness distribution. For design optimization, it is important to find the feasible design space formed by ranges of the design variables. Specifically, in previous work, 13 a sensitivity test for the blade angles at the hub and tip profiles of the front and rear impellers/runners was conducted using the two-level factorial design in design-of-experiment (DOE), 17 as shown in Figure 4. The results showed that the variations of the hub and tip blade angles of the impellers/runners with four blades were much more significant than those of the impellers/runners with five blades in terms of enhancing both the pump and turbine efficiencies. Furthermore, both efficiencies were enhanced with the positive direction of angles. It was confirmed that the pump and turbine efficiencies were improved by decreasing the reversal of flow and separation through the variation of the blade angles. Consequently, two design variables for the hub and tip blade angles of the impellers/runners with four blades were selected for the current optimization problem, and their ranges were limited to prevent the phenomenon of blade torsion and match the flow angle from the hub to shroud, as shown in Table 3.
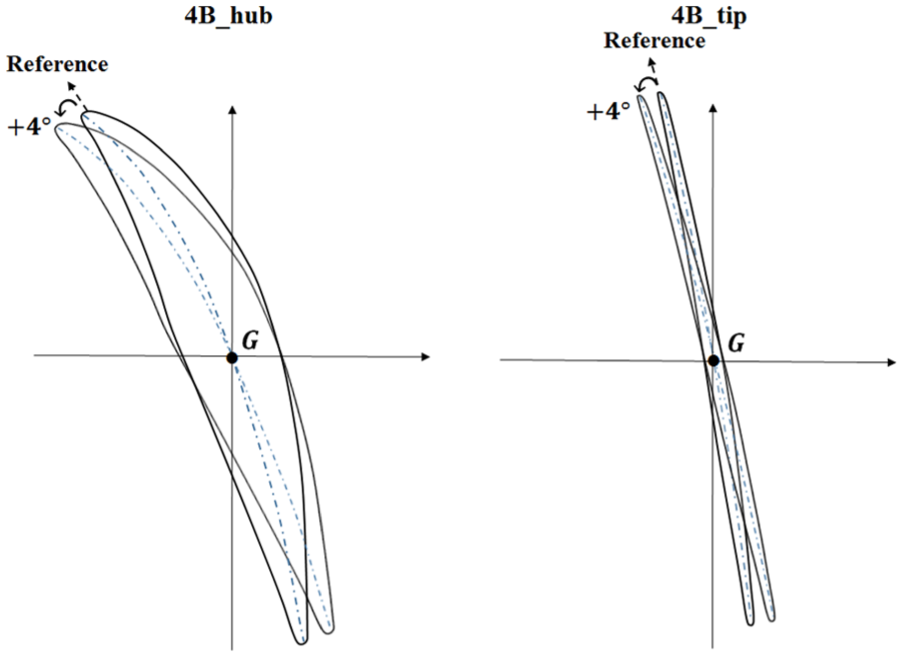
Definition of the design variables.
Ranges of the design variables.

In this work, the multi-objective optimizations were sequentially performed to simultaneously improve the pump and turbine hydraulic efficiencies of the pump-turbine unit. The multi-objective problem is generally defined to maximize or minimize each objective function under constraint conditions. In the case of the pump-turbine unit, improvements to the pump performance simultaneously reduce the turbine performance. The solution can be thought of as a collection of optimal solutions obtained by solving different single-objective functions formed using different weighting factors. Commonly, there are solutions that are known as non-dominated solutions or Pareto-optimal solutions (POSs). To construct the response surface, 12 design points were generated within the design space with the help of Latin hypercube sampling (LHS). 18 The objective functions at these design points were evaluated by three-dimensional RANS simulations. The multi-objective optimization, which was based on an evolutionary algorithm combined with a surrogate model, requires many evaluations of the objective functions in the search for optimal solutions. The genetic algorithm (GA) is a parallel global search method that is based on simulating the biological evolutionary mechanisms from natural genetics. It can accumulate the information of objective functions within design space in the searching process and obtain the optimum relation by adaptively controlling the searching process. Furthermore, this method was advanced by the real-coded fast and elitist non-dominated sorting genetic algorithm-II (NSGA-II), developed by Deb. 19 The fitness values are the pump and turbine efficiencies in the pump and turbine modes, respectively, and the evaluation method is the performance prediction of the pump-turbine unit gained by response surface approximation (RSA) training. After establishing the POSs, sequential quadratic programming (SQP) 20 is employed to search for the optimum point. For practicality, the designers would one or several solutions from POSs as the optimum solution(s) for solving the multi-objective optimization problems.
Results and discussion
Table 4 shows the results of the analysis of variance (ANOVA) and regression analysis of the response surface including the root-mean-square-error (RMSE) for each objective function analyzed from the RSA. As reported previously by Ginuta, 21 the analysis is accurate when the R2adj value is within the range of 0.9–1. In this study, the R2adj values for the pump and turbine efficiencies were 0.972 and 0.965, respectively. Therefore, the prediction values for each objective function with the R2adj values were reliable. From the regression analysis, the constructed RSA functions can be defined in terms of normalized design variables


where x1 and x2 represent the 4B_hub and 4B_tip variables, respectively.
Results of ANOVA and regression analysis.

RMSE: root-mean-square-error.
Figure 5 shows the results of the sensitivity analysis for each objective function with the two design variables that were tested by the RSA method in terms of each objective function. The x-axis indicates the deviation from optimum point, which was restricted to ±10% of its optimum value, whereas the y-axis represents the sensitivity of the design variables from the optimum point. In Figure 5, both design variables are quite significant for pump efficiency, while the 4B_tip variable is much more significant than 4B_hub. However, they are obviously both important parameters for both objective functions.

Sensitivity analysis results: (a) pump mode and (b) turbine mode.
Figure 6 shows the results of the multi-objective optimization with the reference design and 12 design points obtained with LHS. In the POSs, the objective function values were maximized well, and their trade-off result shows a distinct correlation between the pump and turbine efficiencies, as shown in Figure 6. Namely, higher pump efficiency was obtained at lower turbine efficiency, and vice versa. Two arbitrarily clustered optimum designs, which are oriented for each objective function, were selected in the POSs and then calculated using the RANS simulation. As a result, their calculated results were in good agreement with the predicted values generated from the POSs, and both efficiencies were also increased considerably compared to the reference design.

Results of multi-objective optimization.
Tables 5 and 6 shows the results of the multi-objective optimization for the design variables and objective function values. As shown in Table 5, both design variables for the clustered optimum designs changed significantly from the reference design. Moreover, their objective functions were all improved compared to those of the reference design. Consequently, compared to the reference design, the multi-objective optimization caused cluster A (the turbine efficiency-oriented design) and cluster B (the pump efficiency-oriented design) to improve by 0.80% and 1.02% in pump efficiency, respectively, and 0.50% and 0.27% in turbine efficiency, respectively, as shown in Table 6. Furthermore, the maximum relative error of the multi-objective optimization is only 0.03%.
Results of the multi-objective optimization: design variables.

Results of the multi-objective optimization: objective functions.

MOEA: multi-objective evolutionary algorithm; RANS: Reynolds-averaged Navier–Stokes.
To find the main factors responsible for the improved pump and turbine efficiencies, the internal flow fields for the reference and cluster optimum designs were compared and analyzed as shown in Figures 7–15. Figure 7 shows the results of the efficiency for each impeller and the complete system in the pump mode for the reference design and clusters A and B. As shown in Figure 7, all the efficiencies of the impellers having five blades are very similar for pump mode, whereas the efficiencies of the two optimized impellers having four blades, which are located in the downstream region, were considerably improved by the optimization. Specifically, the efficiency of cluster B, which focused on pump efficiency, was enhanced by approximately 1.6% compared to the reference design. As discussed early in Tables 5 and 6, the total pump efficiency for cluster B was increased by 1.02% in comparison with the reference design. The results indicate that the changes in the design variables significantly contributed to the improvement of the efficiency, as shown in Figure 5(a).

Efficiency distribution for each impeller and complete system in pump mode.
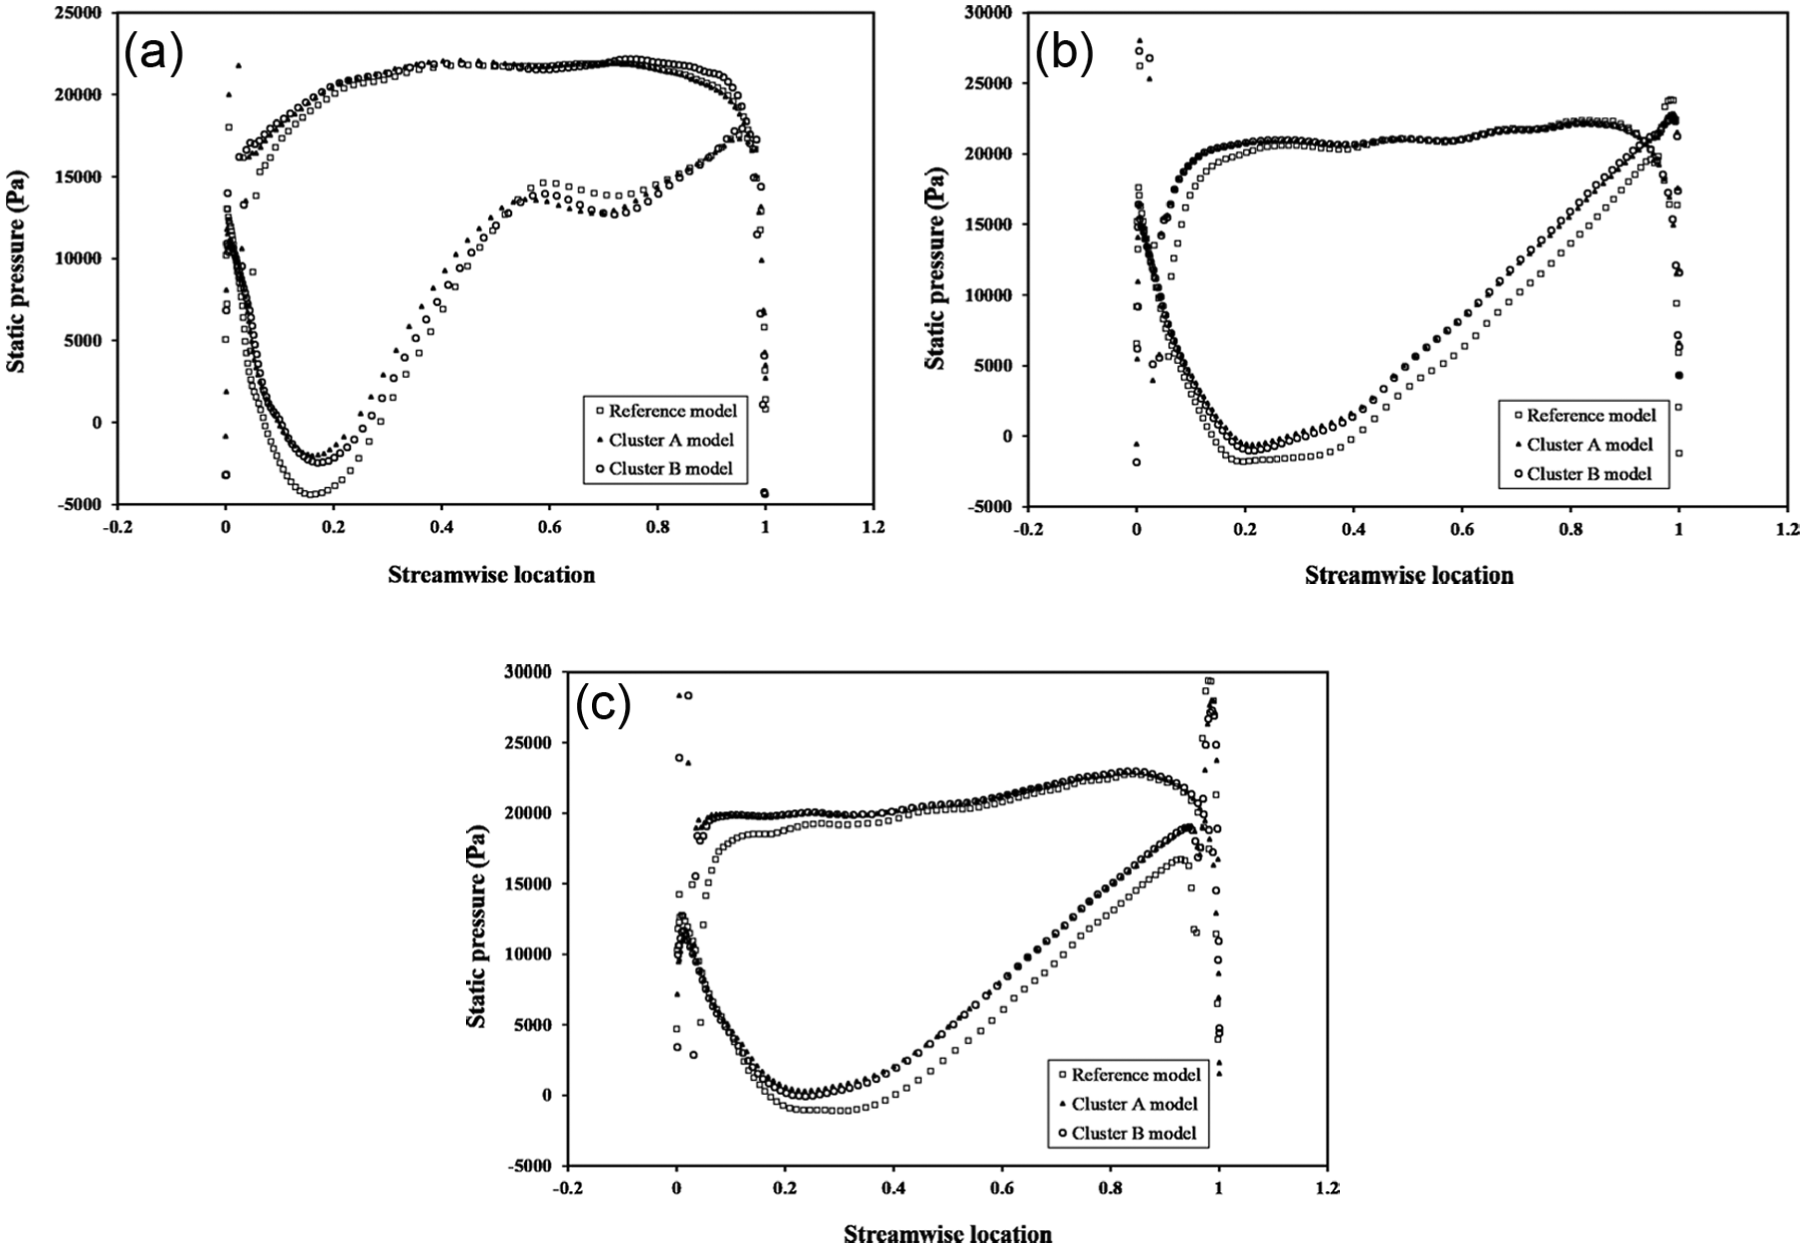
Static pressure distributions on the blade surfaces of the rear impellers having four blades: (a) 10% span, (b) 60% span, and (c) 90% span.
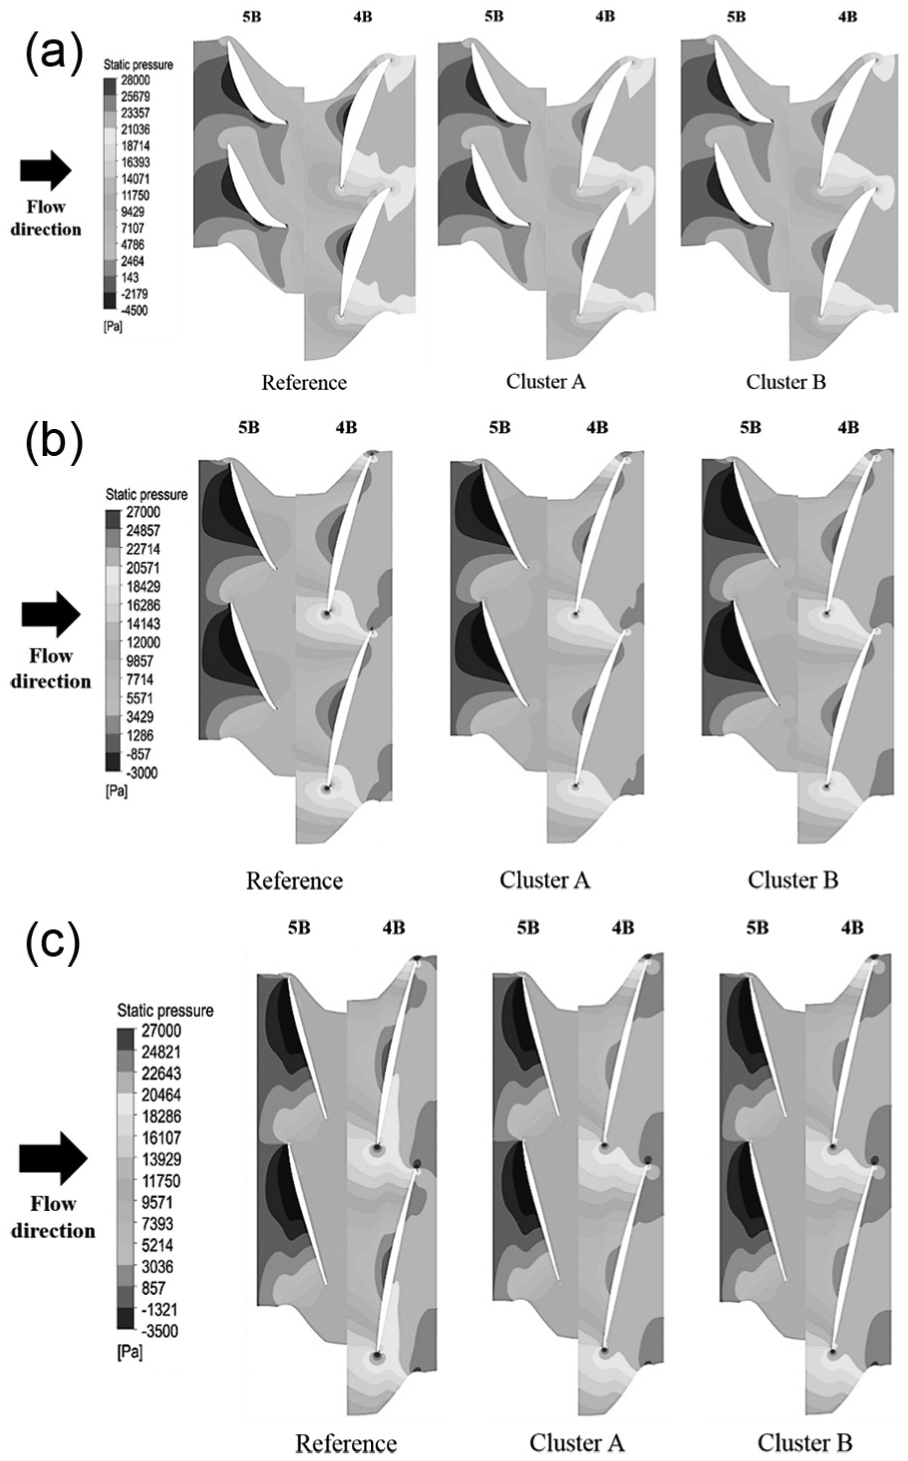
Static pressure distributions on the entire blade-to-blade passage: (a) 10% span, (b) 60% span, and (c) 90% span.

Meridional velocity contours on meridional plane.

Efficiency distribution for each runner and complete system in turbine mode.

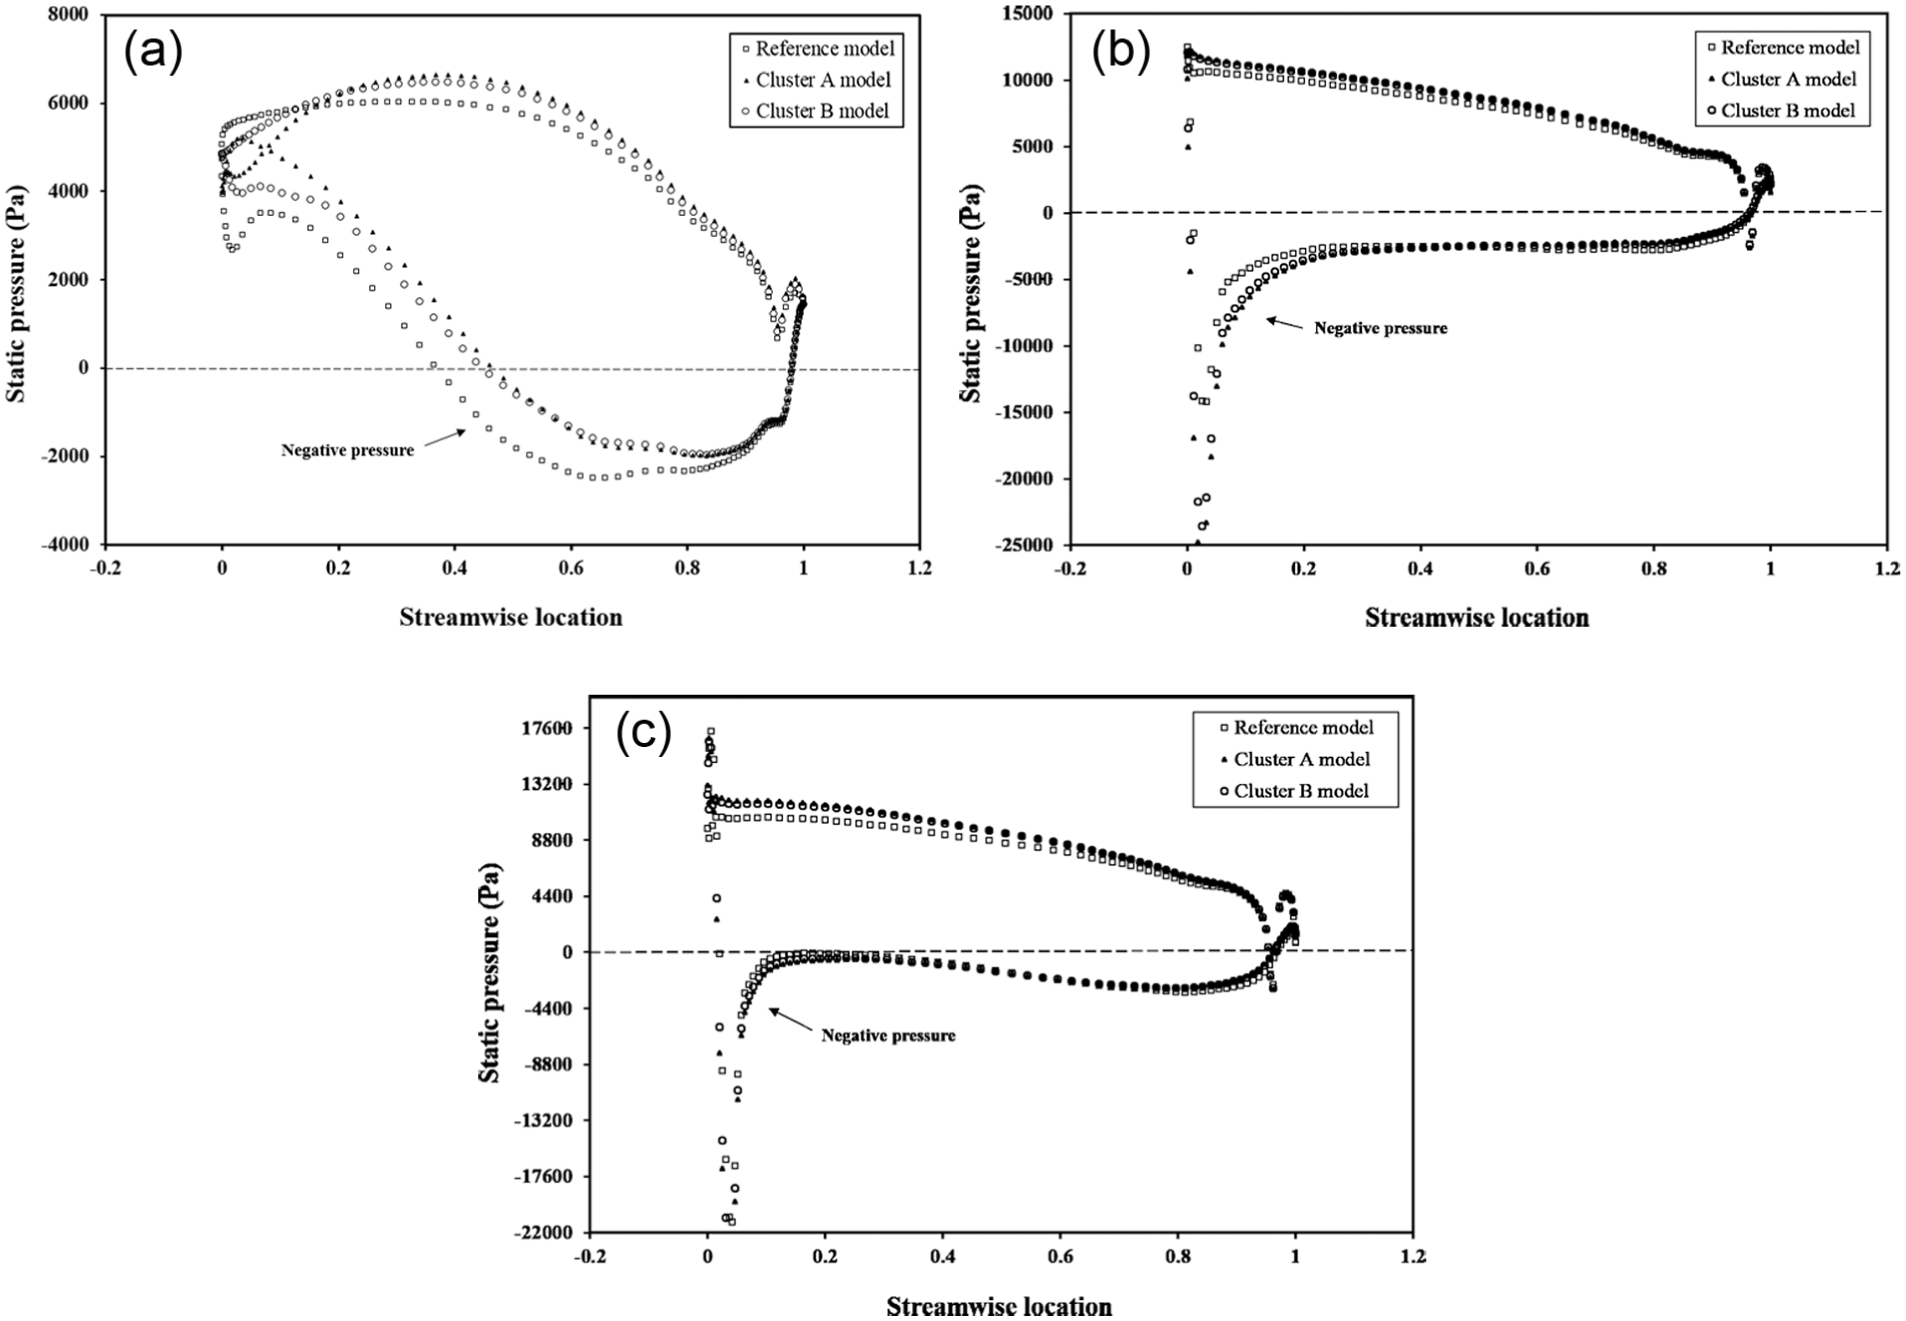
Static pressure distributions on the blade surfaces of the front runners having four blades: (a) 10% span, (b) 60% span, and (c) 90% span.
Static pressure distributions on the blade surface of the rear runners having five blades: (a) 10% span, (b) 60% span, and (c) 90% span.

Axial velocity contours on blade-to-blade passage at the 90% span.

Velocity contours near the trailing edge of the front and rear runners: (a) location of observation, (b) Plane A, and (c) Plane B.
Figure 8 shows the static pressure distributions in the streamwise direction at the 10%, 60%, and 90% spans on the suction and pressure surfaces of the rear impellers having four blades for the reference design and clusters A and B in pump mode. The static pressures near the leading edge on the pressure surface for clusters A and B were remarkably improved at all spans. In particular, the static pressure near the trailing edge along the pressure surface at the 10% span of cluster B was increased compared to the others, as shown in Figure 8(a). Moreover, the static pressures on the suction surface for the clusters A and B show mostly higher values than those of the reference design. Notably, the static pressures of most of the optimized rear impeller spans were enhanced because the incidence angles were changed by the variation of the hub and tip blade angles during the optimization.
The static pressure contours are plotted in Figure 9 at the same spans of Figure 8 for the reference design and clusters A and B. The static pressure distributions at most spans of the front impellers for all the designs are very similar, whereas the low pressure zone occurred on the suction surfaces throughout the entire blade-to-blade passages. Furthermore, the lowest pressure zone was observed on the suction surface at the 10% span of the front impeller blade. In the sensitivity test of previous work, 13 the design variables of the front impeller were not much more significant than those of the rear impeller in terms of the total efficiency; thus, this was not considered in the current optimization. However, due to the optimization, the low static pressure zones on the suction surface at all spans of the rear impellers for clusters A and B were significantly reduced, and they were particularly suppressed at the 90% span. Furthermore, the static pressures in clusters A and B were increased mostly beyond the trailing edge of the blade in the downstream region, and especially at the 90% span, compared to the reference design.
Figure 10 shows the meridional velocity contours on the meridional plane of the impellers for the reference design and clusters A and B. As shown in Figure 10, large flow separations occurred at the near hub in each downstream region of both impellers for all designs. However, in cluster B, the separation that occurred in the downstream region of the rear impeller was remarkably suppressed compared to the others. In addition, the velocity distributions from hub to tip in the rear impeller of the optimum designs were mostly uniform in comparison with the reference design. Therefore, the optimum designs produced mostly stable flows in the downstream region of the pump-turbine.
Figure 11 shows the results of the efficiency for each runner and the complete system in the turbine mode for the reference design and clusters A and B. In contrast with the pump mode, the efficiencies of the optimized runners having four blades at the front of the turbine in turbine mode were slightly reduced compared to the reference design—especially for cluster A—through the optimization. However, the efficiencies of the runners with five blades, which are located in the downstream region, were improved significantly—especially for cluster A, which is focused on turbine efficiency. Therefore, the efficiencies for clusters A and B increased not only for pump mode but also for turbine mode. As previously discussed regarding Figure 5, these results verify that the pump efficiency was much more sensitive to the selected design variables than was the turbine efficiency. However, it stands to reason that both parameters are relevant for both objective functions.
Figure 12 shows the static pressure distributions in the streamwise direction at the 10%, 60%, and 90% spans on the suction and pressure sides of the front runners having four blades for the reference design and clusters A and B in turbine mode. Because the closed area filled with the static pressure distributions is proportional to the output power of the turbine, 22 the closed area for clusters A and B was reduced slightly as shown in Figure 12; thus, this explains the reduced efficiency values at the front of the turbine compared to the reference design as shown in Figure 11. Furthermore, the static pressures near the trailing edge on the pressure side for clusters A and B were slightly improved at all spans. Additionally, the negative pressure components on the suction side of clusters A and B were slightly reduced because the incidence angles were changed by the optimization.
Figure 13 shows the static pressure distributions in the streamwise direction at the 10%, 60%, and 90% spans on the suction and pressure sides of the rear runners having five blades for the reference design and clusters A and B. By varying the flow angle of the upstream region beyond the front runner, the closed area in the rear runners of clusters A and B was generally increased—especially on the pressure side—in comparison with the reference design. Moreover, the negative pressure components on the suction side at the 10% span of clusters A and B were reduced considerably beyond the middle region of the streamwise direction. These results contributed to the improvement of the turbine efficiency.
Figure 14 shows the axial velocity contours at the 90% span for the reference design and clusters A and B. In the reference design, the large negative axial velocity component occurred near the trailing edge on the suction side of the front runner. However, this negative component was considerably reduced in clusters A and B because the incidence angles were changed by the variation of the blade tip angle during the optimization.
Figure 15 shows the velocity contours near the trailing edge of front and rear runners. The location of observation is indicated in Figure 15(a). As shown in Figure 15(b), the velocity distributions from hub to tip in the front runners for clusters A and B were mostly uniform in comparison with the reference design. According to the flow stabilization of the upstream region, the velocity distributions in the rear runners were also mostly uniform—especially at the tip region—as shown in Figure 15(c). These results illustrate the enhancement of the turbine efficiency as a result of the optimization.
Conclusion
A counter-rotating type pump-turbine was optimized to simultaneously maximize both the pump and turbine efficiencies using a hybrid MOEA combined with an RSA surrogate model through three-dimensional RANS simulation. Multi-objective optimization was performed with two design variables related to the blade angles in the impeller/runner with four blades. The main conclusions from this study are summarized as follows:
The blade angles at the hub and tip profiles in the impeller/runner with four blades were found to be very important parameters for simultaneously enhancing both the pump and turbine efficiencies of the counter-rotating type pump-turbine. In particular, the pump efficiency was much more sensitive to both design variables than was the turbine efficiency.
Through the multi-objective optimization, clusters A and B showed 0.80% and 1.02% improvements in pump efficiency, respectively, and 0.50% and 0.27% enhancements in turbine efficiency, respectively, in comparison with the reference design, with a maximum relative error of only 0.03%. From these results, the changes in the design variables clearly contributed to the simultaneously efficiency improvements in both the pump and turbine modes.
The objective functions in the POSs were maximized well, and their trade-off results showed a distinct correlation between the pump and turbine efficiencies with the variation of the design variables. Namely, higher pump efficiencies were obtained at lower turbine efficiencies and vice versa. Therefore, designers can select any economic solution according to the required design conditions.
In pump mode, the static pressures of most of the optimized rear impeller spans were enhanced significantly because the incidence angles were changed by the variation of the hub and tip blade angles. It was found that these results clearly contributed to the improvement of the pump efficiency.
In turbine mode, the efficiency values of the optimized front runners having four blades were reduced slightly compared to the reference design. However, the efficiencies of the rear runners located in the downstream region were improved slightly because the incidence angles were changed by the optimization, which caused the enhancement of the turbine efficiency.
From the results of this work, it was clearly confirmed that the proposed multi-objective optimization technique is capable of simultaneously improving both the pump and turbine efficiencies of the counter-rotating type pump-turbine.
Footnotes
Appendix 1
Academic Editor: Bo Yu
Declaration of conflicting interests
The author(s) declared no potential conflicts of interest with respect to the research, authorship, and/or publication of this article.
Funding
The author(s) disclosed receipt of the following financial support for the research, authorship, and/or publication of this article: This work was supported by the SEED Research Project Grant at the Korea Institute of Industrial Technology (KITECH) (No. ER150004) and partly by a grant from the Demand-based-Platform R&D Project of the KITECH (No. JA160031), which was funded by the Ministry of Science, ICT and Future Planning (MSIP). The authors gratefully acknowledge this support.