
Abstract
The bus passenger trip flow is the base data for transit route design and optimization, and the characteristic of urban land use is the important factor for transit trip. However, the standard land use data are difficult to reflect the intensity of transit trip. This research proposed a method based on each zone building, land use situation, and bus accessibility to forecast the bus passenger trip flow in future period. Traffic zone is divided into three categories in accordance with the purpose of the residents travel: residential, commercial, and industrial. Then, by artificial neural network model, the three categories of the traffic zone bus passenger trip flow are forecasted. The method is assessed with the data of Dalian developing zone in China and results show its feasibility and reliability. Finally, the future research direction is discussed.
Introduction
Bus traffics are important basic information for transportation planning and bus scheduling, with the expansion of city size, bus route sand sites are on the rise, and the frequent changes have brought many difficulties to the traditional manual method of investigating bus traffic. The traditional manual methods are affected by various factors and constraints which lead not to reflect the dynamics of the long-term changes in urban public transport travel trends. Bus travel demand forecast in the traditional 4-phase method is mainly in the mode of traffic division stage, it is separated from the total traffic demand. Forecasting the distribution of residents travel and travel mode, the bus passenger trip flow is finally obtained. The traditional four-phase method can apply to the different requirements of the forecast period; however, this method needs more data, investigation, and handling of large workload and long processing cycle, so the cost is very high. Thus, this article proposed an artificial neural network (ANN) method, based on urban land use and bus accessibility of each zone to forecast the bus passenger trip flow in future period. Using the historical data of the traffic flow to forecast the bus passenger trip flow, a large-scale investigation is avoided.
Influence factors
In the model of each zone residents, the bus passenger trip flow forecast, the land use, and type of traffic area are the most important influencing factors; the bus accessibility is of equal importance.1–6 Land use is involved in distribution of various types of land use patterns in the zone and each area in the city location; they are the main factors affecting the bus passenger trip flow forecast model. Urban land use is the source of urban traffic demand. The different urban land use layout form, property, and intensity determine the different traffic need and also decide the traffic generating volume, sucking volume, and layout. Traffic zone is divided into three categories in accordance with the purpose of the residents travel: residential, commercial, and industrial. The zones which attract residents to travel are mainly residential zones and commercial zones.7–9
Public traffic accessibility is the main influence factor of public transport travel. It affects the choice of travel mode and residents travel time and other characteristics of urban resident travel. Then, it affects the traffic flow of public transport residents. If there are more bus routes between the traffic zones, the number of passengers traveling by bus will be relatively more because of the higher degree of public traffic accessibility and the more convenient trip.10–13
In addition to the above two factors, the distance between the traffic zones also affects the number of residents bus travel. It determined the time cost of public transport travel. The more the time cost, the more the possibility residents choose other means of transportation.
Model development
ANN model
ANN is a kind of model which simulates the behavior characteristics of animal neural network. And it is a mathematical model of distributed parallel information processing.14–19 This network relies on the complexity of the system. It achieves the purpose of processing information through the adjustment of the internal connection between a large number of nodes. This model has the ability of self-learning and self adaptation.
ANN is a mathematical model of information processing, which is similar to the structure of synaptic connections in the brain. Neural network is a kind of computing model, which consists of a large number of nodes and mutual connection. Each node represents a specific output function, called the function activation. The connection between each two nodes represents a weighted value for the connection signal, which is called the weight. This is equivalent to the memory of the ANN. The output of the network changes according to the change in the connection mode of the network, the weight value, and the excitation function.
There are three types of neurons in an ANN: an input layer, a hidden layer, and an output layer. Input layer, a large number of neurons accept a large number of non-linear input information. The input information is called the input vector. Output layer, the information in the link is transmitted, analyzed, weighed, and formed the output results. The output of the information is called the output vector. Hidden layer is a layer composed of many neurons and links which are between the input and output layers.
A typical artificial neuron model is shown in Figure 1.

Artificial neural network model.
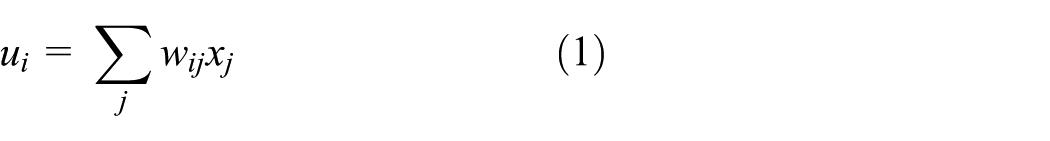
Define xj for the input node of neuron i, wij for the weight of i to j. ui is the output of the linear combination of the input node i, and it is the last input of neuron i. θi is the threshold of neuron i. vi is the adjusted value of neuron i deviation

f (.) is an excitation function, and yi is the output node of neuron i

Bus passenger trip flow forecast ANN model
In section “Influence factors,” the influence factors of bus passenger trip flow forecast is discussed. Therefore, this article inputs each traffic zone land use (the proportion of residential, commercial, and industrial traffic), bus accessibility, area, and distance to other zones. The output node is the bus passenger flow from one traffic zone to another traffic zone. Bus passenger trip flow forecast ANN model is shown in Figure 2.

Bus passenger trip flow forecast ANN model.
The number of neurons in the hidden layer is a vital step in the ANN method. It directly affects the results of the model. At present, there is no relatively accurate theory and method to determine.20–27 Generally, the number of neurons can be chosen with the following two formula.
k is sample number and n is the number of input neurons. If i > p, then
n is the input neuron’s number, q is the output neuron’s number, and a represent constant between 1 and 10.
Model data
In this experiment, the bus passenger trip flow forecast ANN model is validated based on the data of Dalian economic zone, a small-sized district of 3.78 million inhabitants. The total area of Dalian economic zone is 168 km2 and the built-up area covers 52 km2. According to the community boundary, Dalian economic zone is divided into 27 traffic zones,28,29 as shown in Figure 3.

Traffic zones location in Dalian economic zone.
Land use data of traffic zones
According to the national “Standard for classification of urban land and for planning of constructional land,” it stipulates that urban land use is mainly divided into three categories: residential, commercial, and industrial. There is a complicated relationship between urban transportation and land use. The land use data are the critical data of the traffic demand model. In order to grasp the status of land use in Dalian economic zone, this article collected the current situation of land use in Dalian economic zone, as shown in Figure 4.

Land use in Dalian economic zone.
Then, input each traffic zone land use (the proportion of residential, commercial, and industrial traffic) and area in the bus passenger trip flow forecast ANN model.
Bus accessibility
The connection between traffic zones can be marked in the form of an adjacency matrix in the bus network. Without the condition of the internal traffic zone bus travel, define H for adjacency matrix, hmn is the element of H. hmn is defined as

Thus, the relationship, between all the nodes in the urban public transportation network, is represented by an adjacency matrix H

Defined the Hi for the initial matrix of the bus route i accessibility matrix. If traffic zone m can be reached to traffic zone n by bus without transfer, then hmn = 1, else hmn = 0. All bus routes accessibility matrix H without transfer calculate the sum:
Because transit is taking a long time and tired, it reduced the probability of residents to choose public transport. Therefore, when calculating the routes accessibility, only consider one transfer of reachability. Bus routes accessibility matrix by one transfer is defined as H′: H′ = H*H.
Ultimate bus accessibility is H*: H* = a*H + b* H′ (a,b are coefficients). Because direct travel is more convenient than the transfer, coefficient a is greater than b. Through the ANN experiment, a = 10 and b = 1 is the best numerical.
Distance between the zones
Distance between the zones is the shortest bus route distance between the traffic zones. The transit system operates 8 bus lines and 102 stops. The total length of lines is 101.2 km and the average station spacing is 0.5 km. Bus routes in Dalian economic zone are shown in Figure 5.

Bus routes in Dalian economic zone.
Bus passenger trip OD Flow
In order to obtain the accurate bus passenger trip origin destination (OD) distribution, this research designs a kind of investigation method which is similar to the ticket sales. This method can gain the distribution of all passenger flow, and traditional bus survey method only can get the total number of people get off each station. The survey was carried out during the early peak period of 11–14 September 2005, and 8 bus lines and 160 buses in Dalian economic zone were investigated.
Case study
First, the traffic zones are divided into three categories: (1) residential zones, A-zones; (2) commercial zones, B-zones; and (3) industrial zones, C-zones. A-zones contain 20 traffic zones, B-zones contain 3 traffic zones, and C-zones contain 4 traffic zones.
Because of the difference purpose between the different residents travel, in this research, the bus passenger trip flow forecast is divided into three categories. The purpose of one zone travel to A-zones mainly is for shopping or visiting relatives, to B-zones mainly is for traveling or entertainment, and to C-zones mainly is for working. In order to better explain generalization ability, the experimental data are divided into three parts. The first part of data is set to the training datasets, the second part of data is set to the cross-validation datasets, and the third part of data is set to the testing datasets.
Result of destination to A-zones prediction
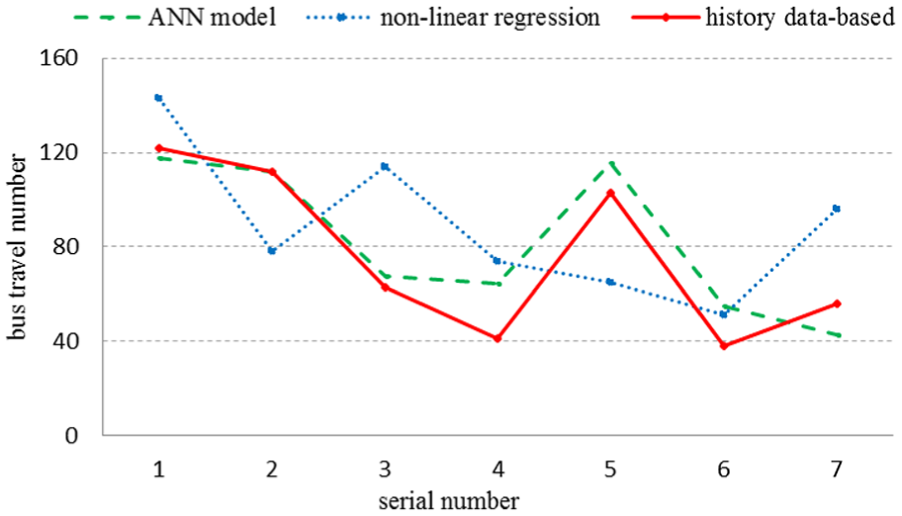
The data, destination to A-zones bus travel, were collected from 480 groups. The effective data group was 412 groups. In order to reduce prediction error, delete the data 68 groups, in which the number of trips is less than 5. The best hidden layer is 6 under the condition of 6 neurons in the input layer, 352 group samples, 500 training times, and target of 0.001. Forecast the other 60 sets of data, as shown in Figure 6.

Comparison of predicted and actual bus travel to A-zones numbers.
Di is the relative error of the predicted value and the actual number of the i group and its corresponding proportion are shown in Table 1.
Relative error of the models based on bus travel to A-zones numbers.
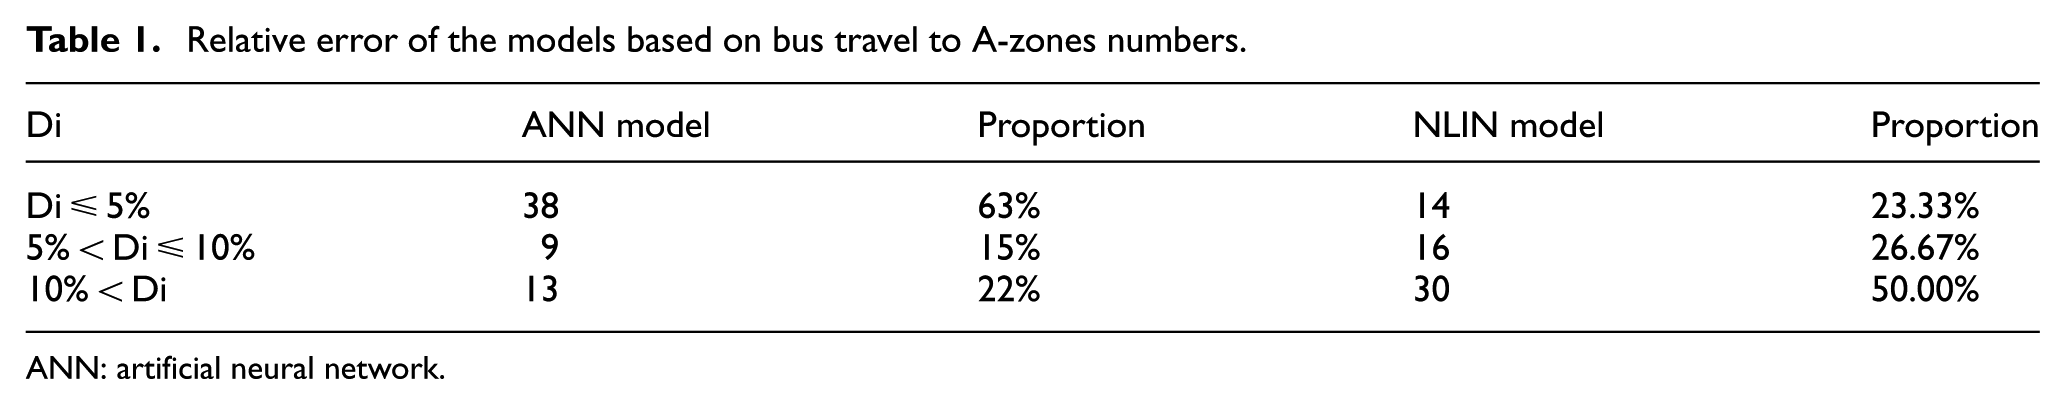
ANN: artificial neural network.
As can be seen from Table 1, ANN model is more accurate than non–linear regression (NLIN) model. The relative error within 5% is 63% of groups forecast. Accuracy of ANN model is relatively high.
Result of destination to B-zones prediction
The data, destination to B-zones bus travel, were collected from 69 groups. The effective data group was 63 groups. In order to reduce prediction error, delete the data 5 groups, in which the number of trips is less than 5. The best hidden layer is 5 under the condition of 6 neurons in the input layer, 55 group samples, 500 training times, and target of 0.001. Forecast the other eight sets of data, as shown in Figure 7.

Comparison of predicted and actual bus travel to B-zones numbers.
The relative error of the predicted value and the actual number and its corresponding proportion are shown in Table 2.
Relative error of the models based on bus travel to B-zones numbers.

ANN: artificial neural network.
As can be seen from Table 2, ANN model is more accurate than NLIN model. The relative error within 5% is 75% of groups forecast. Accuracy of ANN model is relatively high.
Result of destination to C-zones prediction
The data, destination to C-zones bus travel, were collected from 23 groups. The effective data group was 23 groups. The best hidden layer is 5 under the condition of 6 neurons in the input layer, 15 group samples, 500 training times, and target of 0.001. Forecast the other seven sets of data, as shown in Figure 8.
Comparison of predicted and actual bus travel to C-zones numbers.
The relative error of the predicted value and the actual number and its corresponding proportion are shown in Table 3.
Relative error of the models based on bus travel to C-zones numbers.

ANN: artificial neural network.
As can be seen from Table 2, ANN model is more accurate than NLIN model. The relative error within 5% is 86% of groups forecast. Accuracy of ANN model is relatively high.
Conclusion
The goal of this work is to devise an accurate method for bus passenger trip flow prediction, so as to provide support for transit route design and optimization. A new prediction model is proposed in this article which proposed a method based on each zone building area and bus accessibility to forecast the bus passenger trip flow in future period. By ANN model, the three categories of the traffic zone, A-zones, B-zones, and C-zones, bus passenger trip flow are forecasted. Accuracy of ANN model is relatively higher than NLIN model. However, in the course of the study, there is no distinction between the grade of residential quarters and did not distinguish the location of traffic in the city. It will be the next step of the focus.
Footnotes
Academic Editor: Gang Chen
Declaration of conflicting interests
The author(s) declared no potential conflicts of interest with respect to the research, authorship, and/or publication of this article.
Funding
The author(s) disclosed receipt of the following financial support for the research, authorship, and/or publication of this article: This research was supported by Social Sciences Planning Project of Liaoning Province (L14BJY015).