
Abstract
Evidence theory is widely used in fault diagnosis due to its efficiency to model and fuse sensor data. However, one shortcoming of the existing evidential fault diagnosis methods is that only the basic probability assignments in singletons can be generated. In this article, a new evidential fault diagnosis method based on sensor data fusion is proposed. Feature matrix and diagnosis matrix are constructed by sensor data. A discrimination degree is defined to measure the difference between the sensor reports and feature vector. The basic probability assignment of each sensor report can be determined by the proposed discrimination degree. One merit of the proposed method is that not only singletons but also multiple hypotheses are considered. The final diagnosis result is obtained by the combination of several sensor reports. A practical fault diagnosis application is illustrated to show the efficiency of the proposed method.
Introduction
Fault diagnosis is widely used in real life. It is investigated and applied to many areas such as electrical motors, 1 analog circuits, 2 and dynamic systems. 3 Some particular tools are used to develop approaches to intelligent fault diagnosis. For example, a statistics analysis method is applied to fault diagnosis of rolling element bearings. 4 In addition, neural network,5–7 support vector machine, 8 and other theories9–13 are also applied to fault diagnosis.
Since the fault diagnosis and health management in real system are very complex with uncertain information, some efficient multi-criterion decision-making methods, such as analytic hierarchy process (AHP)14–17 and technique for order of preference by similarity to ideal solution (TOPSIS),18,19 are also applied to handle fault diagnosis.20–22 In addition, decision-making, optimization, as well as fault pattern recognition are often inevitable to deal with uncertain information.23–27 As a result, many math tools, such as fuzzy sets theory 28 rough sets theory, 29 and D numbers, 30 are adopted to handle the vague and uncertain information. The Dempster–Shafer evidence theory31,32 (evidence theory) is efficient to quantify the imprecision and uncertainty in reliability and failure analysis. Due to its efficiency to represent and fuse uncertain information, evidence theory is widely used in many real systems,33–38 such as credal classification, 34 reliability analysis, 39 uncertainty measure, 40 and failure modes’ evaluation. 41 However, the application of evidence theory is sometimes limited for conflicting evidence. Some methods are proposed to handle the conflicting evidence.42,43
Recently, evidence theory is applied to fault diagnosis in some researches. A typical method is proposed by Basir and Yuan. 44 The multi-sensor engine diagnosis problem is framed in the context of evidence theory. However, the evidence theory is applied to fault diagnosis without the consideration of multiple hypotheses so that the advantage of evidence theory is not made most of. In addition, evidence theory is combined with other math tools to apply in a certain area in some articles. A new method 45 is introduced based on data-driven random fuzzy evidence acquisition and evidence theory and proved to have high accuracy and reliability with a good agreement with experimental data. Neural network and evidence theory 46 are combined in motor fault diagnosis model in order to reduce the uncertainty of the traditional method. A new weighted average method 47 based on the evidence theory and Deng entropy that can increase the accuracy of decision-making in fault diagnosis is proposed. A new combination rule 48 is built to allocate the conflicted information from multi-sensors based on the support degree of focal element in order to solve the uncertain information.
In this article, a method of engine fault diagnosis based on sensor data fusion is proposed. The feature matrix and diagnosis matrix are constructed for not only singletons but also multiple hypotheses. The mass functions are obtained by the comparison of two matrixes and combined by Dempster’s combination rule. Decision is made according to the results. The main advantage of the proposed method is that the multiple hypotheses are taken into consideration so that uncertain information can be represented and fused efficiently.
The rest of the article is organized as follows. Section “Preliminaries” introduces the preliminaries. Section “An evidential fault diagnosis” presents the new method developed in this study. In section “Application and discussion,” the validity and reliability of the proposed approach are tested in a real application. The study is briefly concluded in section “Conclusion.”
Preliminaries
In this section, some preliminaries are briefly introduced.
Dempster–Shafer evidence theory
Dempster–Shafer evidence theory31,32 (abbreviate as evidence theory) has many advantages to handle uncertain information. First, evidence theory allows probability masses to be assigned to not only singletons but also multiple hypotheses rather than only singleton subsets in comparison to the probability theory. Second, information from different sources can be combined without a prior distribution. Third, instead of forced to be assigned to some singleton subsets, a degree of ignorance can be allowed in some situations. A few basic concepts are introduced as follows.
Let

The set
If
For a frame of discernment

which satisfies the following condition

In evidence theory, a mass function is also called a basic probability assignment (BPA). BPA reflects the degree of evidence support for the proposition of A in recognition framework. If
Assume there are two BPAs indicated by
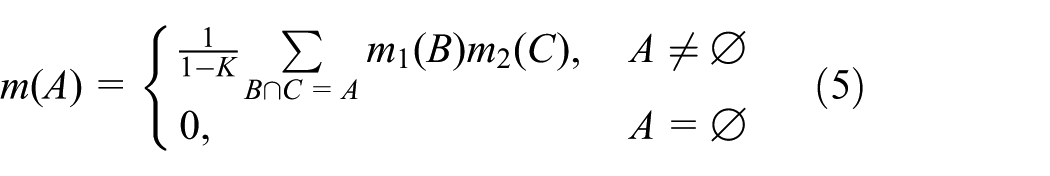
where

In evidence theory, K is a coefficient to measure the conflict between evidence. Note that Dempster’s rule of combination is only applicable to such two BPAs which satisfy the condition
An evidential fault diagnosis
A new method to represent the multiple hypotheses
Assuming N faults of an engine are taken into consideration, the frame of discernment is constructed as

where
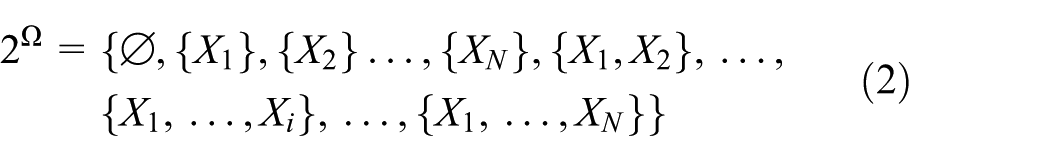
Then, the power set of X is constructed

Here, the multiple hypotheses represent that it is not sure which state in the multiple hypotheses occurs. For example,
It can be seen that there are

For example, when two possible faults of an engine are taken into consideration:
The frame of discernment is established as follows

Then, the power set of X is constructed as follows

Here,
From a sensor attached to the engine, one or more characteristic values that describe some features of the engine can be obtained. Assuming M features and characteristic values are obtained for

where
With regard to
where
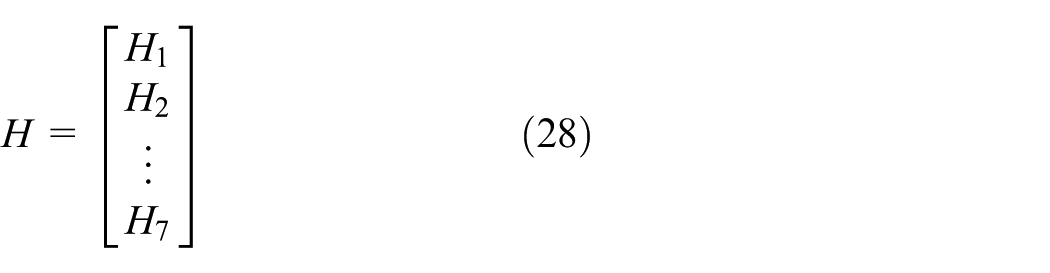
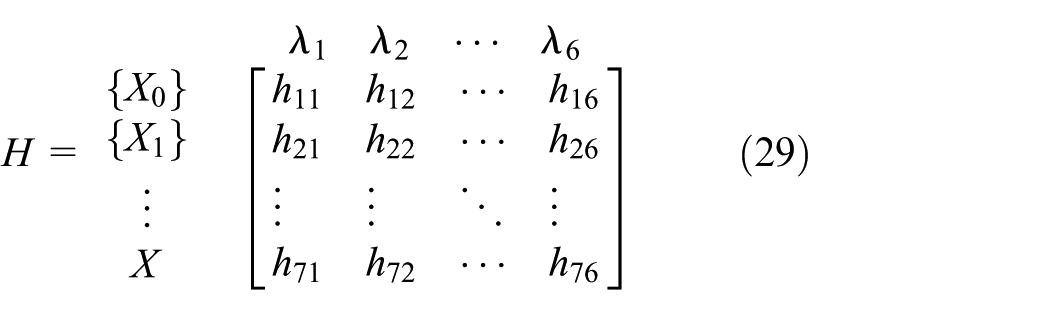
Based on the vectors, a feature matrix can be constructed


For an engine to be diagnosed, several groups of characteristic values can be obtained by the data from the sensors. Here, each group of characteristic values is represented by a diagnosis vector. Assuming L diagnosis vectors is measured, a diagnosis matrix is constructed to represent the engine’s real state


Each row of the diagnosis matrix functions as a piece of evidence in the fault diagnosis.
Construction of mass functions
How to determine the BPAs is still an open issue.
53
In this article, the smaller the discrimination between
First, the discrimination degree between the feature vectors and diagnosis vectors is calculated. Take a diagnosis vector
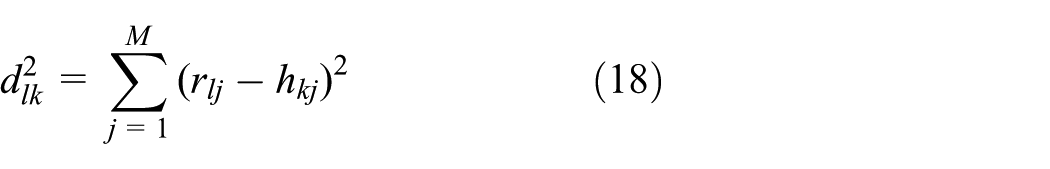
Once the discriminations between

The kth column of equation (19) represents the discrimination degree between
The similarity measure between

Then, the similarity matrix is established

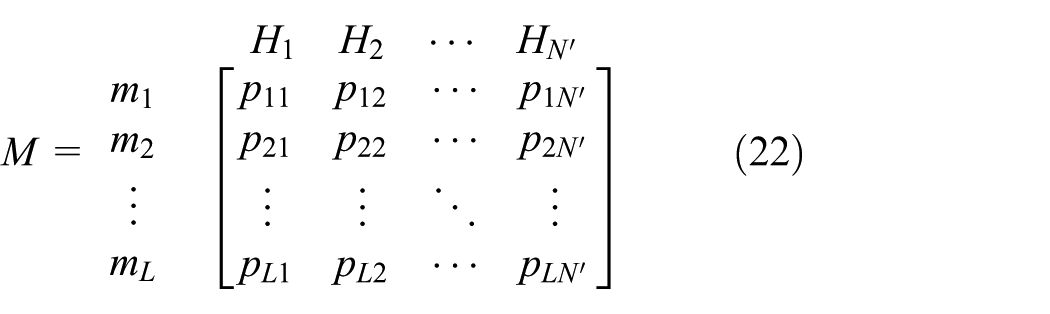
The mass functions are obtained by normalizing the similarity matrix s, shown as follows
Combination and decision
According to equation (22), L mass functions

According to equations (8) and (9),

Decision is made on the base of this mass function. The engine is free of any faults if
The decision-making process is detailed as follows: after obtaining the final result combined by L original mass functions according to data from the sensors, the state of the engine is determined if one BPA is obviously greater than the others. Here, it is suggested that the state of the engine can be obtained if

If
A simple example will illustrate the decision rule. Assume a frame of discernment

Here,

If the basic probability functions are obtained as follows

It can be easily seen that

which satisfy equation (25) when
The algorithm of the proposed method
In summary, the algorithm of the proposed method is shown in Figure 1 and detailed as follows:
Step 1. Construct the frame of discernment and the power set.
Step 2. Construct the feature matrix based on the reality and experience.
Step 3. Collect the characteristic value and establish the diagnosis matrix by data from sensors.
Step 4. Compare the feature matrix and the diagnosis matrix to get the discrimination matrix, similarity matrix, and mass functions eventually.
Step 5. Combine the mass functions by evidence theory.
Step 6. Make decision based on the final result.

The flowchart of the proposed method.
Application and discussion
A practical application of the proposed method
In this section, an application is given to show the proposed fault diagnosis method. In this case, two possible faults of an engine are taken into consideration:
The fault diagnosis of an engine is as follows:
Step 1. First, as follows, a frame of discernment is established

Then, the power set of X is constructed as follows

Step 2. A feature matrix is constructed based on the previous knowledge and experience with regard to the characteristic values. In this experiment, two acceleration sensors and one acoustic sensor are used to obtain the original data. One acceleration sensor is mounted on the cylinder cover near the outlet valve. Another is mounted on the cylinder cover near the inlet valve. Their peak-to-peak value (P-to-P) in the time domain and the frequency of the maximum spectrum (
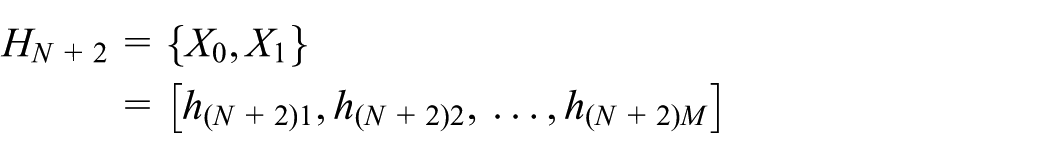
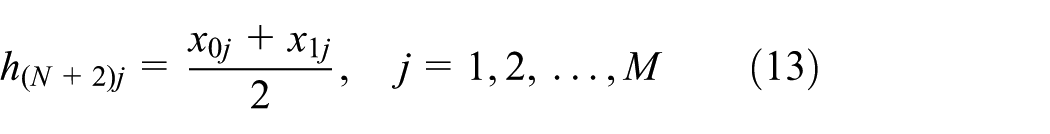
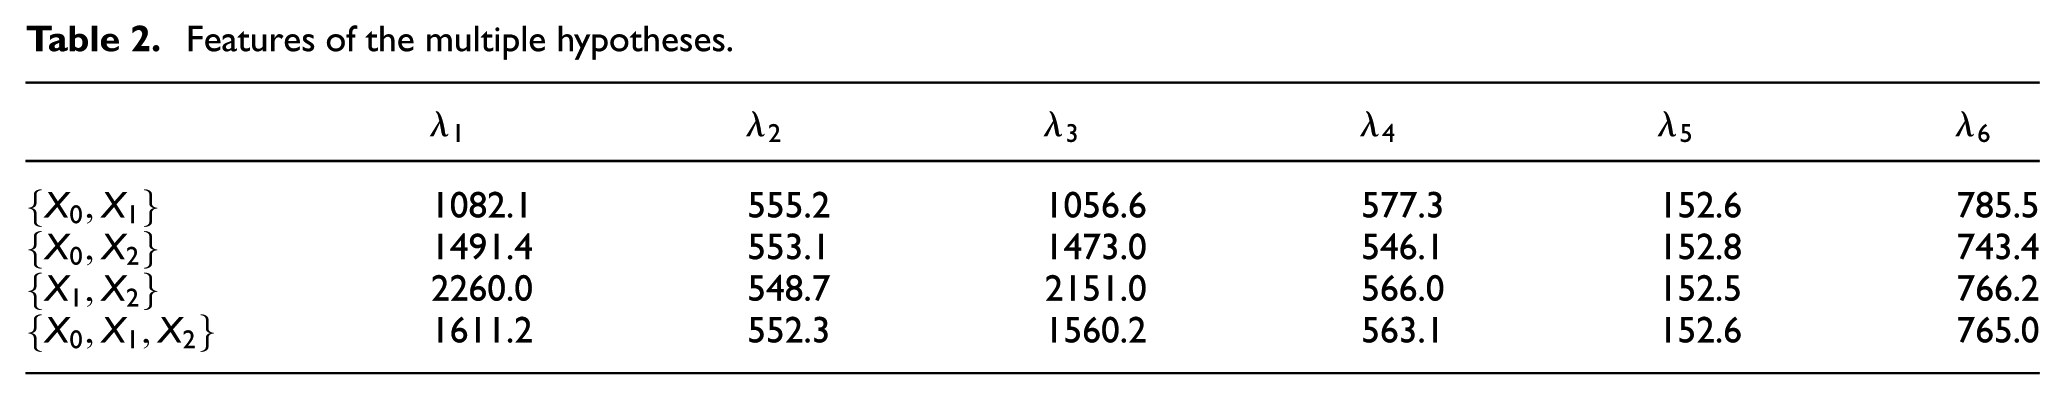
For convenience, the values of the singletons are shown in Table 1. According to equation (13), the values of the generated multiple hypotheses are obtained and shown in Table 2.
Features according to previous knowledge.

Features of the multiple hypotheses.
Step 3. Then, the characteristic values of the features are collected and a feature matrix is constructed by data from sensors as follows


It can be seen that four diagnosis vectors are obtained and shown in Table 3.
Features according to diagnosis vectors.

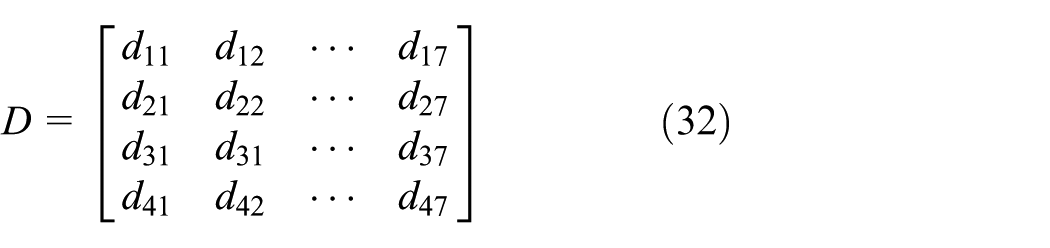
Step 4. In this step, equations (18)–(22) are utilized to construct the discrimination matrix, similarity matrix, and mass function matrix. The discrimination matrix is constructed by equation (18) and the data in Tables 1 and 3
The results are illustrated in Table 4.
Results of the discrimination matrix.

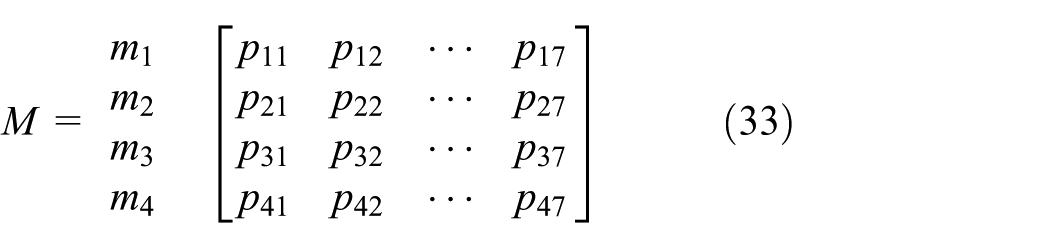
By equation (20), the similarity matrix is constructed. The mass functions are obtained by normalizing the similarity matrix. The results are shown in matrix M and Table 5
Basic probability assignments of the states of the engine.
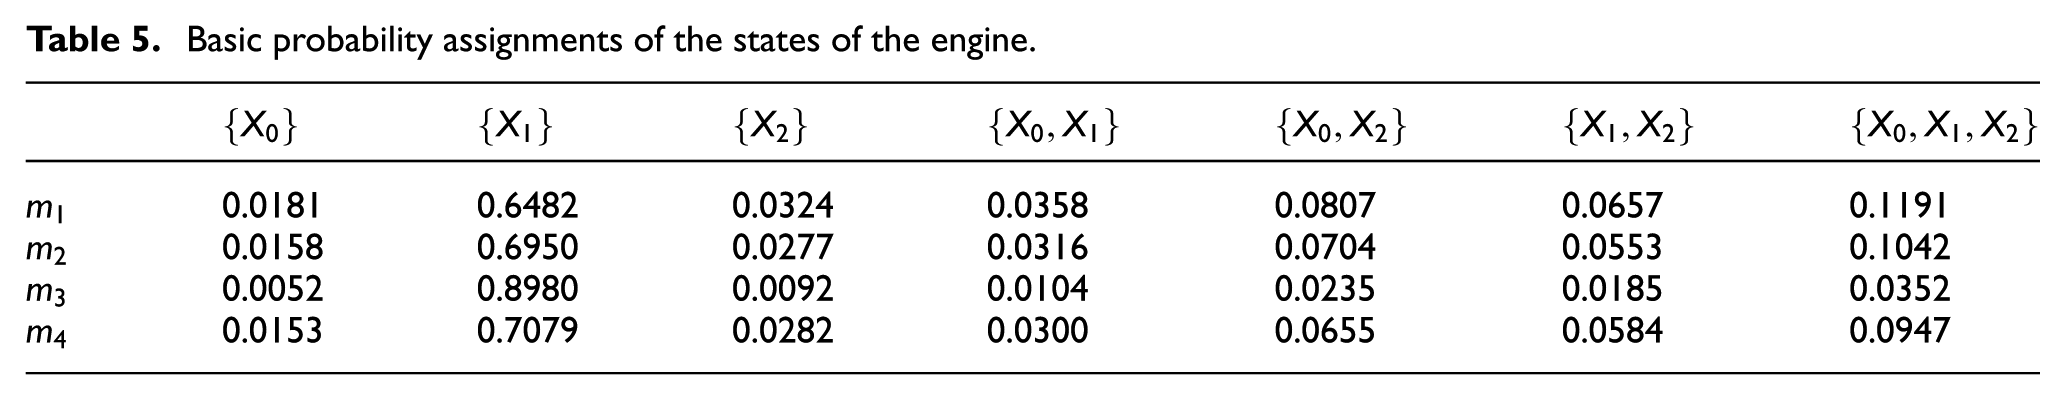
Step 5. Four mass functions

Step 6. It can be easily seen that the BPA of
Compare the combination of four groups of mass functions and the combination of the former two, which is shown as follows

The more the diagnosis vectors, the more reliability of the combination result.
In some cases, the largest result may be a multiple hypothesis. For example, the BPA of
Reliability analysis
In this section, the reliability of the proposed methods is analyzed by a program which simulates the random error in actual measurement. Suppose a fault of the engine exists and we are asked to diagnose the engine by data obtained from the sensors with regard to the features. Equation (25) is regarded as the decision criteria in this analysis.
Here, piston ring fault (
Performance accuracy when one piece of evidence is used.

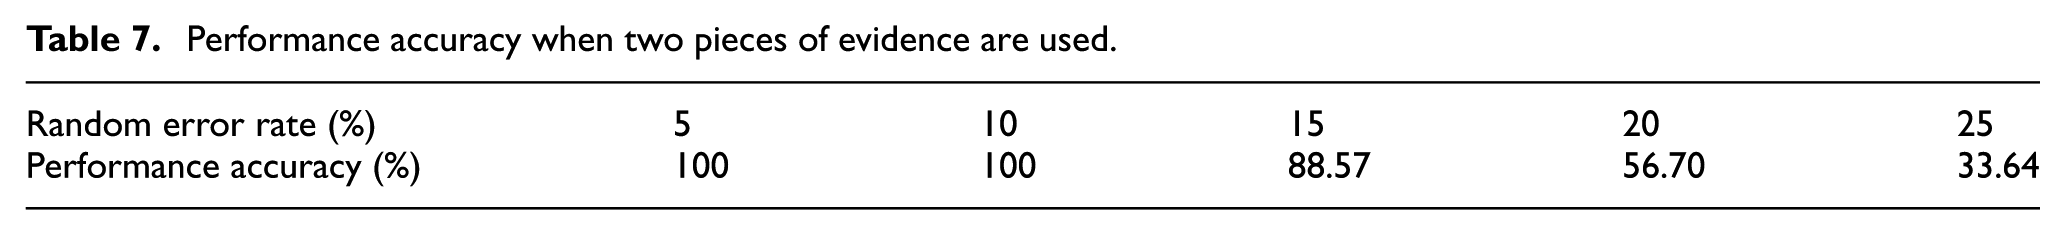
When combining more evidence and the proposed method is applied, its performance is improved as a result of the fusion method. The performance accuracy when two and three pieces of evidence are used is shown in Tables 7 and 8, respectively. It indicates that using more evidence can reduce the influence of the random error in actual measurement and increase the reliability of the proposed method.
Performance accuracy when two pieces of evidence are used.
Performance accuracy when three pieces of evidence are used.

Comparison with the typical method
In this section, a comparison is made between the typical method and the proposed method in this article.
Basir and Yuan
44
had used three sensors (
Performance accuracy of the typical method when different numbers of sensors are used.

From the angle of the model construction, in the typical method, the mass functions of multiple hypotheses are set to 0, which reduces the calculation amount but limits this method to cases where it is clear that no more than one fault happens to the engine. However, considering the multiple hypotheses, the proposed method not only keeps the virtue of the typical method but also provides more uncertain information to the decision-maker to recognize cases where two or more faults happen at the same time.
Conclusion
In this article, a new method of engine fault diagnosis based on sensor data fusion is presented. First, the construction of the frame of discernment is determined. Then, feature matrix and diagnosis matrix are constructed with regard to focal elements in the power set. The advantage of the proposed method is that the multiple hypotheses are taken into consideration. Several mass functions of the sensor reports are obtained by the discrimination degree between the feature matrix and diagnosis matrix. Then, the final diagnosis result is obtained by the combination of several sensor reports. Decision is made based on the final fusion result. The effectiveness of the algorithm is demonstrated by a practical fault diagnosis application.
Footnotes
Academic Editor: Philip Park
Declaration of conflicting interests
The author(s) declared no potential conflicts of interest with respect to the research, authorship, and/or publication of this article.
Funding
The author(s) disclosed receipt of the following financial support for the research, authorship, and/or publication of this article: This work was partially supported by National Natural Science Foundation of China (grant no. 61671384), Natural Science Basic Research Plan in Shaanxi Province of China (program no. 2016JM6018), the Fund of SAST (program no. SAST2016083), and the Seed Foundation of Innovation and Creation for Graduate Students in Northwestern Polytechnical University (program no. Z2016122).