
Abstract
In order to reduce temperature difference between the web and flange of the H-beam and in the height direction of the web, the spray cooling technology has been proposed to control the temperature difference when the H-beam left the finishing rolling mill. An experiment of spray cooling for a heated plate has been performed, and this cooling process has been simulated using the computational fluid dynamics software Fluent. The re-normalization group k–ε model has been adopted in this study to simulate turbulence model with discrete phase method. And the temperature fields of the simulated are compared with those of the experiment to verify the correctness of the simulation method. Moreover, a three-dimensional of 1/2 H-beam spray cooling model has also been established. In order to obtain a better cooling effect, the angle between the nozzle center outside the R angle and the inner surface of the flange is defined as 45° and the distance between them is defined as 140 mm. The working pressure of the nozzle, the mean droplet size, and the water flow rate are also suggested to be 0.25 MPa, 150 µm, and 16 L/min, respectively. The recommended nozzle interval in the rolling direction is 300 mm to uniform the temperature distribution along the length direction. The temperature difference between the web and flange of the H-beam and the temperature difference in the height direction are decreased 234°C and 71.8°C, respectively.
Introduction
H-beam owns a unique thin-walled structure and is widely used in many fields. But huge temperature difference exists between the web and flange of the H-beam and in the height direction of the web when it is rolled to produce the complex section using universal mill. The mean temperature difference of hot-rolled H-beam on the web and flange is 242°C and 77°C, respectively, obtained by thermal imager. Complex metal flow and plastic deformation are generated between the web and flange, the height direction of the web during this rolling process. Present studies show that these temperature differences are the main reasons to cause the residual stress. 1 Cooling techniques have been proposed to decrease this uneven temperature distribution after hot rolled. Although the air cooling and forced water cooling methods are widely adopted in the metallurgical industry, the air cooling after rolling is unable to meet the needs of high-performance products, and the cooling water is accumulated between the web and flange if the forced water cooling method is used. Therefore, spray cooling technology is suggested to reduce the temperature difference of H-beam. But there is no mature spray cooling technology applied to the H-beam because of its complex section. A number of academic groups around the world have made various studies on this problem.
The mechanism of spray cooling is that the air and liquid are mixed in the nozzle, and this atomize water is injected directly onto the high-temperature surface. Scholars made many researches on drop formation mechanisms, 2 droplet velocity, 3 bubble dynamics, 4 pool or film boiling,5,6 and heat and mass transfer.7–11
Moreover, the experimental methods are used to investigate different spray parameters on the cooling effect.12–14 Due to the limitations of the experimental methods, simulation methods are widely adopted. Pautsch and Shedd 15 established the mathematical model of liquid film distribution in the spray cooling based on the principle of dynamics. Lal et al. 16 represented a comprehensive computational fluid dynamics (CFD) analysis of convective nucleate boiling from a horizontal wall. Huang et al. 17 created CFD model and analyzed the heat exchange between the fog droplets and high-temperature surface. What is more, X Li and I Zbiciński 18 and H Montazeri et al. 19 studied the spray drying process and evaporative cooling by water spray system. And a sensitivity analysis focused on the impact of the turbulence model for the continuous phase has been finished.
Although the controlled cooling technology of H-beam is very complex, it is studied in recent years. Liu et al. 20 and Guo et al. 21 established a two-dimensional model for H-beam during controlled cooling. But the temperature distribution on the rolling direction is neglected. Other scholars22–25 adopted three-dimensional models to simulate water cooling or spray cooling of hot-rolled H-beam. However, the surface heat transfer coefficients in these models were obtained using empirical formula. Moreover, the initial temperature field of hot-rolled H-beam for controlled cooling is not considered in these models.
In this article, a three-dimensional H-beam spray cooling model has been established using software Fluent. And the re-normalization group (RNG) model has been adopted in this model to simulate turbulence model with discrete phase method. Moreover, an experiment of spray cooling for a square steel plate has been performed. The results of the CFD simulation were compared with the experiment to verify the correctness of the model and the simulation method. The relevant parameters of spray cooling for the cooling effect of the hot-rolled H-beam have also been discussed. A reasonable cooling scheme has been proposed to achieve the purpose of uniform temperature distribution for the hot-rolled H-beam.
Temperature field distribution of H-beam
In the current production conditions of the hot-rolled H-beam, air cooling is adopted in the production line when it leaves the rolling mill. In order to understand the temperature distribution of H-beam, the temperature field of H700 × 300 H-beam is measured using thermal imager when it leaves the rolling mill (Figure 1). According to these temperature measurement data, the maximum temperature reached 910°C in the R angle of the H-beam and the minimum temperature reached 668°C in the web center of the H-beam. Therefore, there is a big temperature difference between the web and the flange of the H-beam. As can be seen in Figure 2, the difference in temperature on the web and flange is 242°C and 77°C, respectively.
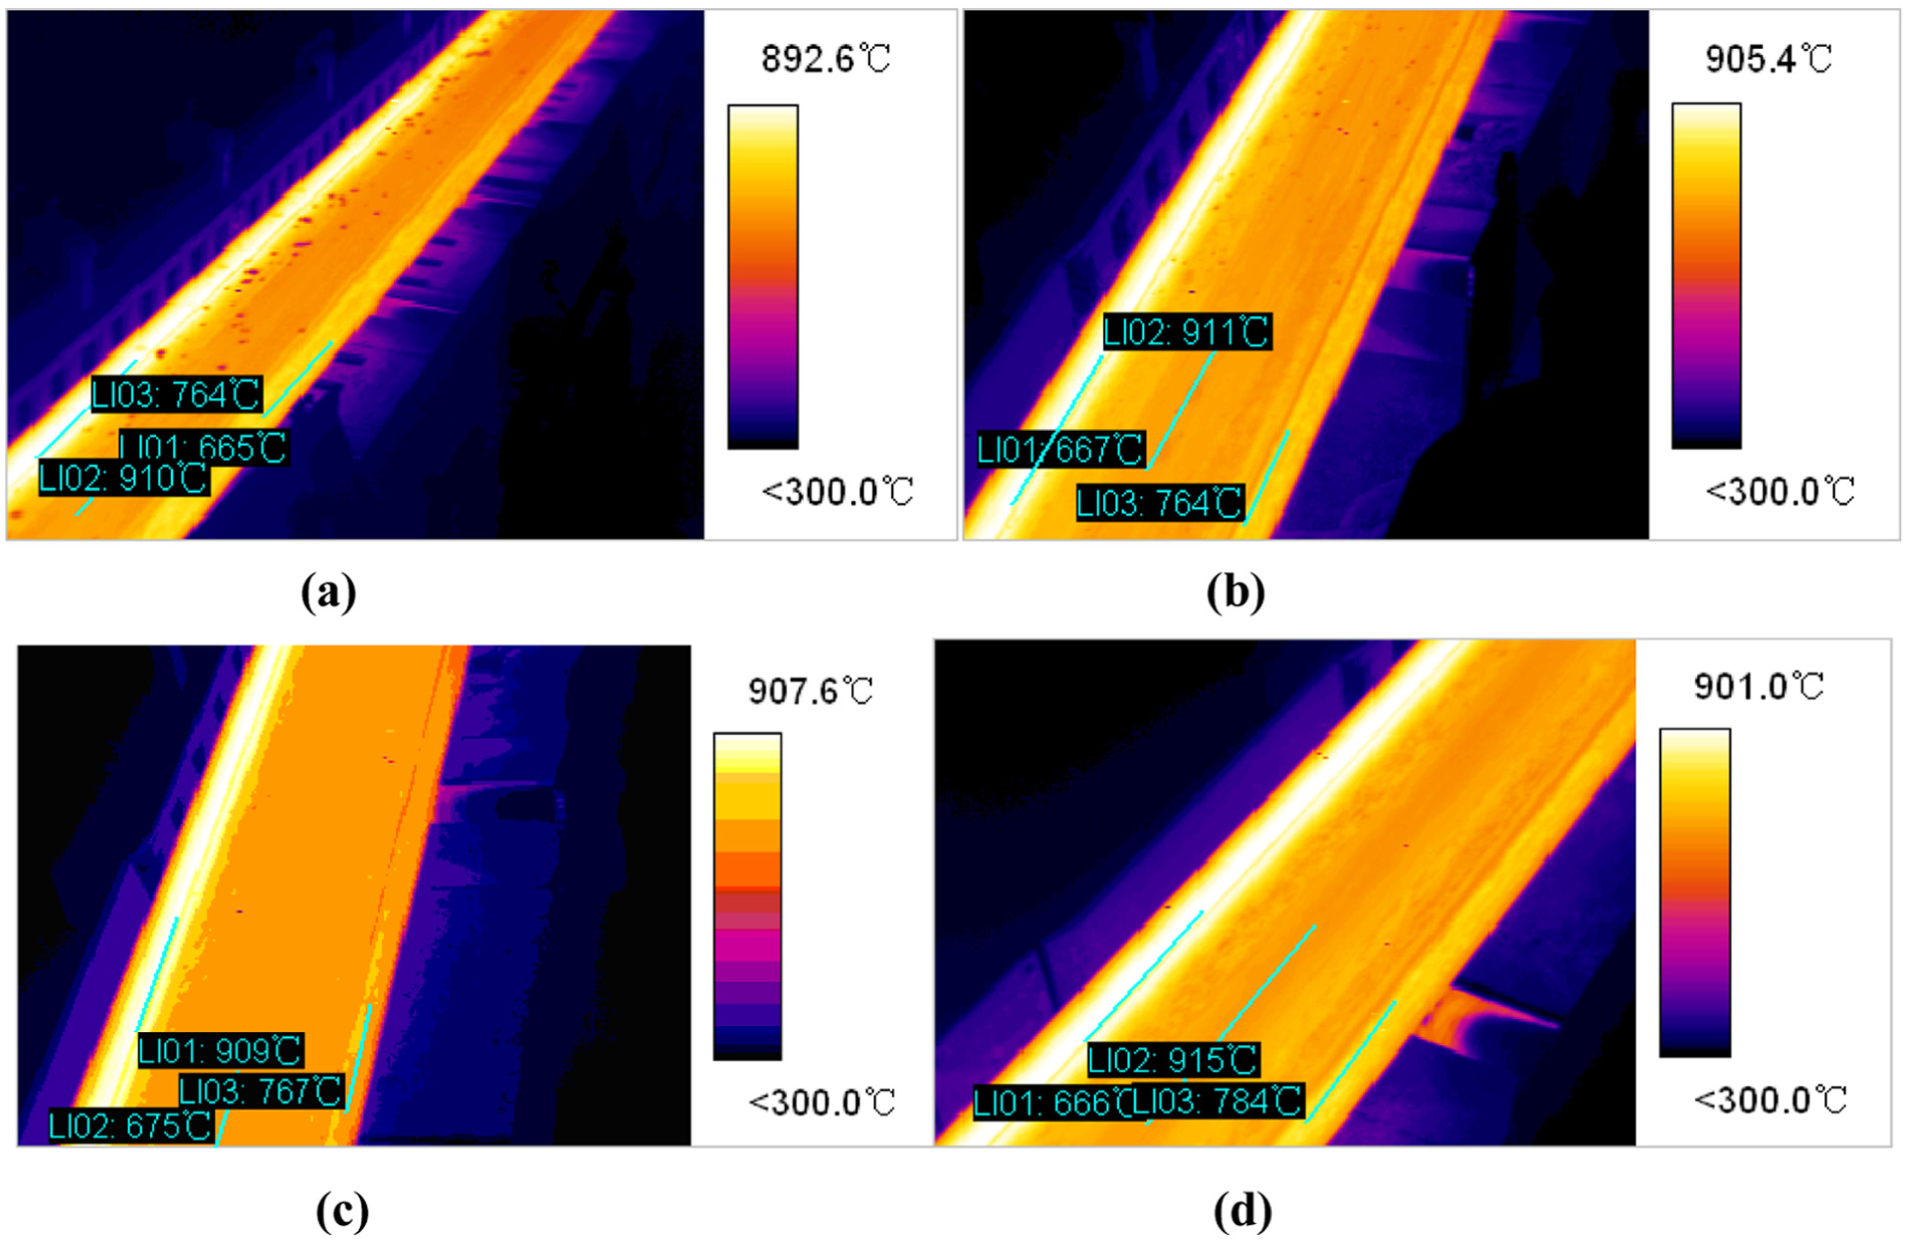
Finishing temperature field of H-beam from the TM export side: (a) the first steel, (b) the second steel, (c) the third steel, and (d) the fourth steel.
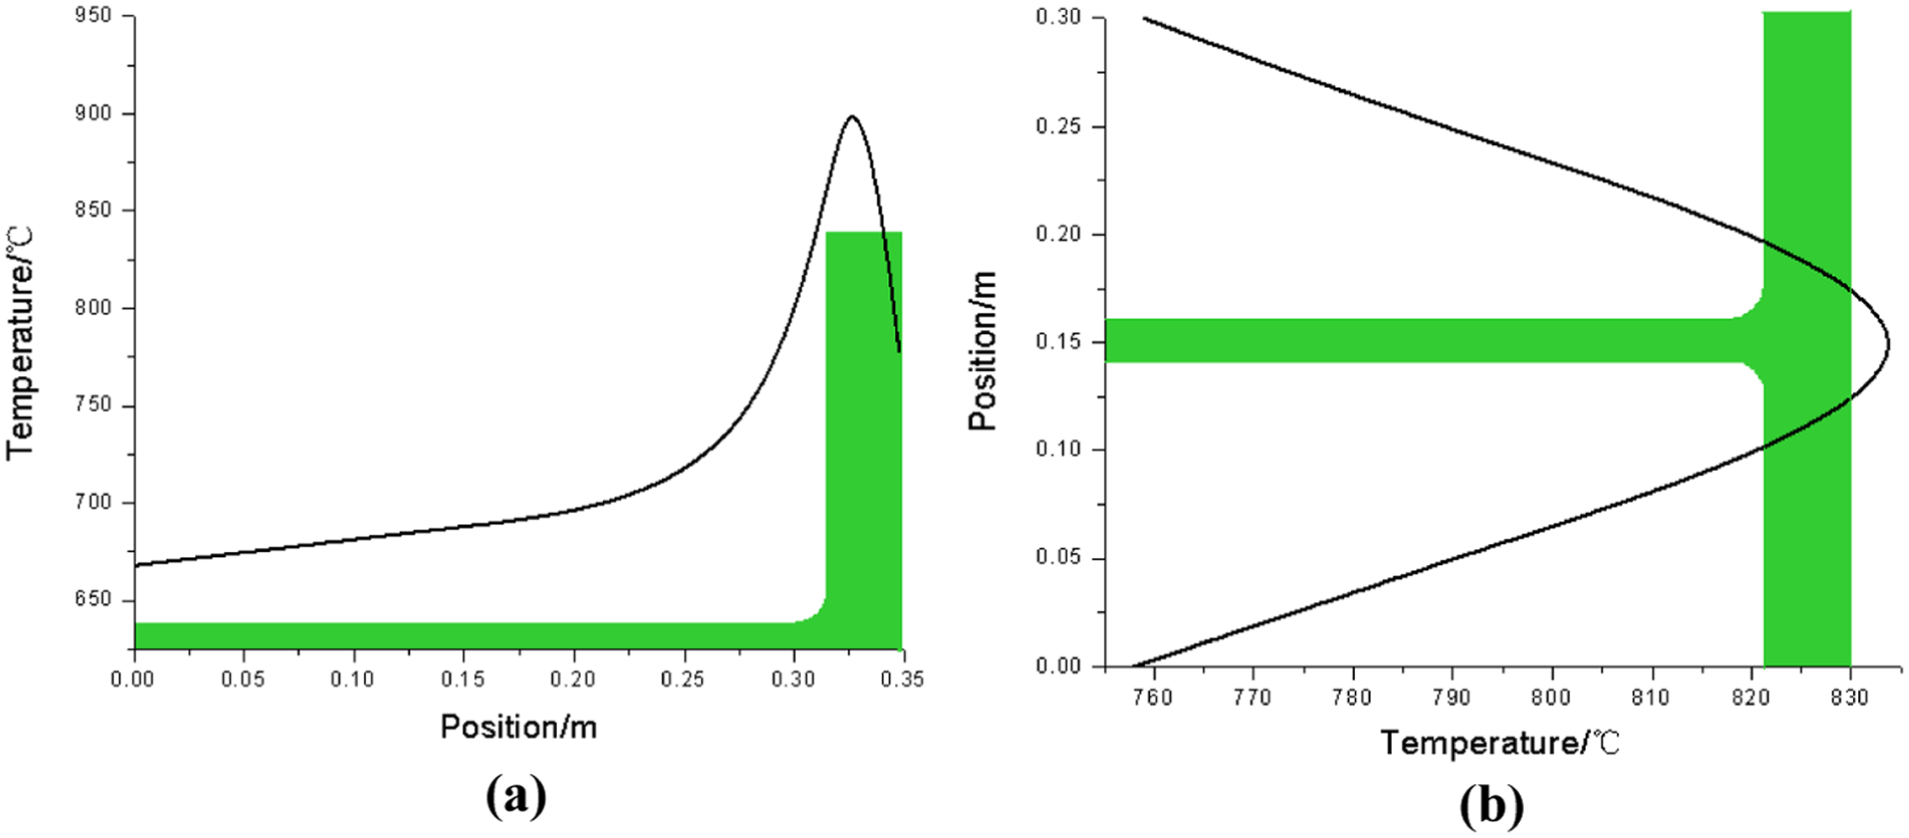
Temperature distribution in different directions: (a) web and (b) flange.
Moreover, obvious temperature difference exists between the flange and web when the beam is cooled half an hour using air cooling in the production line. The highest temperature is still 474.8°C after half an hour of air cooling, and the temperature difference between flange and web is 42.5°C (Figure 3). Obviously, these results indicate that the natural air cooling cannot meet the purpose of uniform temperature distribution for the hot-rolled H-beam.
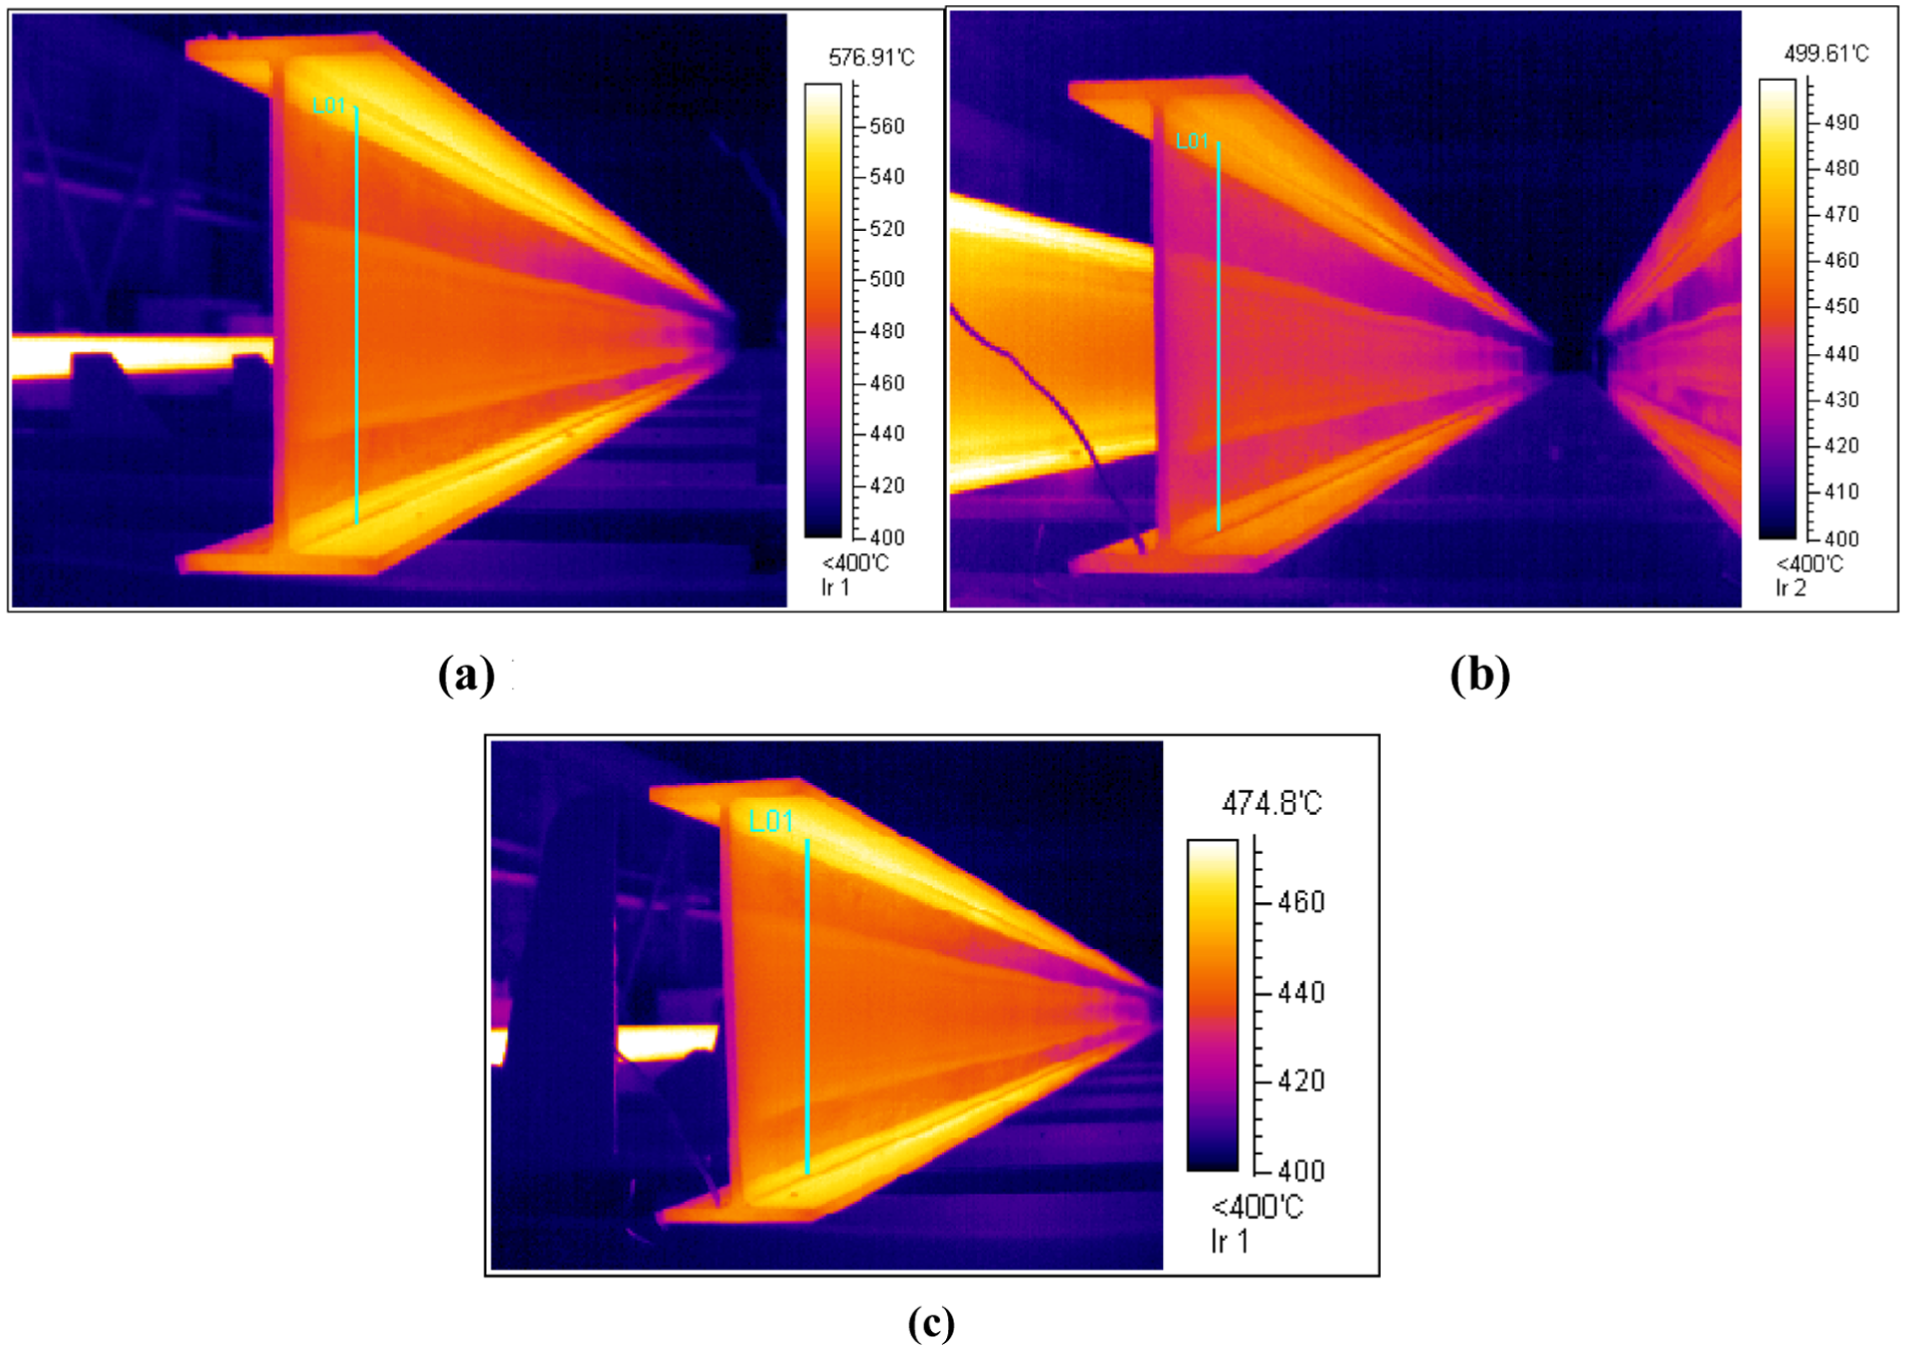
Temperature field at different time under air cooling: (a) 15 min, (b) 20 min, and (c) 30 min.
Although water cooling is able to quickly reduce the temperature of the rolled piece, cooling water will be accumulated between the web and flange due to the structure of the hot-rolled H-beam. Moreover, the temperature of web is rapidly decreased because of the accumulated water, and the temperature difference between the flange and the web may be further increased. Therefore, the method of water cooling is not suitable for the uniform temperature distribution for the hot-rolled H-beam. Spray cooling model technology has been suggested to uniform the temperature distribution of the hot-rolled H-beam, and cooling water cannot be accumulated on the surface of the H-beam. But this spray cooling technology has not been successfully adopted in the area of H-beam rolling process. It is necessary to study the spray cooling technology for the hot-rolled H-beam.
Experiment of spray cooling
Although spray cooling technology has been widely adopted in metallurgical industry, it is very complex for hot-rolled H-beam since the unique structure of H-beam and the difficulty of carrying out the spray cooling test for hot-rolled H-beam. Therefore, a heated plate has been cooled using spray cooling technology, and this cooling process has been simulated. The correct simulation method has been obtained by the test results. And this simulation method is applied on the spray cooling technology for the hot-rolled H-beam.
Establishment of the experimental model
Spray cooling can be divided into direct pressure atomization and gas-assisted atomization. This article adopted direct pressure atomization. In order to compare the results of simulation with the test results for the spray cooling, a spray cooling experiment for a heated steel plate has been designed. This schematic diagram of experiment is used for heating the samples and measurement of the sample temperature during spray cooling (Figure 4). During this process, a Q235 steel plate of dimensions 300 mm × 300 mm × 10 mm (length × width × height) surface area is selected for this study. The thermal physical parameters of Q235 are shown in Table 1. Before the experiment, the steel plate is fixed on a base plate (Figure 5). The thermal insulation material is filled between the steel plate and base plate. In order to obtain the plate temperature during the spray cooling experiment, several sheathed thermocouples are fixed in the bottom of the steel plate to monitor the temperature. The distribution of temperature measuring point is shown in Figure 6.

Schematic diagram of experimental setup.
Thermal physical parameters of Q235.

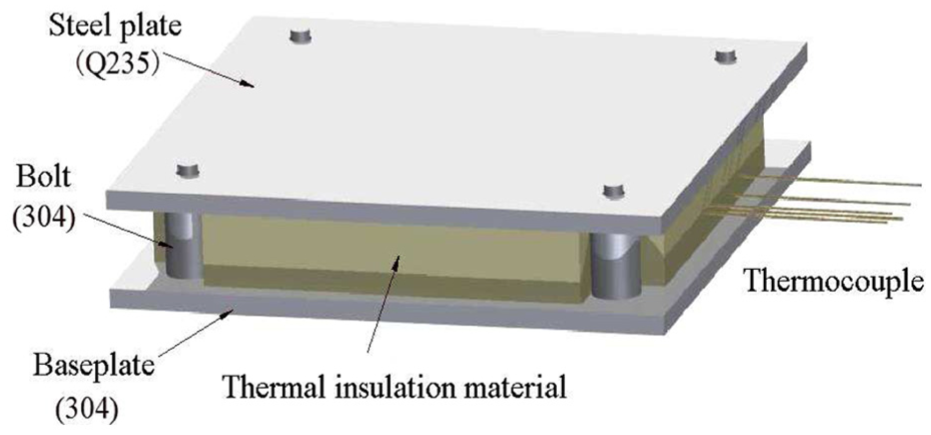
Structure diagram of experimental work piece.
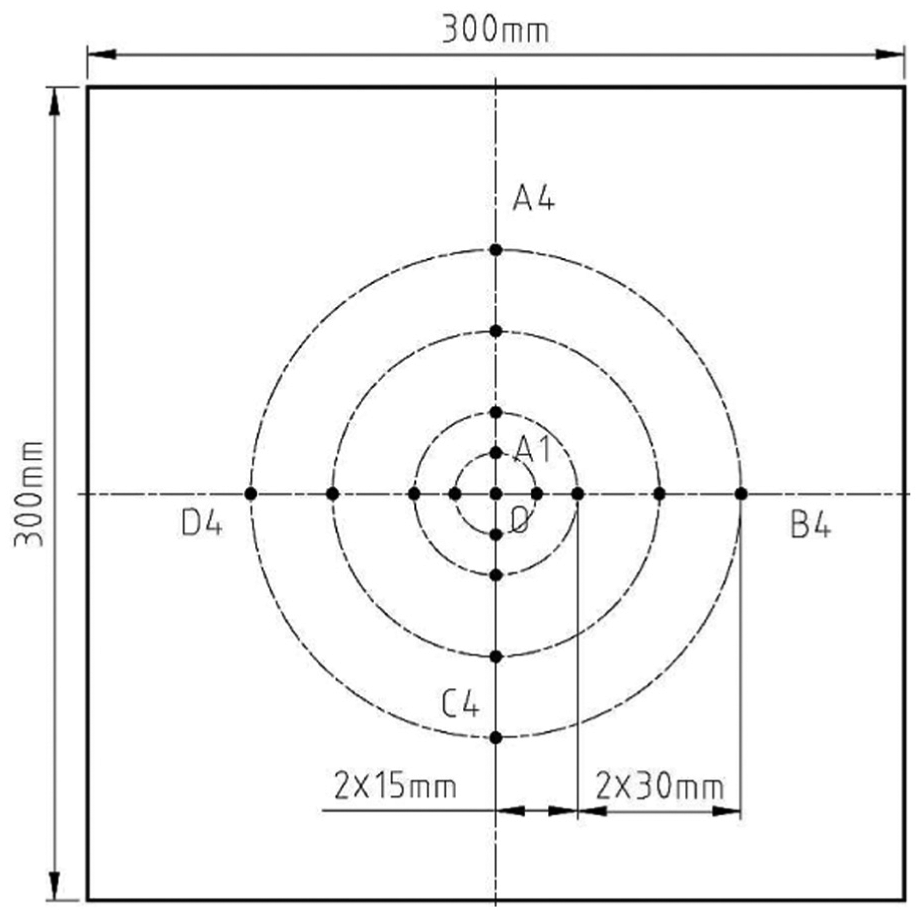
Distribution of temperature measuring point.
This plate is heated to a temperature of 900°C in an electric heating furnace and placed in the furnace for a period of time to ensure the plate temperature uniformity. When the temperature of the plate meets the requirement, it is delivered to the experiment table for spray cooling. The detailed parameters of spray cooling experiment are shown in Table 2.
Parameters of experiment.

Simulation model of spray cooling
CFD method is used for simulation. A computational grid model of the spray cooling for steel plate is made using the former processing software Gambit (Figure 7). The model is divided into two regions, steel plate and jet region. Hexahedral mesh grids are adopted in the whole model. The whole model includes 187,200 elements. The initial conditions of simulation are consistent with the experiment. Then, the mesh file is imported to the software Fluent.

Computational domain and grid of the steel plate model: (a) overall view and (b) top view.
In software Fluent, multiple jet sources can be chosen for users. In this article, the type of surface jet source is selected, ignoring the nozzle inner structure. Particles are thrown out from these surfaces. The particle type of droplet is implemented. This type of particle follows the roll of force balance and is affected by heating/cooling

in which
The droplet evaporation determined by diffusion gradient as follows

in which
RNG k–ε model can handle with high strain rate and larger streamline curvature of flow better. It is effective for fully developed turbulent. The imbalance in the strain rate of flow and the impact of streamline curvature for missing item in
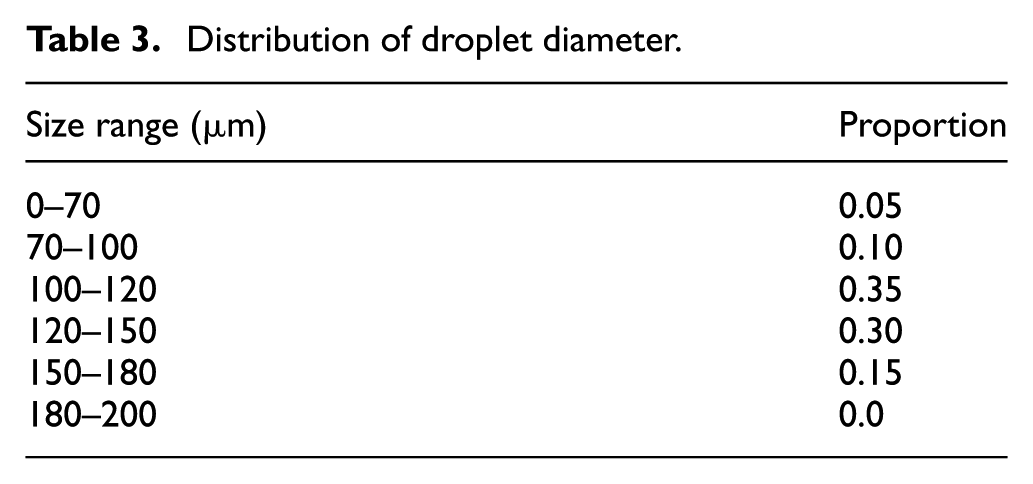
In order to simulate the actual situation, Rosin–Rammler model is used to simulate the droplet size distribution. This model assumes an exponential relationship between the droplet diameter, d, and the mass fraction of droplets,

in which
Distribution of droplet diameter.
In order to improve the convergence of calculation, the SIMPLE-consistent (SIMPLEC) is used for pressure–velocity coupling. Lagrangian–Eulerian approach is implemented to simulate discrete phase. The Navier–Stokes (N-S) equation is solved in the Euler framework for the continuous phase fluid and particle trajectory in the Lagrange framework for discrete phase.
Comparison and analysis of experimental model and simulation model
After 100 s of spray cooling, the cooling effect of experiment and simulation can be seen in Figures 8 and 9, respectively.
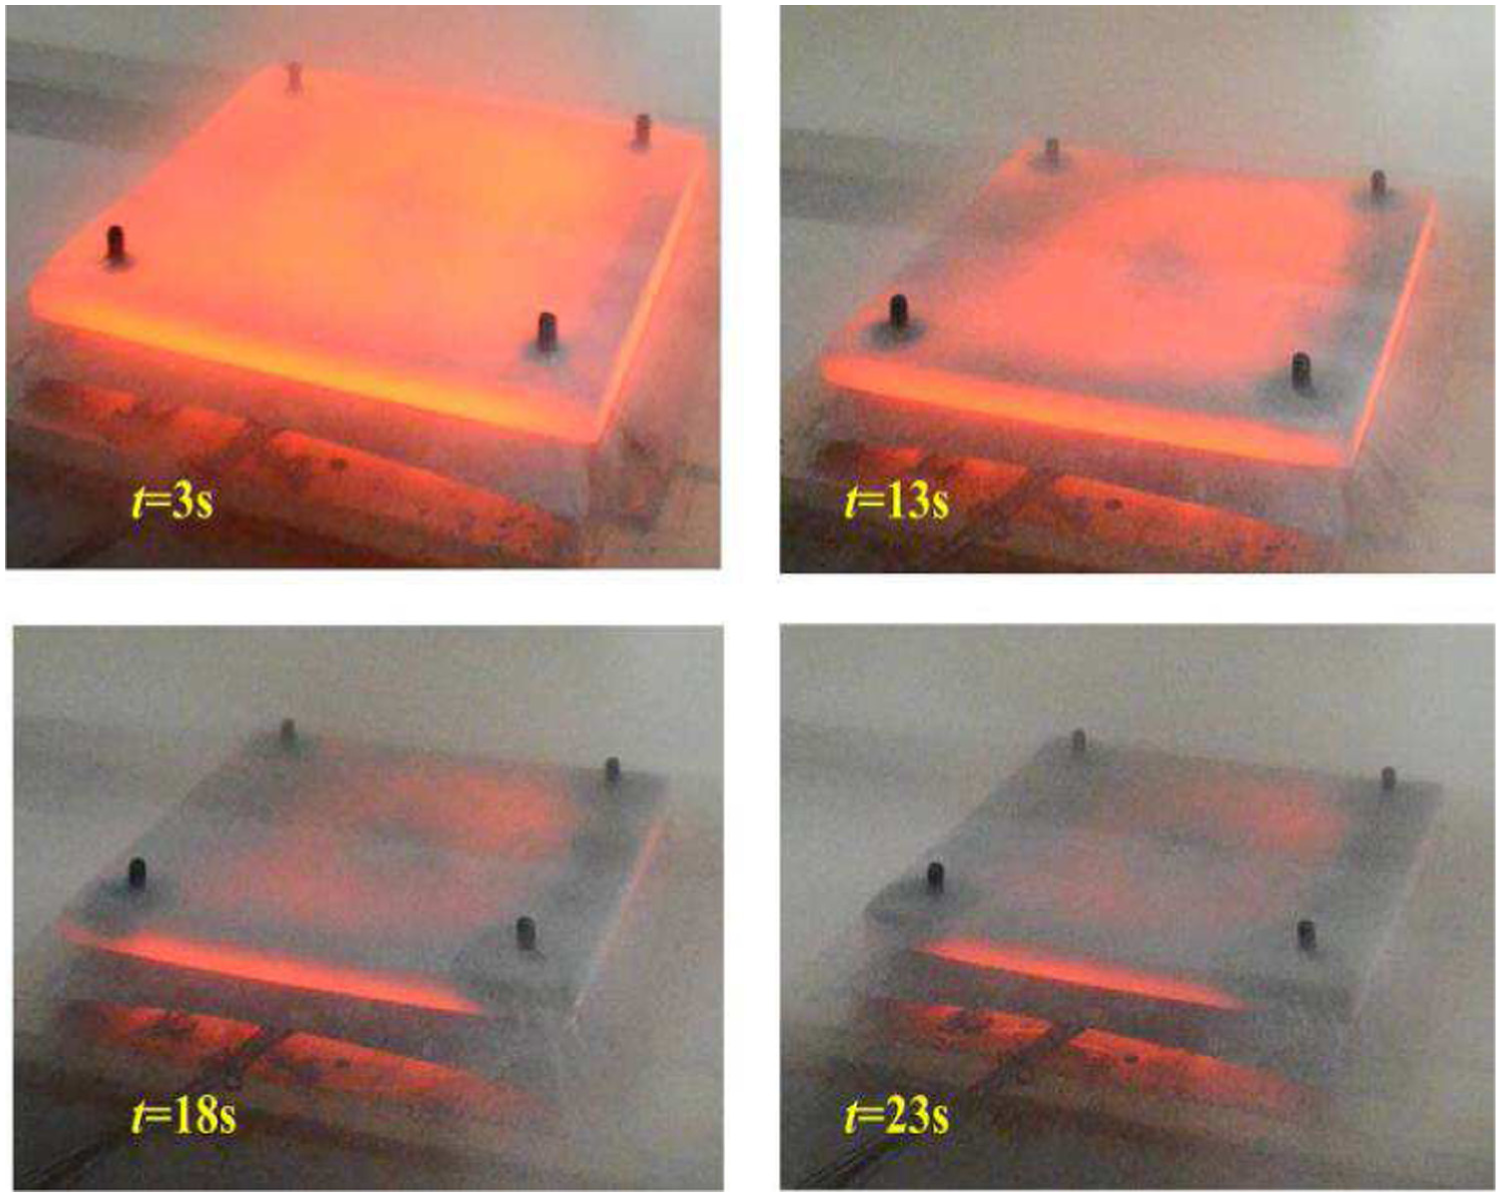
Spray cooling effect of experiment (P = 0.4 MPa).

Spray cooling effect of simulation (P = 0.4 MPa).
The simulation temperatures of the plate are compared with the monitoring temperature during the cooling experiment process (Figure 10). The center point and the outermost point are chosen to be discussed. Cooling rate increased significantly with the increasing nozzle pressure. The maximum error is 11.83% when the nozzle pressure is 0.2 MPa. And the maximum error is 18.19% when the nozzle pressure is 0.4 MPa. It is mainly because that thermal insulation material slows down the heat dissipation of the experimental plate. In addition, the simplified model does not consider the friction inside the nozzle. So, the cooling speed is slightly faster than the experiment. From above, the curves indicate that the simulation results agree relatively well with the measured data. Therefore, spray cooling process of the H-beam can be investigated using this method.

Instantaneous temperature contrast simulation with experiment: (a) 0.2 MPa and (b) 0.4 MPa.
CFD simulation of H-beam spray cooling model
Establishment of the H-beam spray cooling model
According to the temperature field of hot-rolled H-beam, a three-dimensional model of spray cooling system is established (Figure 11). Three nozzles are placed in the upper and lower sides of the web and outside the flange, respectively. The angle between the nozzle center outside the R angle and the inner surface of the flange is defined as 45°. The nozzle outside the flange sprays vertically on the flange.

Position of the spray system.
Since the CFD simulation method of spray cooling is well understood, this simulation method is applied on the spray cooling technology for the hot-rolled H-beam. The actual H-beam size is 700 mm × 300 mm × 13 mm × 24 mm, and the material is Q235 (Table 1).
A computational model is made of the spray cooling for hot-rolled H-beam with dimensions of 0.45 m ×0.3 m × 0.2 m, and the computational grid of the whole model is shown in Figure 12. The model is divided into 13 regions. Spray areas and R angle of H-beam are the critical areas of calculation, so grids in these regions are refined. The model mainly adopts hexahedral mesh grids, except partial tetrahedral unstructured grids for irregular region. The total number of grid is 215,773, and the number of node is 153,124. Pressure inlet is adopted in this study. In the simulations, the pressure inlet is set from 0.2 to 0.4 MPa, to simulate two different injection pressure conditions. Zero static gauge pressure is applied at the outlet plane. The turbulent kinetic energy k and turbulence dissipation rate ε are kept as defaults. The thermal boundary condition at the inlet and outlet is a constant temperature of 27°C. In addition, “escape” boundary condition is used at the outlet, where droplets leave the computational domain. In order to understand the temperature distribution of H-beam after finishing rolling of H-beam, the main boundary conditions are defined (Table 4).

Computational domain and grid of the H-beam model: (a) overall view and (b) front view.
Initial conditions and boundary conditions.

Simulation of single nozzle spray cooling process
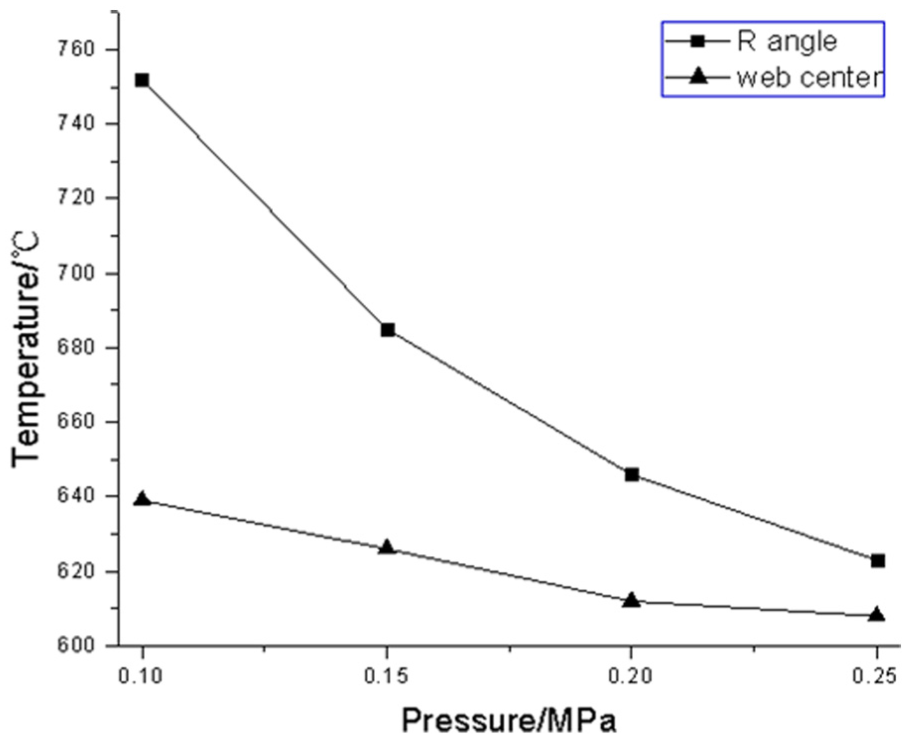
In order to study the effect of different cooling process parameters on the cooling effect, different models are simulated in 10 s. The temperature of special position of H-beam under different working pressures has been shown in Figure 13. Surface heat transfer coefficient has also been chosen to measure the cooling effect. The relationship between surface heat transfer coefficient and working pressure has been shown in Figure 14. As can be seen in Figure 13, when the injection pressure is 0.25 MPa, the drop rate of temperature is the fastest. Especially, the temperature of R angle decreased from 912°C to 632°C in this working condition. The temperature difference between R angle and web center decreased from 115°C to 23°C when the injection pressure increased from 0.1 to 0.25 MPa. Moreover, the surface heat transfer coefficient increases when the injection pressure increases. The maximum heat transfer coefficient of R angle is 636.8 W/m2 K when the injection pressure is 0.25 MPa, as shown in Figure 14. Thus, the work pressure of water spray is selected to be 0.25 MPa for better cooling effect.
Temperature difference between R angle and web center.

Surface heat transfer coefficient of R angle.
According to the study method of working pressures, the cooling effects of different process parameters such as the droplet particle diameter, jet distance, and jet angle have also been investigated (Figure 15).

Influence of different conditions on the cooling effect: (a) mean droplet size, (b) nozzle on flange, and (c) nozzle on R angle.
As can be seen in Figure 15, the following conclusions have been obtained:
The temperature difference between the web and flange of H-beam decreased when the mean droplet size increased. It reduced to 18.5°C when the mean droplet size increased to 150 µm. In the mean time, the surface heat transfer obtained the maximum value, which reached 709.78 W/m2 K.
The nozzle outside the flange sprays the flange center vertically; with the increasing jet distance, the temperature difference on the flange first increased and then decreased; when the jet distance L = 150 mm, the model obtained the maximum heat transfer coefficient, which reached 687.7 W/m2 K as well as the minimum temperature difference, which is 45.2°C.
The angle between the nozzle on the R angle and the flange is 45°. The temperature difference between R angle and the center of web first increased and then decreased with the increasing jet distance. The model obtained the best cooling effect, the temperature difference reduced to 48.7°C, and the surface heat transfer coefficient increased to 687.8 W/m2 K when the jet distance L = 140 mm.
The cooling effectiveness increases with the increasing mean droplet size in a certain range. Meanwhile, nozzle distance will affect the cooling effect. When the distance is too close, a mass of water liquids evaporates into water vapors that result in saturated steam. The saturated steam will reduce the amount of thermal transfer. When the distance is too far, the amount of cooling water reaching to the surface of H-beam will decrease. So, the optimal cooling effect can be achieved when the nozzle is in the right place.
According to the results of this study, the reasonable process parameters under single nozzle cooling condition have been proposed. These parameters are shown in Table 5.
Spray cooling process parameters.

When the inlet pressure, droplet particle diameter, jet distance, and jet angle have been confirmed, the H-beam temperature distribution is determined by water-liquid and cool time. The temperature fields of cooling in 80 s under different nozzle flow rates have been obtained. In order to research the temperature difference and obverse the surface heat transfer coefficient of H-beam model more intuitively, some monitoring points are set in the key parts of the model, such as the center of flange, the R angle, and the center of web. Moreover, the temperature variations of these areas are monitored and shown in Figure 16.

Temperature variation of different monitoring points: (a) R angle and (b) web center.
The cooling speed reaches the peak when the injection flow rate is 32 L/min. However, it can be seen from Figure 16 that the cooling rate of R angle is significantly faster than the web center when the injection flow rate is 32 L/min. The uneven of cooling speed can lead to residual thermal stress.
In addition, the temperature difference of H-beam after spray cooling is also one of the research emphases. Therefore, Figure 17 shows the temperature distribution along different directions in 80 s. Compared to Figure 2, the temperature difference along the two directions in Figure 17 declined markedly. Because the injection area is concentrated, the temperature of lateral flange is slightly higher than the web center. When the flow rate is used 16 L/min, the temperature along the web and flange is more even after cooling 80 s. The maximal temperature different between the flange and web has been declined from 242°C to 25.3°C. Moreover, the average temperature is 83.5°C, which requires the straightening temperature. From the above, the water injection flow rate is set to 16 L/min.
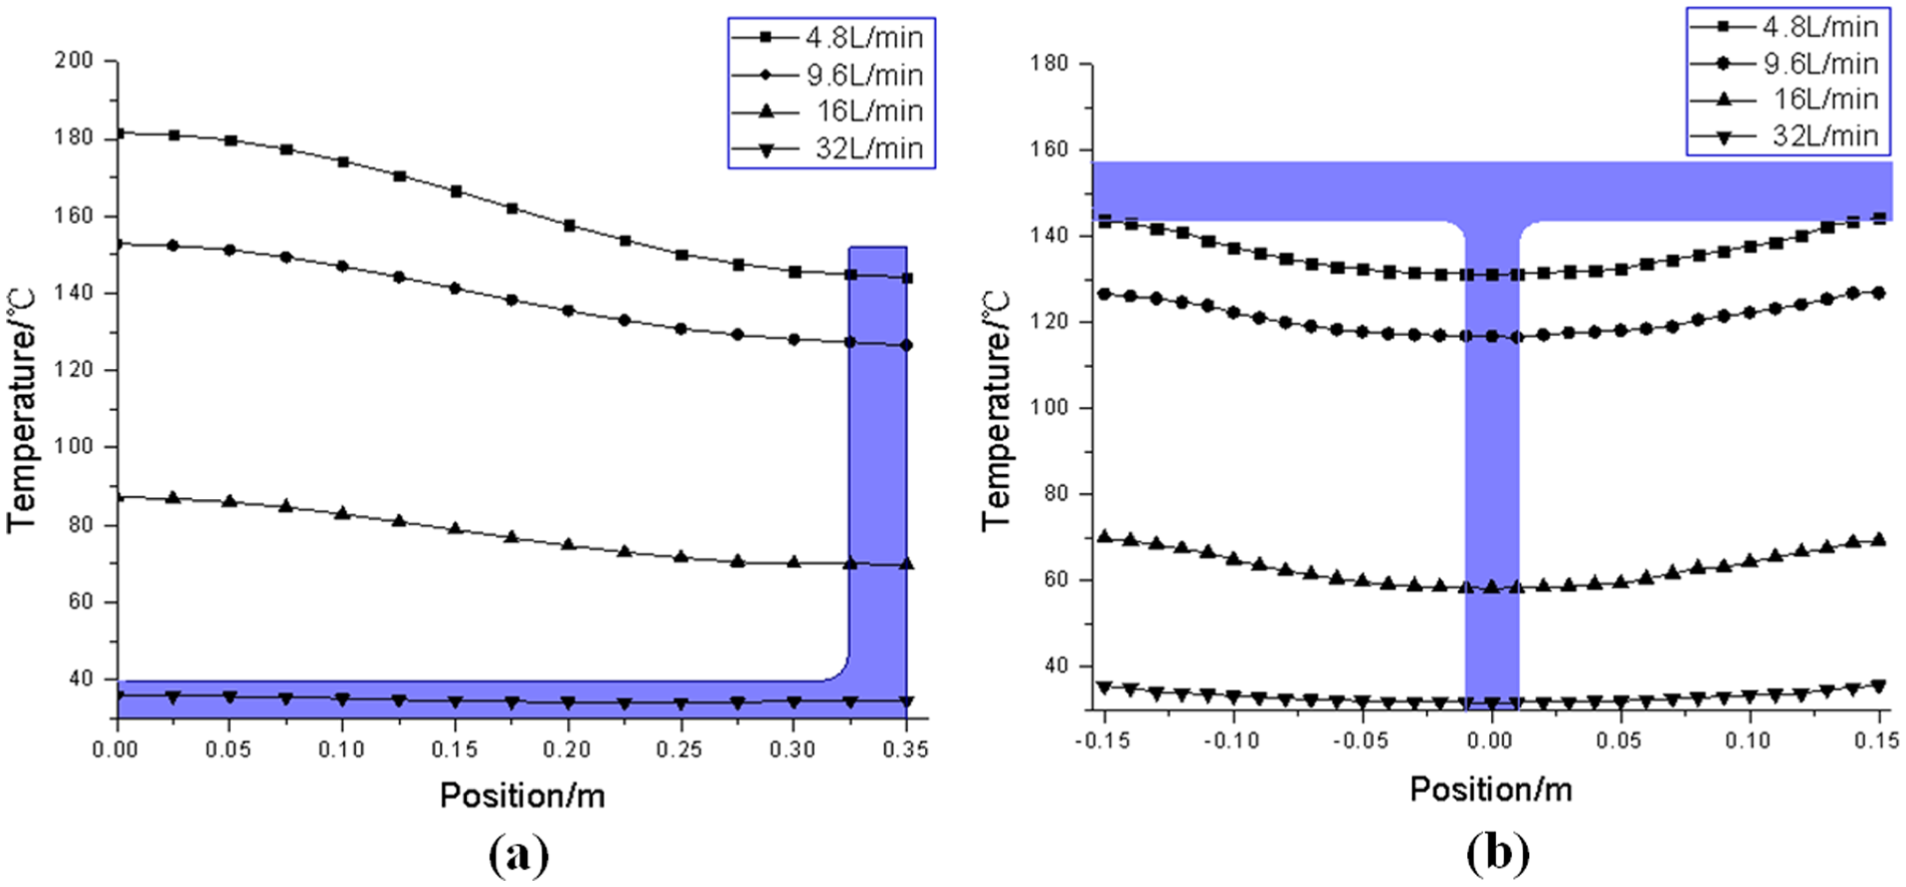
Temperature distribution along different directions: (a) along the web and (b) along the flange.
Simulation of multiple nozzle spray cooling process
Simulation analyses have been made of various factors influencing the spray cooling. Although the reasonable process parameters for cooling the cross section of H-beam are determined, some nozzles must be placed in the rolling direction of the H-beam to uniform the temperature distribution along the length direction. To determine the optimal size of the constant nozzle interval, the interval is increased by 100 mm from 200 to 400 mm in the length direction, as shown in Figure 18. In addition, the temperature fields under different nozzle intervals after cooling 80 s have been obtained in Figure 19.
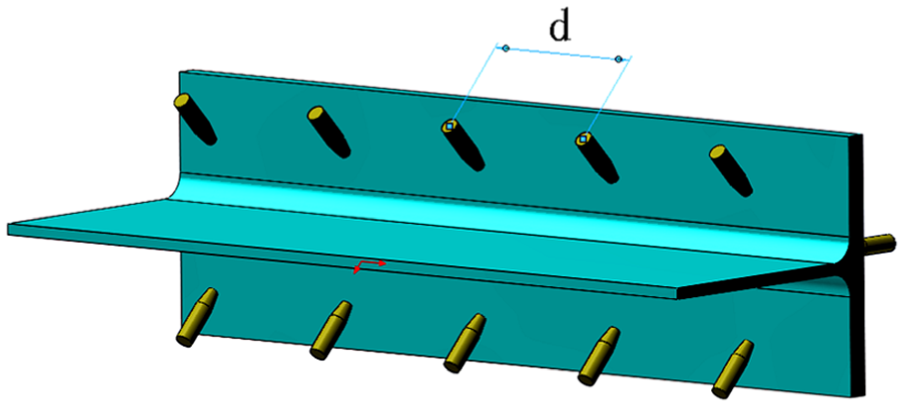
Layout diagram of different nozzle intervals.

Temperature field under different nozzle intervals: (a) d = 200 mm, (b) d = 300 mm, and (c) d = 400 mm.
In order to investigate the temperature fluctuation of the H-beam, the temperature curves in the web direction from the section of injection center are shown in Figure 20. The temperatures in the rolling direction and web direction decrease when the nozzle interval decreases from 400 to 200 mm. The average temperature of H-beam is 60.2°C, 80.8°C, and 96.3°C, respectively, when the nozzle interval is defined as 200, 300, and 400 mm, respectively. The temperature difference in the web direction is 6.7°C, 8.1°C, and 14.2°C, respectively. Moreover, the temperature difference in the rolling direction is 4.8°C, 5.2°C, and 6.5°C, respectively. These results show that the temperature distributions of the H-beam are relatively uniform because the temperature difference in the rolling direction is controlled within 8.1°C, and the temperature difference in the height direction is also controlled within 5.2°C when the nozzle interval in the rolling direction is defined 300 mm. Therefore, the recommended nozzle interval in the rolling direction is 300 mm because the temperature of H-beam has been reached straightening temperature rage after cooling 80 s. The temperature difference of web and flange decreases from 242°C to 8.1°C and from 77°C to 5.2°C, respectively.
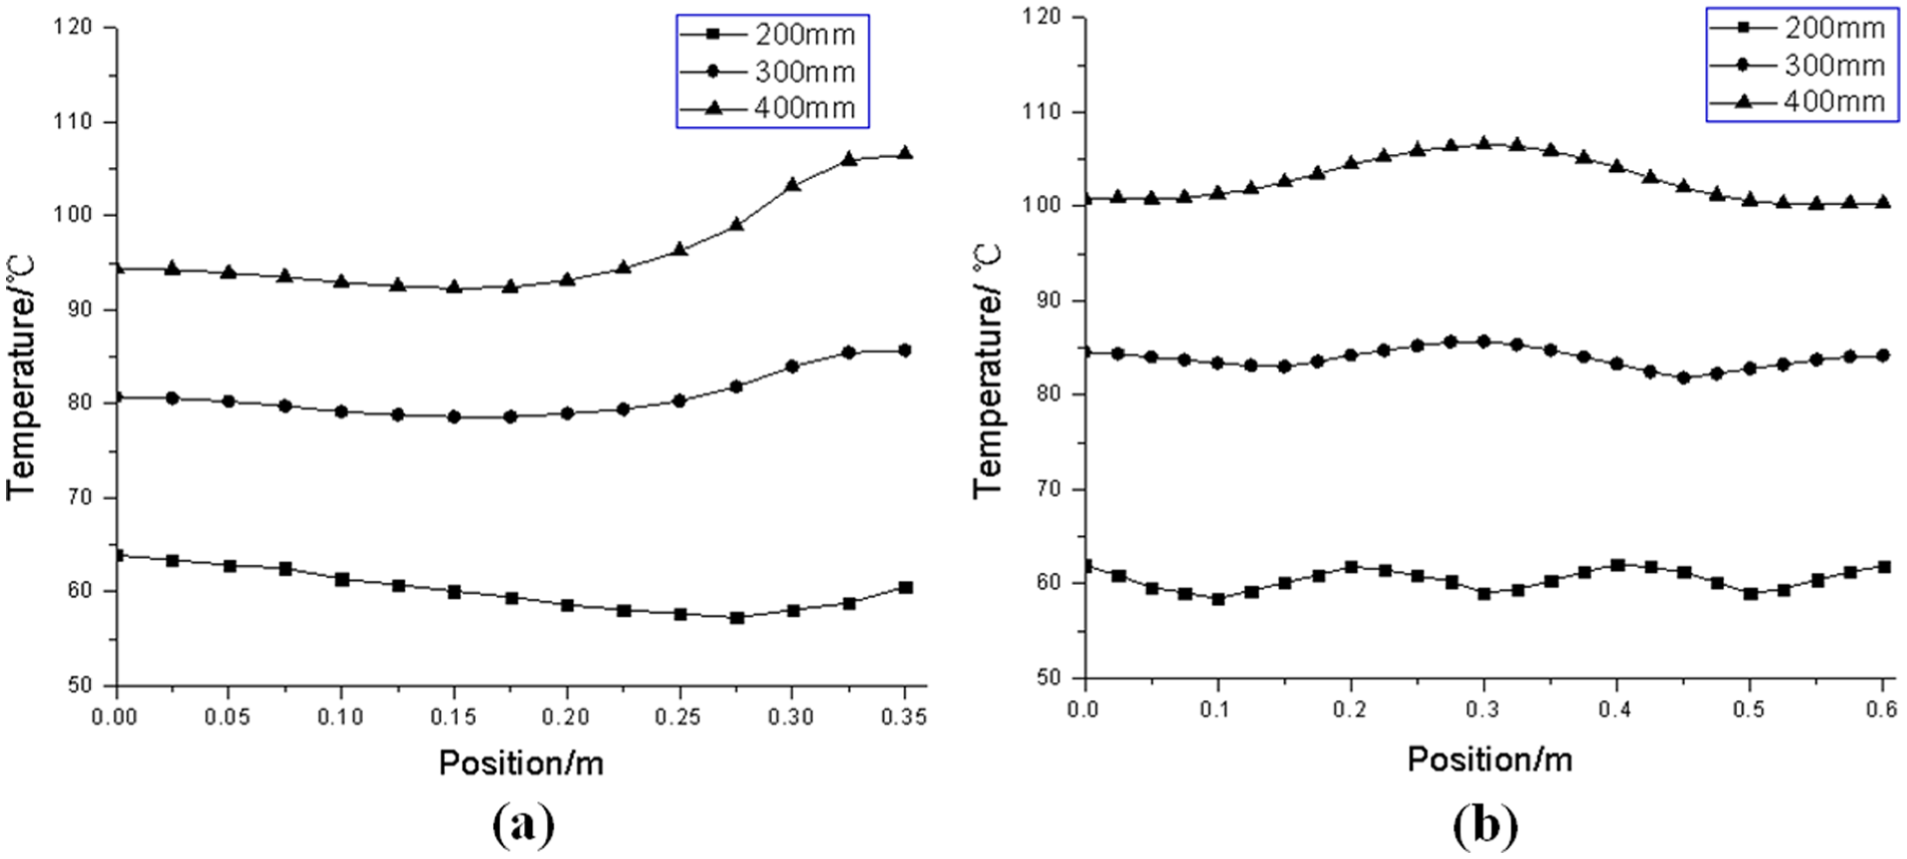
Temperature distributions along different directions: (a) along the web and (b) along the length.
Conclusion
A steel plate is heated to a temperature of 900°C and is cooled using spray cooling technology. This cooling process has also been simulated using the software Fluent. The RNG k–εmodel has been adopted in this study to simulate turbulence model with discrete phase method. The temperature fields of simulated are compared with those of the experiment. The results indicate that the simulation results agree relatively well with the measured data. Therefore, the relevant parameters of this simulation model can be adopted in the H-beam spray cooling model.
A three-dimensional H-beam spray cooling model has also been established and investigated. Reasonable nozzle layout parameters have been obtained. The angle between the nozzle center outside the R angle and the inner surface of the flange is defined as 45°, and the distance between them is defined as 140 mm. The working pressure of the nozzle, the mean droplet size, and the water flow rate are also suggested to use 0.25 MPa, 150 µm, and 16 L/min, respectively.
The recommended nozzle interval in the rolling direction is 300 mm to uniform the temperature distribution along the length direction. The temperature difference between the web and flange of the H-beam and the temperature difference in the height direction are decreased 234°C and 71.8°C, respectively.
Footnotes
Academic Editor: Takahiro Tsukahara
Declaration of conflicting interests
The author(s) declared no potential conflicts of interest with respect to the research, authorship, and/or publication of this article.
Funding
The author(s) disclosed receipt of the following financial support for the research, authorship, and/or publication of this article: The authors gratefully acknowledge the support of National High Technology Research and Development Program of China No. 2009AA03Z515.