
Abstract
In order to enhance the pertinency of suspension parameters optimization for a rail vehicle, this research intends to reveal the influence rule of suspension parameters on dynamic performance using sensitivity analysis method based on a virtual prototype response surface method model. Dynamic indexes in different combinations of suspension parameters are simulated using the virtual prototype, which is established using SIMPACK based on a multi-body dynamic model. And the response surface method models of dynamic indexes are constructed with the training samples, which are composed of the simulated dynamic indexes and the corresponding suspension parameters. The sensitivity analysis method is presented, taking a derivative with respect to the response surface method model. Then, the sensitivity analysis results of suspension parameters on dynamic performance of a rail vehicle are obtained in less computation time using the presented sensitivity analysis method. The results indicate that different suspension parameters affect different dynamic indexes of a rail vehicle, and there is a mutual coupling between the lateral stability, derailment coefficient, and wheel reduction rate.
Keywords
Introduction
Optimization of suspension parameters is an important method to improve the dynamic performance of a rail vehicle. In order to enhance the pertinency of suspension parameters optimization and obtain an optimum combination of suspension parameters, the sensitivity analysis method of suspension parameters on dynamic indexes is usually adopted as the major approach to reveal the influence rule.
Park et al. 1 obtained the main suspension parameters that affect the rail vehicle dynamic performance using sensitivity analysis method based on the neural network of suspension parameters for a high-speed rail vehicle. Wang 2 analyzed the influence of suspension parameters on dynamic performance using NUCARS software and obtained key influential suspension parameters based on orthogonal experiment method. Zhang et al. 3 analyzed the sensitivity of secondary suspension lateral damping, primary suspension longitudinal stiffness, and anti-hunting damping on motion stability for a rail vehicle, by calculating the derivative of the running state nonlinear function. In order to acquire the suspension parameters that influence the vertical stability of a rail vehicle, Yu et al. 4 analyzed the sensitivity of suspension parameters on vertical stability using a global sensitivity analysis method, named the extended Fourier amplitude sensitivity test. To obtain the accurate influence rule of suspension parameters on dynamic performance, Zhang and Dong 5 deduced the sensitivity analysis expressions of suspension parameters on dynamic indexes for a rail vehicle based on a theoretic multi-body dynamic model, which is described in a second-order linear differential equation. Yang et al. 6 established the sensitivity analysis model of suspension parameters on vertical acceleration and vertical Sperling index of a rail vehicle, using the vehicle random vibration frequency domain analysis method. Zhou et al. 7 assessed the sensitivity of suspension parameters on a rail vehicle dynamic performance, using tens of dynamic simulations in multi-body system. Suarez et al. 8 assessed the influence of the elastic properties of rail vehicle suspensions on the vehicle dynamic behavior, using 144 dynamic simulations in a rail vehicle dynamic model.
Most of these researches, though, have focused on the sensitivity analysis of suspension parameters for a rail vehicle before the suspension parameters optimization, acquired the influence rule of suspension parameters on dynamic performance, and obtained the key suspension parameters that are sensitive to the dynamic performance. It is effective to enhance the pertinency of the suspension parameters optimization. But all of these sensitivity analysis methods are developed using a theoretic dynamic model or a multi-body dynamic simulation model, which would cause computation complexity and low-resolution efficiency. It is not beneficial to improve the computation efficiency of the suspension parameters sensitivity analysis.
In view of the above-mentioned limiting conditions, this research established a virtual prototype of a rail vehicle to simulate the dynamic indexes in different combinations of suspension parameters and taking them as the training samples to construct a response surface method (RSM) model of dynamic indexes. Then, the sensitivity analysis method is designed, taking a derivative with respect to the RSM model. The concrete values of every suspension parameter on dynamic indexes could be calculated in this method. As the dynamic indexes in different combinations of suspension parameters are simulated using the RSM model, rather than a theoretic dynamic model or a multi-body dynamic simulation model, the calculating amount of sensitivity analysis is reduced significantly. It is effective to enhance the computation efficiency of the suspension parameters sensitivity analysis.
Modeling and simulation of a virtual prototype for a rail vehicle
Modeling of a virtual prototype
In order to reduce the computation complexity during the dynamic performance calculation, a simplified dynamic model of a rail vehicle, with yaw, shock, roll, and heaving motion freedoms, is constructed. And the suspension system of the dynamic model is composed of two parts: primary and secondary suspension systems. The concrete dynamic model is shown in Figure 1.

Multi-body dynamic model of a rail vehicle: (a) front view and (b) top view. 1—train body, 2—secondary suspension system, 3—frame, 4—primary suspension system, and 5—wheelsets.
The mass of the train body affects the vibration frequency of a rail vehicle, and the dynamic index will be changed with the variation of it, but this research mainly analyzes the sensitivity of suspension parameters on dynamic performance, and the suspension parameters are the design variables. Therefore, this research only considering the situation that the mass of the train body is a constant value (with passengers).
The main parameters and the concrete values of the multi-body dynamic model are confirmed based on a certain type of passenger train (CRH2) running in China railway, and the detailed values are shown in Table 1.
Main parameters and values of the dynamic model.

Then, the virtual prototype of a rail vehicle was constructed using SIMPACK based on the multi-body dynamic model as shown in Figure 1, and the three-dimensional (3D) model of the virtual prototype was established as shown in Figure 2.

3D model of the virtual prototype for a rail vehicle.
Simulation of dynamic performance based on the virtual prototype
Selection of suspension parameters and dynamic indexes
Suspension parameters
In order to analyze the sensitivity of suspension parameters on different dynamic indexes, all the suspension parameters of the primary and secondary suspension system of a rail vehicle are selected as the design variables: lateral stiffness of primary suspension x1, longitudinal stiffness of primary suspension x2, vertical stiffness of primary suspension x3, vertical damping of primary suspension x4, lateral stiffness of secondary suspension x5, longitudinal stiffness of secondary suspension x6, vertical stiffness of secondary suspension x7, lateral damping of secondary suspension x8, vertical damping of secondary suspension x9, and anti-hunting damping x10. Hence, the design variables space X of the virtual prototype is (x1, x2, x3, x4, x5, x6, x7, x8, x9, and x10).
Dynamic indexes
Sperling riding quality index and motion stability index are the mainly evaluating indicators of a rail vehicle based on GB/T 5599-1985. 9 The vertical Sperling index y1, lateral Sperling index y2, derailment coefficient y3, and wheel load reduction rate y4 were selected as the dynamic indexes, and the concrete calculation formulas are shown in equations (1)–(4), respectively


where a1 (cm s−2) and a2 (cm s−2) are the vertical and lateral vibration accelerations of the train body, respectively; f1 (Hz) and f2 (Hz) are the vertical and lateral vibration frequencies of the train body; F(f) is the modifying coefficient of vibration frequency; αi (°) is the corresponding angle of wheel flange; and µ1 is the friction coefficient of wheel flange and rail side. Therefore, the response variables space Y of the virtual prototype is (y1, y2, y3, and y4).
Simulation of dynamic performance
The dynamic indexes y1, y2, y3, and y4 under different combinations of suspension parameters were calculated using the simulation process of dynamic performance as shown in Figure 3.

Simulation process of dynamic performance based on the virtual prototype for a rail vehicle.
To calculate the values of the dynamic indexes in different combinations of suspension parameters, the parsing and replacement tool was used to modify the corresponding suspension parameters in system file (.sys) of a virtual prototype in SIMPACK.
The virtual prototype RSM model
Basic form of a RSM model
Quadratic polynomial response surface model is a kind of surrogate model that is widely used in engineering optimization. It has the advantages of smaller computation amount, simple data structure, and high computation efficiency. 10 In order to improve the computation efficiency of suspension parameters optimization, quadratic polynomial response surface function is selected as the tool to construct the dynamic indexes surrogate model, considering the large number of suspension parameters of a rail vehicle.
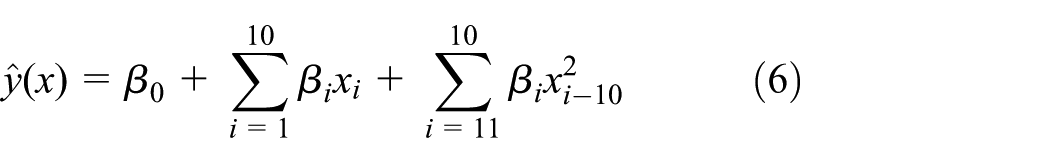
The basic form of a RSM model is shown in equation (5)

Assuming
where the coefficient could be calculated in least square method as shown in equation (7)

Construction of the virtual prototype RSM model
In the modeling of the virtual prototype RSM model for a rail vehicle, the quadratic polynomial without cross-product term is used to fitting vertical Sperling index y1, lateral Sperling index y2, derailment coefficient y3, and wheel load reduction rate y4. The concrete construction is shown in Figure 4.

Construction of the virtual prototype RSM model.
Design of experiment
To obtain the training sample of the virtual prototype RSM model, the optimal Latin hypercube experiment design method 11 was used to sample all the suspension parameters as shown in Table 1. In order to acquire a large enough sample to cover all the suspension parameter values that might be used in actually design, upper and lower limits are determined for a 50% fluctuation above and below the current value of every suspension parameter as shown in Table 1.
To guarantee the fitting accuracy of the virtual prototype model, the minimum number of training sample points is N = (n + 1)(n + 2)/2, where n is the number of design variables. 12 As the number of design variables for the RSM model is 10, and also considering the fitting accuracy and computation amount, the number of sample points N was set to 70.
Therefore, 70 groups of suspension parameter combinations were determined using the optimal Latin hypercube experiment design method in the suspension parameter value ranges, and the corresponding response values of dynamic indexes were simulated using the dynamic simulation approach illustrated in Figure 3. Then, the training sample, shown in Table 2, was obtained, combining 70 groups of suspension parameters with the corresponding response dynamic indexes.
Training sample of the virtual prototype RSM model.

RSM: response surface method.
Virtual prototype RSM surrogate model
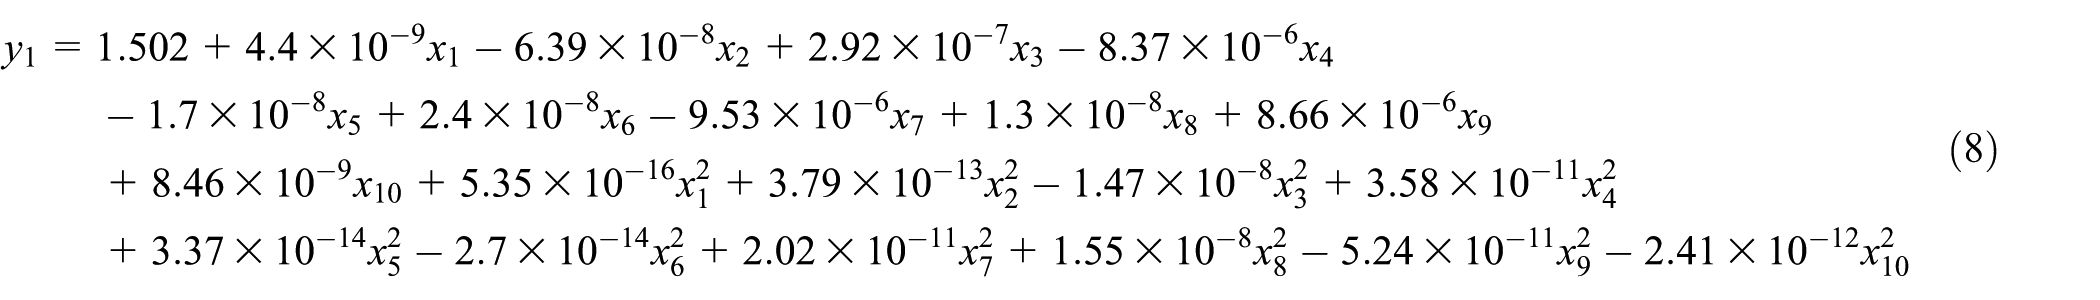
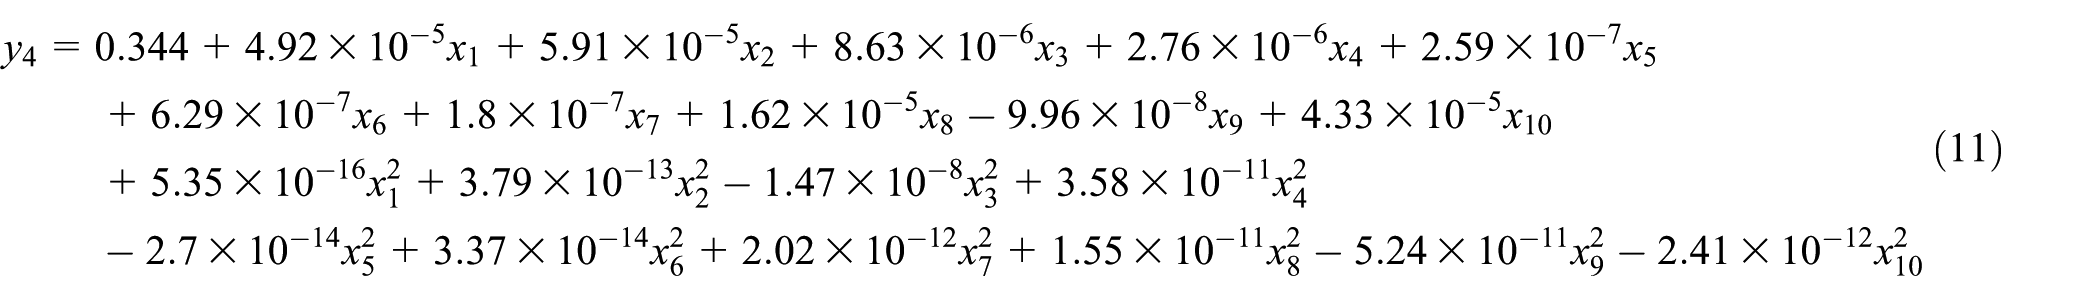
The dynamic indexes of RSM models are established using the construction of the virtual prototype RSM model shown in Figure 4. And the concrete RSM model of vertical stability, lateral stability, derailment coefficient, and wheel load reduction rate is shown in equations (8)–(11), respectively.
RSM model of vertical stability
RSM model of lateral stability

RSM model of derailment coefficient

RSM model of wheel load reduction rate
Fitting accuracy test
To test the fitting accuracy of the RSM models, the multiple correlation coefficient 13 R2 as shown in equation (12) was adopted as the evaluation index to test the fitting error of the RSM models
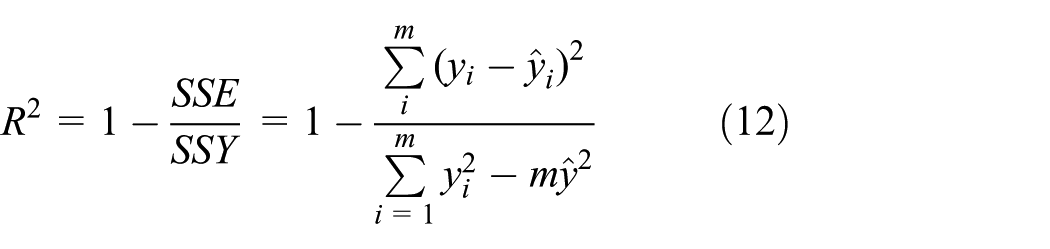
where SSE is the sum of square of the difference between response value and estimated value, SSY is the sum of square of the difference between response value and average value, m is the number of sample points, yi is the simulating value of virtual prototype, and
In total, 10 groups of dynamic indexes values were randomly selected in Table 3 and were taken as the comparison samples for the fitting accuracy test. The corresponding 10 groups of suspension parameters were substituted into the RSM models of dynamic indexes. The values of R2 were 0.8601, 0.9177, 0.8882, and 0.8576, respectively, all of them up to 0.85. This indicates that all the established RSM models could be used to fitting the corresponding dynamic indexes simulation of a rail vehicle.
Sensitivity analysis results of suspension parameters on dynamic indexes.

Sensitivity analysis of suspension parameters on dynamic performance based on the virtual prototype RSM model
Sensitivity analysis method
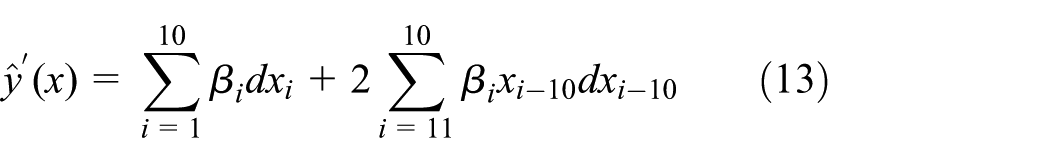
As direct derivation method could meet the precious requirement of high-order sensitivity analysis in engineering area, 14 this work took it as the sensitivity analysis method to analyze the suspension parameter sensitivity. Taking a derivative with respect to the RSM model of a rail vehicle as shown in equation (6), the derivation result is shown in equation (13)
The sensitivity percentage of corresponding suspension parameter is calculated using equation (13) based on

where
Sensitivity analysis results
Sensitivity percentages
The sensitivity percentage values of suspension parameters on corresponding dynamic indexes were calculated by the derivation method as shown in equation (13) based on the dynamic index RSM model as shown in equations (8)–(11). And the sensitivity percentage of corresponding suspension parameters is calculated using equation (14), and the specific results are shown in Figure 5.

Sensitivity percentages of suspension parameters on dynamic indexes: (a) vertical stability index (y1), (b) lateral stability index (y2), (c) derailment coefficient (y3), and (d) wheel load reduction rate (y4).
The concrete values of the sensitivity analysis results of suspension parameters on the corresponding dynamic indexes are illustrated in Table 3.
The following results could be obtained using statistical analysis method according to Table 3:
Ksz, Csz, Cpz, and Kpz are the four most important suspension parameters that influence the vertical stability index (y1), and the sensitivity percentage sum of these four suspension parameters is 91.706%.
Ksy, Csy, Kpy, and Ksx are the four important suspension parameters that influence the lateral stability index (y2), and the sensitivity percentage sum of these four suspension parameters is 87.23%.
Css, Kpx, and Kpy are the three important suspension parameters that influence the derailment coefficient (y3), and the sensitivity percentage sum of these three suspension parameters is 75.554%.
Kpx, Kpy, and Css are the three important suspension parameters that influence the wheel load reduction rate (y4), and the sensitivity percentage sum of these three suspension parameters is 61.207%.
According to the above analysis results, the lateral stiffness of primary suspension Kpy affects the lateral stability y2, derailment coefficient y3, and wheel reduction rate y4 at the same time, which causes design variables coupling during the optimization of the suspension parameters for a rail vehicle. It means that a multi-object optimization method should be used during the optimization of the suspension parameters.
Computational efficiency of the presented method
In order to demonstrate the computation efficiency of the presented method, the dynamic simulation model in SIMPACK and RSM model are adopted to obtain the dynamic indexes in different combinations of suspension parameters, correspondingly, and the sensitivity results of suspension parameters on dynamic performance are obtained using the orthogonal test analysis method and the direct derivation method, respectively. The corresponding computation times of the two methods are 350.2 and 176.3 s, which indicate that the computation efficiency is improved by 49.66% using the presented method.
Conclusion
This research demonstrates a sensitivity analysis method of suspension parameters on dynamic performance of a rail vehicle, using a virtual prototype RSM model. And the concrete sensitivity analysis results were obtained using the presented method. The detailed results are as follows:
A virtual prototype of a rail vehicle was constructed to simulate the dynamic performance indexes of the vertical stability, lateral stability, derailment coefficient, and wheel load reduction rate in different combinations of suspension parameters.
The training sample of an RSM model is obtained using optimal Latin hypercube experiment design method. And the virtual prototype RSM model of a rail vehicle was established, and this provides a more efficient model for the sensitivity analysis of suspension parameters on dynamic indexes.
A sensitivity analysis method of suspension parameters on dynamic indexes was presented using direct derivation method based on the established virtual prototype RSM model. And the concrete sensitivity analysis results were obtained using this method.
From the sensitivity analysis results, the lateral stiffness of primary suspension affects the lateral stability, derailment coefficient, and wheel reduction rate simultaneously. It means that a multi-object optimization method should be used during the optimization of the suspension parameters for a rail vehicle.
Footnotes
Appendix 1
Academic Editor: Mario L Ferrari
Declaration of conflicting interests
The author(s) declared no potential conflicts of interest with respect to the research, authorship, and/or publication of this article.
Funding
The author(s) disclosed receipt of the following financial support for the research, authorship, and/or publication of this article: The authors gratefully acknowledge the support from the scientific research projects of Shanxi province education department in China (Grant no. 16JK2242) and the scientific research projects of Xijing University (XJ130238 and XJ130248).