
Abstract
Structural elements, such as stiffened panels and lap joints, are basic components of aircraft structures. For aircraft structural design, designers select predesigned elements satisfying the design load requirement based on their load-carrying capabilities. Therefore, estimation of safety envelope of structural elements for load tolerances would be a good investment for design purpose. In this article, a method of estimating safety envelope is presented using probabilistic classification, which can estimate a specific level of failure probability under both aleatory and epistemic uncertainties. An important contribution of this article is that the calculation uncertainty is reflected in building a safety envelope using Gaussian process, and the effect of element test data on reducing the calculation uncertainty is incorporated by updating the Gaussian process model with the element test data. It is shown that even one element test can significantly reduce the calculation uncertainty due to lacking knowledge of actual physics, so that conservativeness in a safety envelope is significantly reduced. The proposed approach was demonstrated with a cantilever beam example, which represents a structural element. The example shows that calculation uncertainty provides about 93% conservativeness against the uncertainty due to a few element tests. It is shown that even a single element test can increase the load tolerance modeled with the safety envelope by 20%.
Introduction
The conventional structural design strategy is to find the best geometric configuration, such as cross-sections, panel thickness, or dimensions, to satisfy safety requirements under known applied loads. In practical engineering, however, it is seldom to design completely new systems. Rather, the existing design is often updated with enhanced performance. In passenger cars, for example, it takes about every 3 years that manufacturers modify a previous car model, but it takes more than 10 years to introduce a car model with a completely new concept. In such an environment, it can be too expensive to design structural components every time when the model is slightly modified/updated. In addition, for the purpose of managing the number of structural parts, it would be best to reuse the same part for different systems.
In order to use the same part for different systems, it is necessary to provide the capability of how much load the part can support safely. Traditional design concerns load capacity by introducing a safety factor, which provides a safety margin under design loads. Kwak and Kim 1 proposed a concept of allowable load sets, where design loads are used without considering uncertainties. In linear static structures, the allowable load set becomes piecewise-linear and convex. Wang et al. 2 extended this concept to the fatigue life estimation under uncertainty in the applied dynamic loads using the stochastic response surface technique and sensitivity information. However, they used the first-order reliability method, which can lose its accuracy for nonlinear response and correlated non-normal random variables.
In the space of applied loads, the safety envelope is defined as a boundary of the region where the structural element is safe. The structural element is considered failed when the applied load is out of the envelope. Figure 1 shows an example of safety envelope with two independent loads, where the safety envelope becomes a curve. Once this safety envelope is available, designers can easily decide whether the current element can be used for a new loading condition for a model. Otherwise, a new element has to be designed to support the applied loads.
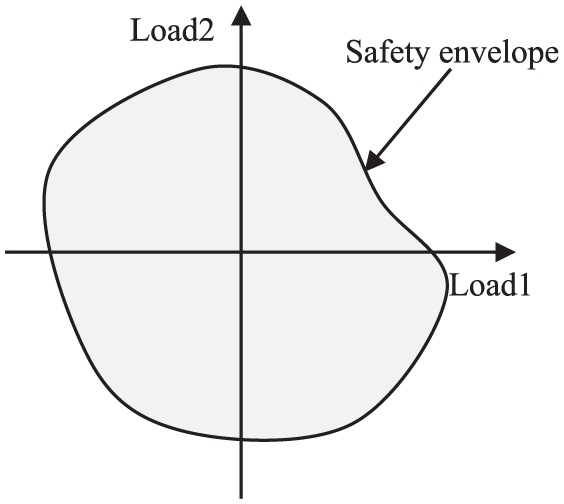
Safety envelope with two loads.
In the conventional design concept, 1 most structural elements are designed with a safety factor under design loads. This safety factor is applied in order to compensate for various sources of uncertainty, such as variable material properties, geometric tolerances, and calculation errors. Since the conventional design concept calculates the design load by multiplying a safety factor to the maximum applied loads, the safety envelope includes the safety factor. However, since the safety factor is applied to the load, the actual elements can be over- or under-designed depending on the level of uncertainty for the specific element.
In the reliability-based design perspective, 2 instead of applying a safety factor, it makes more sense to build the safety envelope with a specific threshold of failure probability under uncertainty. However, this requires to calculate the probability of failure (PF) in multi-dimensional space of applied loads. Wang et al. 2 showed two-dimensional (2D) safety envelope for fatigue reliability. In the case of 2D domain, the safety envelope becomes a curve, and the Euler–Newton continuation method was used to search the continuous boundary. However, this method is limited for one-dimensional (1D) or 2D space of applied loads. In addition, it does not consider epistemic uncertainties, such as sampling uncertainty in input variability and calculation uncertainty. The importance of treating epistemic uncertainty is discussed by the literature regarding probabilistic design. MIL-HDBK 3 discusses sampling uncertainty due to a finite number of samples and suggests design tolerances such as A- or B-basis allowables. Noh et al. 4 emphasized handling sampling uncertainty due to a finite number of samples. Villanueva et al. 5 focuses on quantifying the effect of redesign considering the effects of future test for reducing uncertainty in design. Acar et al. 6 discusses the effects of sampling uncertainties in material property and the prediction uncertainty due to lacking knowledge about physics regarding to aircraft structure failure.
In high dimensions, a new method is required to effectively identify the boundary of safety envelope. In this article, the concept of probabilistic classification7–9 is utilized to estimate the failure envelope of a structural element. Since the proposed method is sampling based, it can be applicable to nonlinear responses as well as correlated non-normal random variables. Therefore, the proposed method is more general than the previous method of estimating failure envelope. The second important contribution of this article is to incorporate the effect of tests on reducing uncertainty in failure envelope prediction. In the traditional building-block process, tests are performed at different stages to reduce errors in calculation (epistemic uncertainty). Park et al. 10 discusses theoretical concept of accounting epistemic uncertainties in structural element design and the effects of coupon and element tests on reducing uncertainties in element strength prediction and thus design weight. In this article, we utilize statistical tolerancing and Bayesian inference to reduce this uncertainty. The proposed approach is demonstrated with a cantilever beam example, which shows reasonable conservativeness against the test uncertainties.
This article is organized as follows. Section “Building a failure envelope using probabilistic classification” introduces probabilistic classification to find the boundary of safety envelope with a specific level of PF. Section “Calculation of structural element safety envelope based on coupon and element tests” illustrates how to calculate the contribution of coupon and element tests on uncertainty reduction. Section “Cantilever beam example” uses a cantilever beam example to illustrate the proposed failure envelope with tests, followed by conclusion in section “Concluding remarks.”
Building a failure envelope using probabilistic classification
There are different ways of building the safety envelope. For example, Wang et al. 2 used an iterative method to search the surface of the safety envelope. In this article, we use sampling-based method with probabilistic classification to find it. In his process, we fit a surrogate for the PF and find the boundary of safety envelope using a target level of PF.
The dimension of a safety envelope is determined by the number of load components. For example, a safety envelope for a single load is a load tolerance value, while that for three loads is a surface. In order to explain how to obtain the load tolerance corresponding to PF of 10% for a bar under an axial load, it is assumed that the failure strength S of the bar follows a normal distribution N(220, 112) MPa, while the applied load F is uniformly distributed U(190, 250) kN. Stress of the bar with the cross-sectional area A = 0.001 m2 is calculated as σ = F/A. By defining the limit state as G = S − σ, the bar is considered failed when G < 0, while safe when G > 0. However, due to randomness in failure strength and applied load, the limit state is also random, which can be realized by generating samples according to the random distribution. Therefore, for a given load, failure is defined with a probability, which is a PF, and the PF is a function of load magnitude. By obtaining the PF function, we can conveniently calculate a load tolerance for a target PF.
Figure 2 shows failed (red crossed symbols) and safe (blue circled symbols) samples randomly generated according to the above-mentioned distributions of load and strength. Figure 2 also shows a fitted PF function based on the samples. Safe samples are dominant for a low-load level and failed samples are dominant for a high-load level such that PF increases as the load level increases. In such a case, PF of 10% (horizontal dashed line) can be calculated using the PF function. The load tolerance for PF of 10% is at F = 208 kN. The interpretation of a point safety envelope is that at this level of load, PF is 10% under given uncertainty in failure strength. The same concept can be extended to multiple loads.

A probability of failure function based on limit-state samples of a bar under an axial load.
This article uses a probabilistic classification method to build a safety envelope, which is a PF function for given applied loads, based on failed and safe samples. There are largely two types of classification, deterministic and probabilistic classifications. Figure 3 shows a schematic illustration of deterministic and probabilistic classifications. When the region of blue class and the region of red class are exclusive, deterministic classification is used to identify the boundary between two exclusive regions as shown in Figure 3(a). Probabilistic classification was initially developed to predict the class probabilities. Figure 3(b) shows a probabilistic classification example based on weight and height statistics of people; the taller and heavier a person, the higher probability being a male. However, it is possible that a man and woman can have the same height. Thus, when the weight and height of a person are given, the sex of the person is described as probability. Probabilistic classification can provide the region of weight and height that the person is classified as a male with any given probability. In the same sense, as in the previous example, we can predict whether a bar is failed or not based on the PF curve that is fitted using samples.

Classification types: (a) deterministic classification and (b) probabilistic classification.
Classification can be either the discriminative approach or the generative approach. 11 The discriminative approach directly models the classification probability, whereas the generative approach focuses on the class-conditional densities and uses them to obtain classification probability. 8 In this article, the discriminative approach is used. This is because the generative approach requires to make a good estimates of the class-conditional densities to obtain the classification probability function. In addition, data from a high density region of each class may not necessarily help in defining the classification function.
A classification probability surrogate is built using the logistic response function
Gaussian process (GP) is used to model the latent function using input load vector

In the case of a uniaxial bar example, Figure 4(a) and (b) shows the latent function and the PF surrogate, respectively.

A probability function and the corresponding latent function: (a) latent function and (b) probability function.
Fitting a PF surrogate with the logistic regression boils down to how to fit the latent function using samples. The latent function predicts a high probability for a class in the corresponding class dominant region. In this article, we used a GP model for fitting latent functions. Detailed process of fitting a GP latent functions for given classified samples can be found in Rasmussen and Williams. 9
Calculation of structural element safety envelope based on coupon and element tests
The accuracy of a safety envelope depends on the accuracy of failed/safe sample calculation. For the previous bar example, if we have an error in the failure strength distribution, the load tolerance value may include error.
For aircraft structures, the building-block test process is applied to detect design errors and to reduce uncertainties in design and manufacturing. 3 At each level, analytical/numerical models are calibrated to account for discrepancies between model prediction and test results. Structural elements are designed based on coupon and element tests. Coupon tests are used to build the material strength distribution, and element tests validate failure predictions. Since dozens of coupons and a few element tests are often used, the estimated strength distribution has sampling error, and failure predictions have calculation errors. For example, if the failure criterion of the bar example tends to underestimate failure, then an overestimated safety envelope would be obtained. Therefore, uncertainty after tests has to be incorporated into building a safety envelope of a structural element with proper uncertainty models.6,10 The following sections present uncertainty modeling for considering the effects of coupon and element tests.
Modeling population distribution using coupon tests
The strength of a material has inherent variability, which shows a statistical distribution. Coupon tests are carried out to estimate the distribution. With coupon tests, the distribution type has to be identified and the parameters of the distribution should be estimated. The distribution of coupon tests needs to consider uncertainties in estimating parameters from finite samples. For simplification, we assume that designer identifies the distribution type of coupon tests correctly and estimates the parameters. The process of obtaining a predictive distribution that includes both the original and sampling uncertainty is presented.
We assume that the true material strength follows the following normal distribution

where
Since we assume that we identify the distribution type correctly, to obtain a predictive distribution, we need to know uncertainties in a sample mean and standard deviation. With nc coupons, the sampling uncertainties of the mean and standard deviation can be estimated 12 as

where
The predictive distribution of coupon strength can be obtained using double-loop Monte Carlo Sampling (MCS) as shown in Figure 5. The following four-step process is used: (1) calculate a sample mean and standard deviation using nc coupons, (2) generate N random sample statistics pairs from the sampling uncertainty distributions using equations (3) and (4), (3) generate random M material strength samples from each material strength distribution of a mean and standard deviation pair, and (4) obtain a predictive material strength distribution from the collection of the M × N material strength samples.

Process of obtaining a predictive material strength distribution using double-loop MCS.
Reducing calculation error using element tests
Using the predictive distribution of failure strength in the previous section, structural elements are designed and tested. Structural element designs involve failure predictions such as stress calculation. We assume that the error in failure prediction comes from stress calculations, which is considered as uncertainty to avoid error in calculating safety envelope. When the calculated stress includes error, the true stress can be expressed as

where

where
The epistemic uncertainty caused by the calculation error can be reduced by building and testing the structural element. In aerospace structures, it is customary to test about three to five elements to reduce the calculation error and calculate a conservative element strength. Park et al.
10
showed how to reduce the epistemic uncertainty using element tests that include test variability. Detailed process of Bayesian inference and the GP regression model is explained in the numerical example in section “Cantilever beam example.” In this article, for simplicity, it is assumed that the element tests do not include measurement error, that is,
where
Cantilever beam example
In this section, we will show how to build a safety envelope for 10% PF of a cantilever beam designed with coupon and element tests. The cantilever beam dimensions and applied loads are shown in Figure 6(a). It has a circular section with the radius of 0.1 m and length of 2 m. The objective is to find the safety envelope, which is a curve in 2D, when the two applied loads, Fy and Fz, are in the range of [1000, 2000] N. A schematic figure of the estimated safety envelope is presented in Figure 6(b). Two sources of uncertainty are considered: the variability in the failure strength and error in stress calculation. It is assumed that the material strength distribution is obtained from simulated 50 coupons, and the stress calculation error is reduced by a single-element test.

Structural element and a schematic failure envelope on the region: (a) a cantilever beam with two applied loads and (b) a schematic figure of the failure envelope.
Simulated test results are generated using an assumed true material strength distribution for coupon tests and an assumed true stress function for element tests. As introduced in the previous section, the use of a finite number of tests brings in additional uncertainty. Element designs must consider the uncertainty to properly estimate PF, and thus the safety envelope. In the following sections, we will first show how to build a safety envelope using the proposed approach with a single set of randomly generated tests. Since test results can vary, the process is then repeated to demonstrate the statistical performance of the proposed approach. Since tests are generated from the assumed true distribution, the true safety envelope can be used to evaluate the conservativeness of the proposed approach.
Building a safety envelope with a single set of coupon and element tests
Coupon tests
Coupon tests should be carried out in advance to building a safety envelope since the material strength distribution is required. The following true material strength distribution is assumed to draw coupon samples

Randomly generated 50 coupon samples have the mean and standard deviation of 5227 and 151 kPa, respectively. Since sampling uncertainty exists in the sample mean and standard deviation, a predictive strength distribution is generated by following the process described in Figure 5. Samples of the predictive distribution were generated using randomly generated means and standard deviations and double-loop MCS. Samples of mean were generated using equation (3) with N(5227, 21.42), while samples of standard deviation were generated using equation (4) with
Building a safety envelope using the predictive distribution
As shown in the bar example, in probabilistic classification, it is required to collect limit-state samples over the range of applied loads in order to build the safety envelope. In this example, we use the maximum stress for failure criterion, where the beam fails when maximum principal stress is greater than the failure strength. Because the failure strength has uncertainty, the true limit state of the element for given applied loads Fy and Fz is expressed as a random variable as

In equation (9), the true failure strength is estimated using the predictive distribution,

Using the predictive distribution of failure strength and calculated stress, the limit-state random variable is finally expressed as

where the calculation error is denoted by
Typically, the uncertainty in calculation error can be estimated from expert opinions or past design experience. We assume that the initial estimate of calculation error is modeled as a normal distribution with zero mean and standard deviation of 0.1 as

The true error is calculated by comparing the true stress and the corresponding calculated stress. We assume that the maximum stress is calculated using the Euler–Bernoulli beam theory, where the calculated maximum principal stress is obtained as

where I is the second moment of inertia and
A safety envelope with the initial error bounds is built using the probabilistic classification and limit-state samples. The limit-state samples are randomly generated in three steps: (1) generating 2000 applied load samples of Fy and Fz using a uniform distribution U(1000, 2000), (2) generating 2000 samples of failure strength from the predictive distribution and the initial error distribution, and (3) calculating the corresponding limit-state samples using equation (11). Figure 7 shows 2000 limit-state samples and the corresponding safety envelope. Note that samples can be obtained in various ways. If a numerical model to predict failure of an element is computationally cheap, the model can be directly used to acquire samples. A surrogate can be alternatively used as a cheap representative model of an expensive numerical model. The classification is utilized to conveniently build a safety envelope using samples. If there is no uncertainty in material properties and calculation error, the beam can support up to 2000 N forces when only Fy is applied. Due to uncertainty, however, the beam has a 10% PF when the load is 1500 N. Note that this safety envelope is before incorporating element tests. Because of sampling error, the envelope shows variability. For example, along the line of Fy = Fz, the envelope shows about 3% of coefficient of variation; all other directions show a similar level of variability.

A failure envelope obtained based on limit-state samples: (a) limit-state samples and (b) safety envelope for PF = 0.1.
Element tests and the calculation error update
The unknown calculation error was compensated by including the error distribution in the limit-state function but it is often overly conservative. If the distribution is narrowed by reducing the uncertainty, the safety envelope increases and leads to a lighter design. In this section, we present an approach to reduce the initial calculation uncertainty by incorporating element tests into Bayesian statistics.
For the cantilever beam, the calculation uncertainty can be reduced by measuring the maximum stress from element tests. An element test of the beam measures the maximum stress by gradually increasing the load magnitudes of Fy and Fz with a fixed load ratio. Figure 8 shows seven maximum stress measurements along Fy = Fz line until the beam fails. With no measurement error, we can measure the true maximum stresses
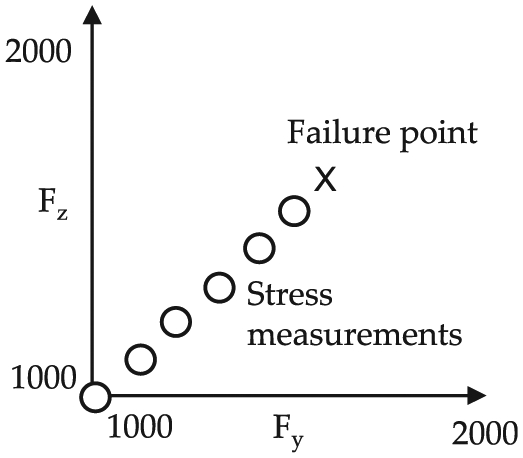
Load path of an element test.
For a single-element test, with
In this article, we propose an approach to extrapolate the true calculation error data from an element test to other unmeasured points using Bayesian inference and a Gaussian process (GP) regression model. The initial distribution of calculation error in equation (12) is used to build a prior GP model, which will be updated with the true errors. The prior GP model is defined using equation (12) as

The GP model requires a correlation model and the popular Gaussian kernel is used herein. The covariance function of the GP model is defined as

Roughness parameters λy and λz are estimated using the errors measured from element tests using a likelihood function. The likelihood function is derived as

where
The posterior distribution of calculation error

The mean and variance of the updated distribution represent the prediction and the amount of remaining uncertainty after the test, respectively. The mean and variance are obtained as a function of applied loads as

where
The above equations are derived based on the GP regression model. More detailed information about estimating roughness parameters and updating a prior model of a GP model can be found in Rasmussen and Williams. 9
For the purpose of illustration, the true stress function is defined using calculated stress in equation (15) and the error function

The true error function is assumed as

where

Stress functions: (a) true stress and (b) calculated stress.
Using the true failure strength distribution and the true stress function, a single-element test was simulated by increasing the loads along Fy = Fz and collected seven maximum stresses as illustrated in Figure 8. The failure point {Fy, Fz} = {1489, 1489} is determined by randomly generating the limit-state function in equation (9). The seven maximum stresses are evenly distributed between {Fy, Fz} = {1000, 1000} and the failure point.
Based on the synthetic element test data, the true error function and the corresponding 1-sigma representing the prediction uncertainty were predicted. The updated GP model

Estimated error function and the corresponding uncertainty: (a) predicted error and (b) uncertainty in the predicted error.
Since a single-element test reveals the true error on a single load path, other load combinations still have calculation uncertainty. The uncertainties around the measured points are almost zero and it increases as distance between a stress calculation point and the load path increases. It is observed that the uncertainty in the predicted error is significantly reduced compared to the initial error of its standard deviation of 0.1.
With the updated GP model, the safety envelope is re-calculated using the following updated limit state

Figure 11 shows the safety envelope using the GP model in equation (22). It shows that the safety envelope covers a larger region than the safety envelope without element tests in Figure 7. That is, incorporating an element test can significantly reduce the calculation uncertainty. The reason of the asymmetric failure envelope is that the predicted error function in Figure 10(a) is asymmetric.

A safety envelope obtained using the updated error function: (a) limit-state samples and (b) safety envelope for PF = 0.1.
Figure 12(a) and (b) shows a comparison between the true PF function along Fy = Fz line and the corresponding PF function extracted from the probabilistic classification shown in Figures 7(b) and 11(b), respectively. The horizontal axis is the magnitude of the load
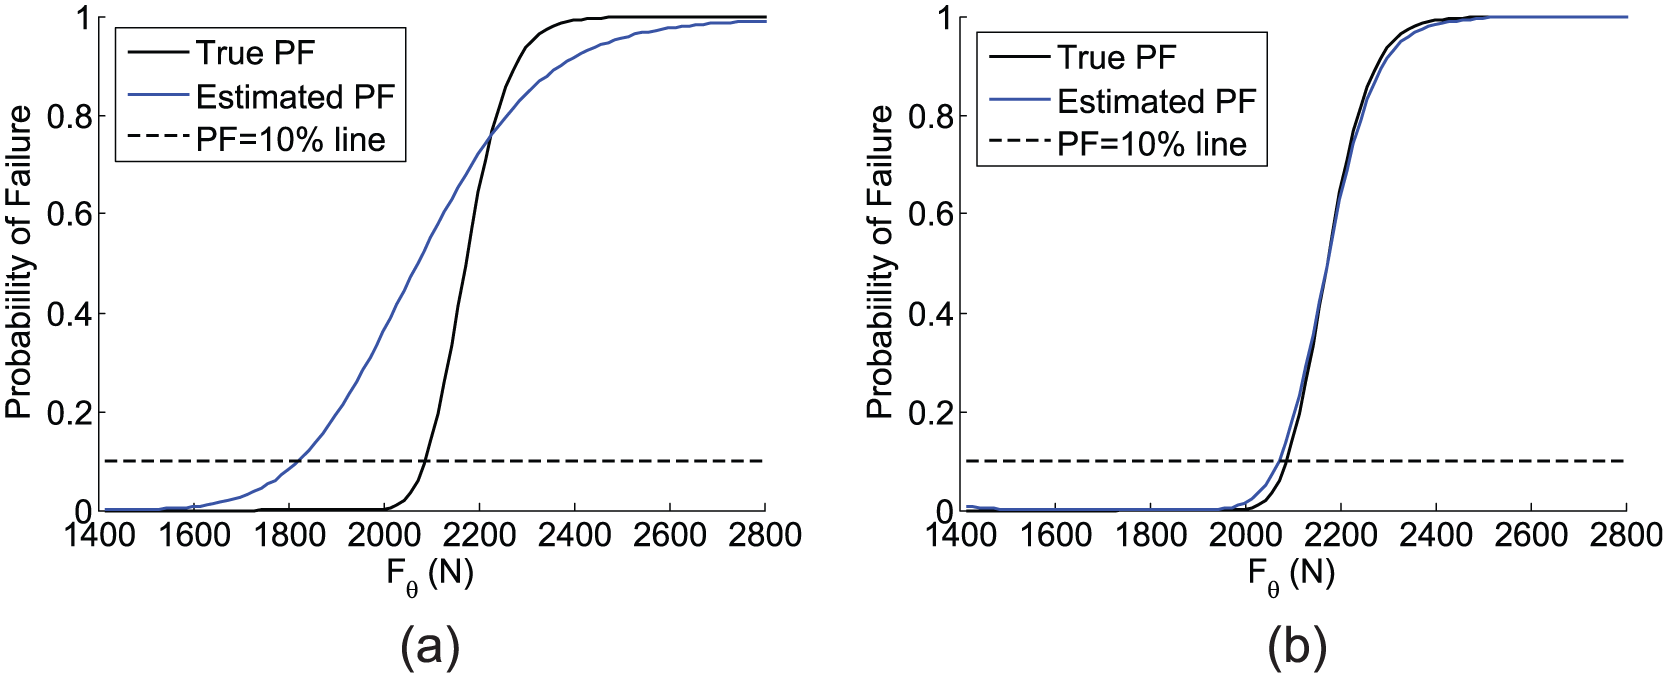
A comparison between true and estimated PFs: (a) before element test and (b) after element test.
Statistical analysis of conservativeness
The previous section explains the proposed approach to build a safety envelope with one set of coupon and element tests. In order to demonstrate that the proposed approach ensures conservativeness under test variability, the above-mentioned process of estimating a safety envelope is repeated with randomly generated test sets. Coupon and element test data were generated using the true material strength distribution and the true stress function. We consider that case when a single-element test is performed on the load path of Fy = Fz. We generated 10,000 test sets and calculate the load envelope on the load path. We found that for 737 out of 10,000 test sets, the estimated load envelope is greater than the true load envelope of 2088 N (see Figure 13). The suggested modeling approach provides a conservative estimate of load envelope as it was intended.

A histogram of calculated load envelope for the true load envelope of 2088 N.
Concluding remarks
In this article, we presented a method of estimating a safety envelope of structural element, which provides tolerance load satisfying the target probability for a given load combination. The probabilistic classification method with latent function is used to build a safety envelope. The proposed method considers epistemic uncertainties, calculation uncertainty and sampling uncertainty in coupon tests, in estimating a prior safety envelope. The prior envelope is then updated with element tests, which are carried out for reducing the calculation uncertainty. A cantilever structure is employed as a structural element to demonstrate the proposed method. It is shown that the safety envelope tends too conservative due to a large epistemic uncertainty. However, after including element test, the epistemic uncertainty is significantly reduced, and the safety envelope was enlarged that the load tolerance for a given load combination was increased by more than 20%. Without including element tests, the safety envelope was overly conservative. It is found that the proposed safety envelope is close to the true safety envelope and yet maintains conservativeness in the level of 93%, which is very close to the target PF of 90%. Incorporating information from element tests into estimating safety envelope is critical for reducing design conservatism.
GP is used to calculation uncertainty, and the GP model is updated using Bayesian inference with element test results. It is shown that even one element test can significantly reduce the epistemic uncertainty in calculation.
Footnotes
Academic Editor: Joo Ho Choi
Declaration of conflicting interests
The author(s) declared no potential conflicts of interest with respect to the research, authorship, and/or publication of this article.
Funding
The author(s) disclosed receipt of the following financial support for the research, authorship, and/or publication of this article: This work benefited from the US Department of Energy, National Nuclear Security Administration, Advanced Simulation and Computing Program, as a Cooperative Agreement under the Predictive Science Academic Alliance Program, under Contract No. DE-NA0002378.