
Abstract
The difference between the production cost and selling price of the products may be viewed as a criterion that determines an organization’s competitiveness and market success. In such circumstances, it is necessary to impact these criteria in order to maximize this difference. The selling products’ price, in modern market conditions, is a category which may not be significantly affected. So organizations have one option, which is the production cost reduction. This is the motive for business organizations and the imperative of each organization. The key parameters that influence the costs of production and therefore influence the competitiveness of organizations are the parameters of production machines and processes used to create products. To define optimal parameter values for production machines and processes that will reduce production costs and increase competitiveness of production organizations, the authors have developed a new mathematical model. The model is based on application of the ABC classification method to classify production line processes based on their costs and an application of a genetic algorithm to find the optimal values of production machine parameters used in these processes. It has been applied in three different modern production line processes; the costs obtained by the model application have been compared with the real production costs.
Keywords
Introduction
In order to determine the cost and selling price of a product, production organizations usually use accounting–mathematical methods of recording costs and expenses for a specific product. The difference between the cost and selling price is a criterion that determines production success. However, the selling product price, in modern market conditions, is a category which may not be significantly affected. Having this in mind, it is excluded to increase the selling price and in this way improve production performance; an organization may only use a second option, which is the production and labor cost reduction. 1 If the cost price is always decreasing, the difference between the sale price and the cost price will be constantly increasing. This is the motive of business and the imperative of each organization.
When important functions and activities of organizations are considered, it should be noted that organizational factors could have a significant influence. Organizational factors that stand out and have the largest influence are top management support, organizational readiness, and organizational size. 2 Studies have shown that top management support presents one of the most important influencing factors.3,4 If the top management support is high, it is possible to have greater participation in decision-making processes by executives. Commitment of the top management is essential to convince an organization to adopt new solutions. 5 Another important organizational factor identified by the scholars is organizational readiness, seen as the ability of organizational resources to adapt to a new situation on the market. 6 Considered organizational resources are financial, human, and infrastructure resources. Studies show that organizations have the goal to postpone the application of new solutions until they gather all the necessary resources. 7 Finally, the results show that organizational size as organizational factor is positively correlated to the organizational adoption of new solutions, 8 but there are other studies that indicate that small and medium organizations easily accept new solutions. 9 It may be concluded that these and other organizational factors are of vital importance to improve and promote effective work. In such circumstances, it is possible to implement a new ABC and genetic algorithm (GA) model for the optimization of production processes.
It must be kept in mind that any changes in production, and changes in the level of capacity utilization, have an influence on production costs. The cost of production is a basic part of the product cost in manufacturing organizations. The structures of the production costs are made of the costs of labor, tooling costs, machine tool costs, and the costs of the refrigerant and lubricant. 10
For large-scale modern machining production line processes, machining parameters (such as cutting speed, depth of the cut, feed rate) have an impact that is significantly important when it comes to reliability (tool life cycle), product quality (roughness of the product surface), production costs, and productivity. A disadvantage of machining production line processes is that these parameters are conservatively chosen based on the experience of workers, and although all the conditions are fulfilled, tools and machines are not being fully used, that is, the production cost may be reduced. 11
The ability of the production processes to achieve the intended organizational business objectives can be determined through organizational performance. The literature indicates that if the organizational performance is not appropriately treated, various weaknesses could occur, such as not clarified expectations of the employees; low productivity at all levels of the organization; unmotivated employees without the desire to do the best they can; employees may not have the appropriate skills and knowledge to contribute to the organization’s further development; non-harmonized processes and organization performance with organizational values, goals, and strategy; badly developed platform for decision-making; and poor relations and understanding between the employees and managers. 12 In order to avoid any weaknesses of the organizational performance, it is necessary to apply new approaches and solutions to measure and monitor organizational performance. 13 The main activities of measurement include collection, preparation, and analysis of data with the goal of the quality and efficiency of organizational performance improvement and the achievement of the objectives of the process and the organization as a whole. Based on the literature review, it can be concluded that the successful organizations use the proven performance management processes such as strategic maps and balanced scorecard systems to measure their performances.14–16 Within this procedure, performance measures defined as indicators are chosen (such as key performance indicators), which are used in order to quantify the organizational objectives. Properly defined indicators may point to discrepancies between the current and desired organizational performance and point into certain improvement directions. 17 For decision-makers and managers, these may be very important, because it allows them to find critical process points and identify actions for their correction. Using performance measures, organizations are not limited to traditional financial metrics; they can monitor critical success factors and gain a better insight into the processes and organizational performance.
However, even in organizations that make good decisions based on defined procedures and indicators, there is a tendency to neglect the possible underestimation of the existing issues related to the reliability of collected, integrated, and evaluated data required for reporting on the performance. This area is open to the application of new solutions, which are based on new technologies, methods, and defined models. Based on this, the authors have considered the problem of machining parameters’ optimization to reduce production costs.
Optimization represents a process which is used to adjust the input parameters of a particular objective function, so that the minimal or maximal output or the result could be achieved. 18 For machining production line processes, the main goal of the optimization could be to find the values of parameters that will be optimal for objective functions, which can present processing costs’ reduction, productivity enhancement, product quality improvement, and so on. These parameter values are found in a defined search space limited by the possibilities of working tools and machines. 19
The optimization method used in this article is a GA and it belongs to the metaheuristic group of non-conventional techniques of optimization (near-optimal solutions). 20 Metaheuristic methods, different from classical optimization methods, are characterized as methods with direct search and converging toward a global optimum, based on the heuristic probability theory. 21 These methods usually imitate some biological or molecular characteristics, or neural systems. A GA imitates the evolution process and it can provide solutions that are near-optimal for a large search space. Also, GA has been proven as a powerful method to solve optimization problems involved in many engineering practical problems. 22
Optimization for all production processes in the production line is not necessary, especially for some processes that are not expensive and do not use a lot of tool and machine time, so it is not rational to optimize them. Based on the literature review of articles dealing with the optimization of machining processes, and conducted by Yusup et al., 23 it can be concluded that the GA optimization method has been widely used. It has been identified that GA was mostly used to optimize machining time and tool wear, to minimize production costs, to find optimal surface roughness, and to minimize geometrical inaccuracy by optimizing some of the production parameters such as cutting speed, workpiece speed, depth of cut, feed rate, electrolyte flow velocity, and applied voltage. 23 Also, in this article, the authors have used GA as an optimization method for cost reduction, by optimizing cutting speed and feed rate.
Unlike the article mentioned in Yusup et al., 23 this article has two new contributions. In order to concentrate only on production processes that are most demanding in terms of cost reduction, the ABC classification method, as an addition to GA, has been used, which is considered as the first contribution. To determine the costs of the machining production process in real conditions, cost function, experimentally developed in the Faculty of Engineering in Kragujevac, was used, which gives precise and accurate results for all defined machining production processes. This function has been used as an objective function for the GA optimization method, which is considered as the second contribution of this article.
The ABC method is widely used to streamline an organization, and it is commonly used to manage inventory with a large number of distinct items 24 and may be suitable to classify production line operations and thereby increase effectiveness 25 of production parameters’ optimization.
In this article, the authors have presented the usage of GA optimization and ABC classification methods with an experimentally developed objective cost function to fully use production line processes by optimizing their parameters. Section Materials and methods is divided in two subsections Literature Review and Model definition. “Literature review” presents a literature review of articles related to the application of optimization methods for production processes’ optimization and presents the application of ABC classification usage, while subsection “Model definition” presents a model containing ABC classification and a GA method for production line process optimization. Section “Results and discussion” shows the results and a discussion of the used model, while section “Conclusion” concludes the article.
Materials and methods
Literature review
The following literature review briefly introduces the application of the optimization GA method for production line processes. It also includes an application review of the ABC classification method for model effectiveness improvement.
Optimization of the production line has its main difficulty, which is getting empirical and technical knowledge about the used line processes. Getting necessary knowledge of production line processes can be demanding work, 26 because it is necessary to include a larger number of influencing factors, such as equations that have been empirically obtained for tool life cycles, power and strength of the working machines, and desired product surface roughness. 27 All these factors influence the knowledge needed to define production line process parameters and functions, objective functions, and optimization criteria functions and limitations that define the search space. 28 In most cases, line process parameters and functions are cutting force, resistance of cutting, temperature of cutting, wear and life of tool, and finishing surface. Optimization may seek the optimal parameter values for only one objective function, or for more mutually conflicting objective functions (multi-objective optimization). For booth production line parameters’ optimization, with only one or more objectives, most commonly, functions are connected to production time, production costs, production accuracy, overall cost, productivity, profit, and so on.29–33 Based on these objective functions, the goal of the optimization is usually to minimize production time or cost, or cut fluid consumption; 34 maximize productivity or profit, or realize a certain level of product quality (surface finishing). 35 The functions and limitations that represent criteria for search space definition are usually related to the working machines, tools, and workpiece restrictions. 36 Production line processes are in most cases carried out in several passes, with finishing, and previous passes referred to as roughing. So the optimal parameter values in one pass may not necessarily mean that they are optimal in the other passes. In these situations, with multiple passes, primary production line parameters are cutting speed, step, and cut depth. 37
Having all this in mind, it can be said that optimization of production line processes is not an easy task, especially due to the large number of influencing factors.26,38 For all these reasons, GA presents a suitable optimization method because it deals easily with conflicting goals, adapts to the problem, and gives good optimal parameter values for production line processes. 31
GA is a search algorithm that imitates the iterative evolution process on a certain set of individuals. 39 Each individual in the set corresponds to a possible solution characterized by its fitness. Fitness is determined according to the suitability of an individual to a defined objective function or functions, and it presents the utility of the individual. 40 A set of individuals is usually called the population, whose size is determined prior to, and remains the same during the search process. At the beginning of the search process, in the first iteration, the population is built randomly. In all other iterations, the population is composed partly from new generated individuals and partly from individuals from a previous iteration. New individuals are generated using two operators, crossover and mutation. Crossover selects two individuals called parents, and then combines and exchanges their elements to generate two new individuals called offspring. A mutation operator is used to make small random changes to an individual. For these operators, a selection strategy is applied in a manner that gives a greater chance for individuals with a higher fitness value to be parents than those with lower fitness values. In this way, GA was applied to get optimal parameter values for many production line processes. In the following paragraphs, recent application of GA for optimization of parameters for certain production processes is presented.
GA may be used to determine the optimal values for the cutting parameters in multi-phase production line machines, by minimizing cost per unit of output and with respect to all constraints known from practice. 41 To optimize cutting speed, depth of cut, number of passes, and feed, in the multi-pass turning process, GA may be employed in two different ways.19,42 In one way, the mentioned literature presents the use of GA for multi-objective optimization, while in another way it presents the use of GA for optimization with only one objective function and 20 criteria limitations and functions. A great part of the literature30,42 presents multi-objective optimization in which multi-targets have been combined in two opposite functions, one function that may be presented as costs and another one that may be presented as productivity or quality.
An important thing which may be taken into account when it comes to optimization of production line parameters with GA is the ordered quantity of production. Quantity of production may be critical for high-volume production lines, because it directly influences the tool and working machine life cycles and the fulfillment of product delivery on time. Based on this, Al-Aomar and Al-Okaily 43 have presented a simple GA to determine the optimal values of computer numerical control (CNC) lathe parameters in order to reduce the cost per ordered quantity.
Application of GA may be effective for the CNC milling process.44,45 In the mentioned literature, the purpose of GA optimization is to determine cutting conditions that will lead to minimum surface roughness in milling. As some of the important influencing factors, the authors have specified the radial angle of the milling tool, and speed and pitch of the tool. Based on these influencing factors, regression models were formed, and the best of them was used as an objective function for GA. The results of the analysis have shown that GA may be used to estimate the optimal cutting parameters, while obtaining the minimal value of surface roughness and the respective mechanical constraints. The optimized cutting parameters were feed, cutting speed, axial depth of cut, radial depth of cut, and machining tolerance.
Although the values of model parameters generally cannot be known precisely and therefore are subject to aleatory (arising due to randomness) or epistemic (due to lack of knowledge) uncertainties,46,47 in this article optimization problem is abstracted to such a level that ABC classification and GA were used without propagation of mentioned uncertainties. The model includes the application of ABC classification and GA methods, to demonstrate their applicability in production process parameters’ optimization. However, further research will focus on the propagating of uncertainties and application of fuzzy set theory arithmetic for sampling of the values of the epistemic and aleatory uncertainties and their inclusion in the cost objective function.
To improve the results of optimization, there is a common practice to combine GA with other methods and techniques, such as artificial bee colony algorithm. 48 Abburi and Dixit 49 have combined GA and linear programming for multi-pass cutting; the goal of this multi-objective optimization was to minimize production time, which provided near-optimal solutions in the form of the Pareto front. To choose the best optimal solution among Pareto optimal solutions, linear programming has been applied. Similar application of GA for multi-objective optimization is seen with the neural network (NN) prediction method. In this way, it is possible to maximize the material removal rate and to minimize the tool wear and damage of the material properties. The testing results, also presented as Pareto optimal solutions, have shown that the model is relevant for prediction of the cutting parameters.50,51
GA may be used alongside simulated annealing (SA) to produce optimal results for a high-speed milling process. The combination of these two methods overcomes their weaknesses and unites their strengths.52,53
Besides the optimizing of production process parameters, it is possible to optimize the installation of the working machines in the production line by combining GA and greedy algorithms. The goal of this optimization may be to minimize the installation cost of the working machines. 54 Another similar application may be the use of GA alongside mixed linear programming to determine the optimal positions of CNC production line machines. 40
In this article, the authors have presented a model that has combined the usage of GA and the ABC classification method to overcome possible non-effective optimization of operations that do not require large costs, expenditure of working time, tools, and working machines. In the following paragraphs, recent application of the ABC classification method is presented.
ABC application
The ABC method is most commonly used for inventory classification,24,55,56 and it is often used with other methods, such as weighted linear optimization, fuzzy analytical hierarchy process (AHP)-data envelopment analysis (DEA), NN, the AHP, and the technique for order preference by similarity to ideal solution (TOPSIS) model.57–61
The ABC method is formed on the basis of Pareto analysis and is easy to use and understand. The ABC method divides elements of classification into three groups A, B, and C, according to the criterion crisp values. Selection of the criterion that will be used for problem classification has been considered and it especially depends on decision-maker estimation. Usually, elements in group A present 5%–10% of the total number of elements and 65%–70% in terms of their summarized criterion crisp values. On the other hand, elements in group B present 10%–15% of the total number of elements and 20%–25% in terms of their summarized criterion crisp values. Elements belonging to these groups are the most important for decision-makers; all the other elements that belong to group C are relatively unimportant. 62
It can be said that the application of the ABC method with other methods is wide and effective; in this way, the disadvantages of the used methods could be overcome. The ABC method may be used to monitor and distribute the cost of the production process activities. For these reasons, the authors have combined the use of ABC and GA methods within the model that will be presented in subsequent sections.
Model definition
In this article, a new model based on ABC and GA methods for optimization of line production processes is proposed. The main goal is to determine the optimal values of production parameters which will lead to cost and time reduction of line production. In order to understand the mathematical equations of the experimentally developed objective cost function in the model, the notation is presented in Table 1.
Notation.

A proposed algorithm based on the ABC classification method and GA
Step 1. Identification and determination of the number of production line activities; if the number of production activities is higher than 10, then go to Step 2, or else go to Step 4.
Step 2. Determination of overall cost Co and cost cp of each activity p in a certain line production which is not optimized
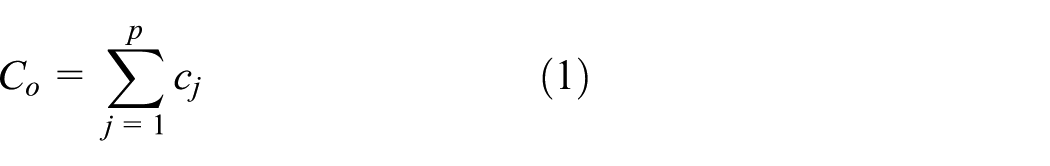
Step 3. Application of the ABC classification method to determine which activities belong to A, which to B and C group based on their costs cp for the observed production line. A(cp) that influences 67.5% of Co. B(cp) activities that influence 67.5%–95% of Co. C(cp) activities that influence 95%–100% of Co.
ABC classification is based on Pareto analysis. Using this method of classification, all production activities can be divided into three groups A, B, and C. Group A has typically 5%–10% of the total number of production activities and 60%–70% in terms of the overall costs; the second group B has up to about 20% of the total number of production activities and 30%–35% in terms of the overall costs; all other production activities belong to group C. 63
First, based on the cost of each production activity cp determined separately in Step 2, activities are the ranking from those with the highest costs, to those with the lowest costs. After that, percentage share of each activity cost cp in the overall cost Co also obtained in Step 2 was determined. Based on this, it is determined that activities with the highest costs which if summed together make up to 67.5% of the total cost Co belong to group A. Activities, which follow, with lower costs which summed together make up from 67.5% to 95% of the total cost Co belong to group B. All the remaining activities belong to group C.
Step 4. Definition of optimization functions and limitations for parameters of activities belonging to group A, or for all activities if their number is not higher than 10.
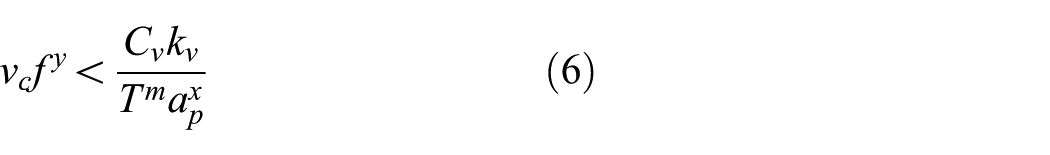
In practice, selection of production parameters’ values is usually based on production machine specifications and experience, to get the required final product accuracy. The parameter values’ selection directly influences machine productivity, reliability, and quality. This influence can be directly expressed through production cost, especially in large volume productions. For example, if the value of the machine feed is not appropriate, the amount of scrap material (surface roughness may exceed a certain required threshold) will be larger in large-scale productions. A similar example is when the economic effect of the production parameters on tool life and production time is analyzed. Because of production costs’ multiple and interconnected nature, significant production parameters can reduce production costs in one place and increase them in others. High-speed processing may result in a shorter production time, but it also may shorten the tool life cycle and increase costs of tool reparation or change. Having this in mind, and based on the literature review, 28 the authors have chosen to optimize speed vc and feed f of the production machines, as optimization parameters.
Production activities are accompanied by production costs, costs occurring due to usage of all structural elements of the production machining system starting from labor, tools, the production machine, and means of cooling and lubrication. These are all the elements of the objective function which are directly related to the costs of each production activity. Production costs are related to the following:
Labor costs
Tooling costs
Costs of the production machine
Costs of means for cooling and lubrication
They represent production costs.
As reliability, availability, and maintainability (RAM) are functions of time, such that reliability is the probability of zero failures over a defined time interval, availability is the percentage of time a system is considered ready to use when tasked, and maintainability is the measure of the time in which a system or equipment can be restored to operational status following a failure, 64 they are involved in time variables (tg, tpz, t1, and t2) which are multiplied by certain coefficients (k1i, k1 and k2) and in that way included in the cost objective function (overall cost Co).
Based on these assumptions and on the empirical results, a general experimentally developed objective cost function at the Faculty of Engineering in Kragujevac for each activity p has been obtained and presented as cost cp

To include speed vc and feed f of the production machines in the objective function, some modifications have been made.
Having this in mind, mechanical time could be presented as

Also, for the purpose of optimization, Zt may be presented as

Another modification referred to as tool resistance T depends on many influencing factors such as regime of cutting, geometry of the tool, materials used to make the workpiece and tool, type of tool, production line activity, and cutting type. In constant production conditions, the main parameters that have an influence on tool resistance are feed of tool, cutting speed, and depth of cut. 65 Having this in mind, the following empirical equation has been obtained

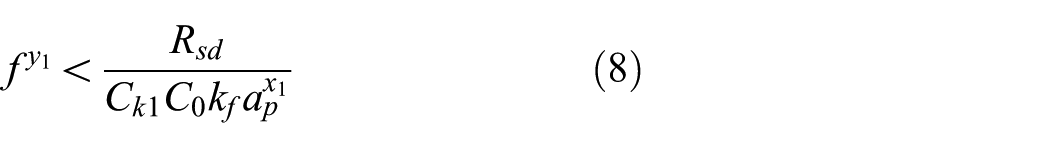
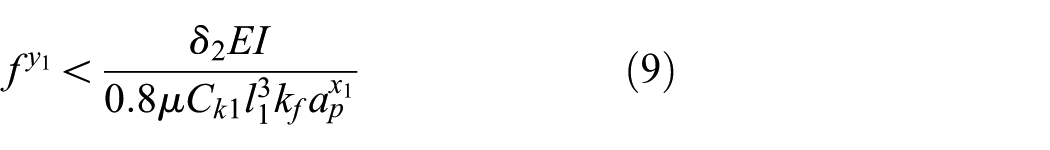
General constraint functions for each activity p based on the experimental results and literature 66 may be presented as follows:
Tool cutting ability limits
Limits of production machine power

Tool resistance–based limitation
Workpiece rigidity-based limitation
Speed limitation based on the minimum number of production machine spindle revolutions
Speed limitation based on the maximum number of production machine spindle revolutions

Feed limitation based on the minimum feed of the production machine

Feed limitation based on the maximal feed of the production machine

Based on the general objective function and limitations for each production activity, specific objective functions may be obtained.
Step 5. The application of GA to optimize parameters of activities belonging to group A. The parameters that will be optimized are vc speed and f feed of the production machines. The goal of the optimization is to minimize the cost cp of all production line activities belonging to group A, or for all activities, if their number is not higher than 10.
If p < 10, then
Step 6. Comparison of costs before and after optimization of selected production line processes. If the results of the optimization are not satisfactory, optimization may be repeated, until a satisfactory solution is found.
The model has been applied to three different production processes. A model application is presented in the following section.
Results and discussion
The model is tested on real-life data for three different production line processes, which have been obtained from manufacturing organizations. These three production line processes have been used for fabrication of a sleeve joint, special screw nut fabrication on a classic lathe and CNC lathe. To optimize the cost of production for these production lines, their activities have to be identified.
The first step in the model is to identify operations in the observed production line processes. The identified activities used to make the sleeve joint and to make the screw nut on the classic lathe and CNC lathe are given in Tables 2–4.
Technological activities used in production of the sleeve ball joint.

Technological activities used in production of the special screw nut on the classic lathe.

Technological activities used in production of special screw nut on the CNC lathe.

From Tables 1–3, it can be concluded that there are 22 identified operations in the production line process of the sleeve joint, 8 operations in the classical production process of the screw nut, and 4 operations in the CNC production process of the screw nut.
Having this in mind, the authors have used the ABC classification method and the experimentally developed objective cost function to determine which operations have to be optimized in sleeve joint production; operations in both processes of screw nut production are the subject of the optimization process, because their number is not greater than 10.
Using ABC cost analyses and the experimentally developed objective cost function in sleeve joint production of each individual activity, the cost results have been obtained and they are shown in Figure 1.

ABC cost-sharing analyses of the sleeve joint production process.
From Figure 1, it can be concluded that the largest costs (67.5%) are associated with five operations belonging to group A, which represent 22% of all operations in sleeve joint production. The number of operations belonging to groups B and C is consequently higher, but costs associated with these operations are smaller. Therefore, the parameters for these operations will not be optimized.
Operations belonging to group A that have been optimized are as follows:
40—Teeth making by a rolling process
90—Preliminary and final milling of six lanes for balls
20—Turning of the external surface
100—Chamfering the forehead of the six ball paths
30—Inner sphere copying and alignment
Generally, the activities that need to be optimized in the observed production line processes are rolling, milling, and turning activities. The rolling process may be applied to large volume production. It is usually used for gear teeth making by imprinting the gear profile into the workpiece with a simultaneously rotating tool.
Milling and turning as basic production processes are widely used in a range of mechanical product realizations. The costs of these processes play a key role in a competitive market. 67
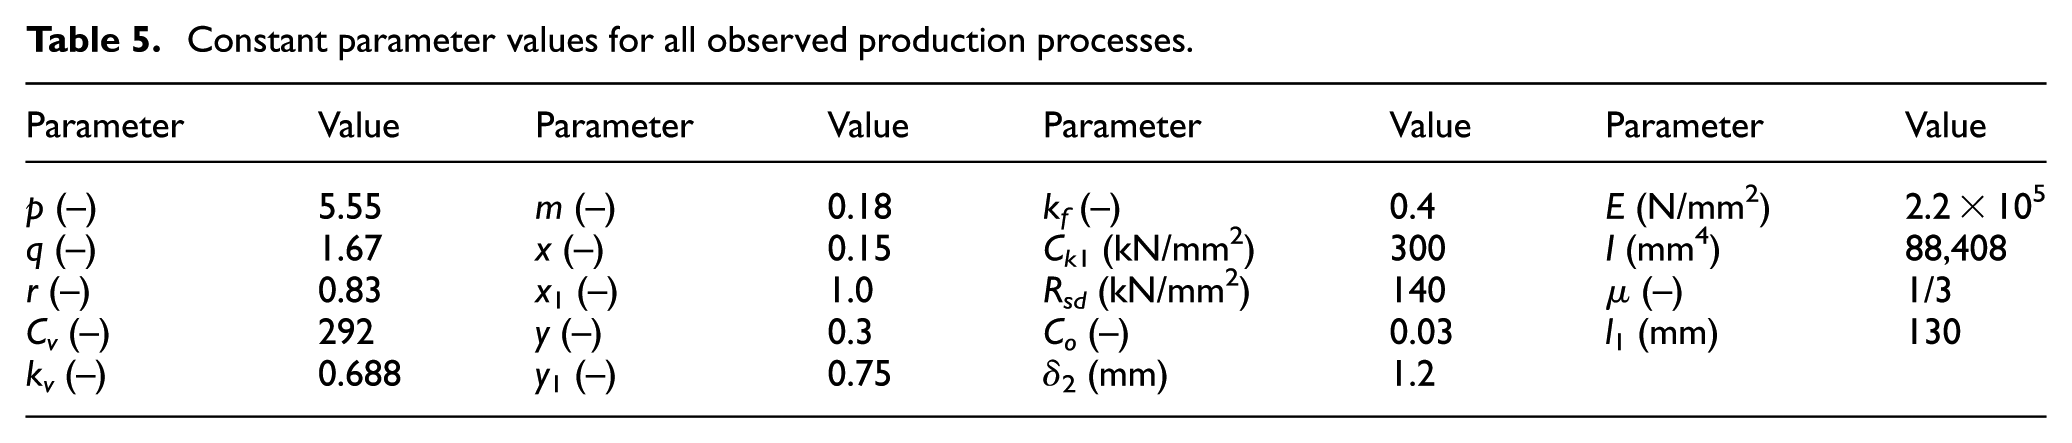
Tables 5–8 present the values in the production activities used in equations (2)–(13) to determine the optimal values of speed vc and feed f for production activities in all three production line processes.
Constant parameter values for all observed production processes.
Parameters for equations used in optimization of the sleeve joint production process.

Parameters for equations used in optimization of the classical screw production process.
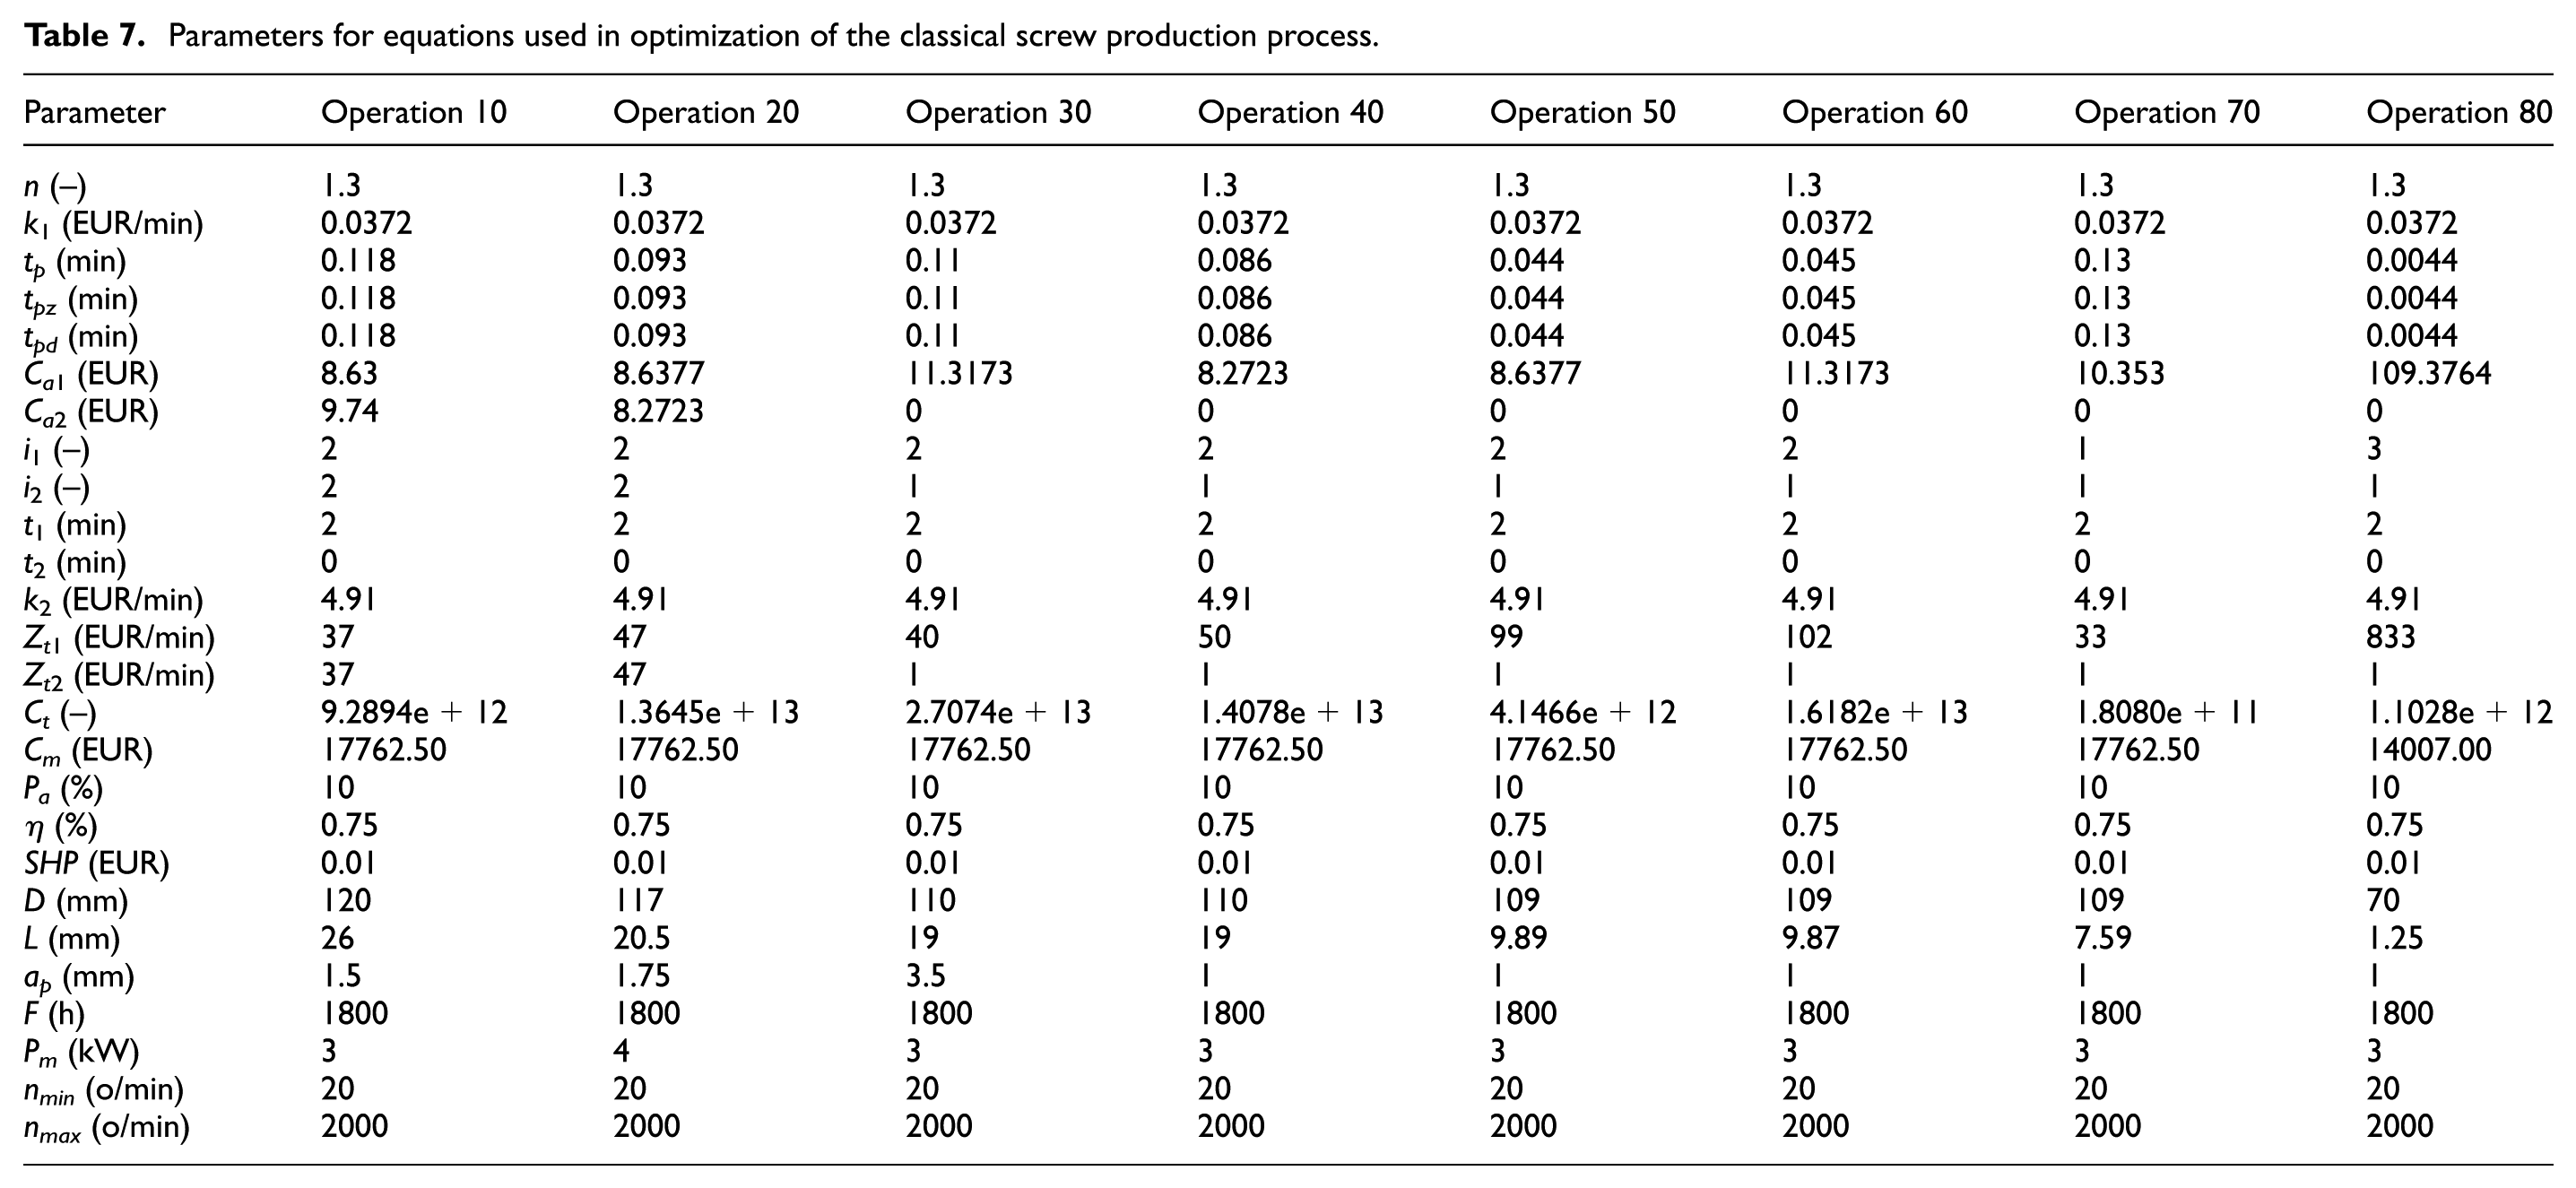
Parameters for equations used in optimization of the CNC screw production process.
The presented parameter values have been entered in the experimentally developed objective cost function and limitation functions. The experimentally developed objective cost functions for every activity that has been optimized in all three production process cases are as follows:
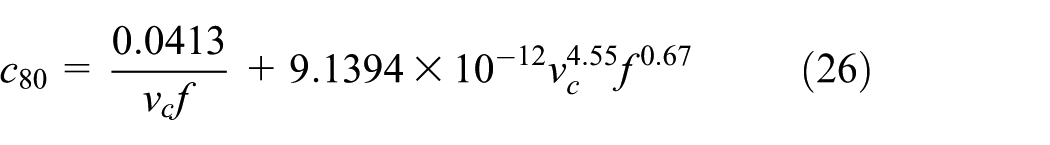
1. Sleeve joint production activities objective functions:
Teeth making by a rolling process

Preliminary and final milling of six lanes for balls 90

Turning of external surface 20

Chamfering the forehead of the six ball paths 100
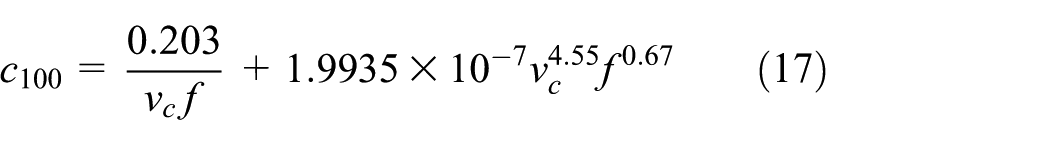
Inner sphere copying and alignment 30

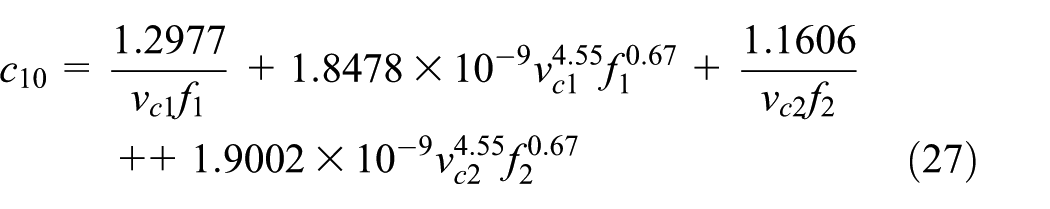
2. Screw production activities objective functions:
Workpiece pipe outer diameter grinding and cutting to a certain length

Internal processing of the hole and workpiece shortening to certain measures

Shortening the workpiece to the premeasure

Hole finishing to an exact measure

Other side treatment to an exact measure

Process of edge chamfering

Nut channel and certain angle processing

Process of threading
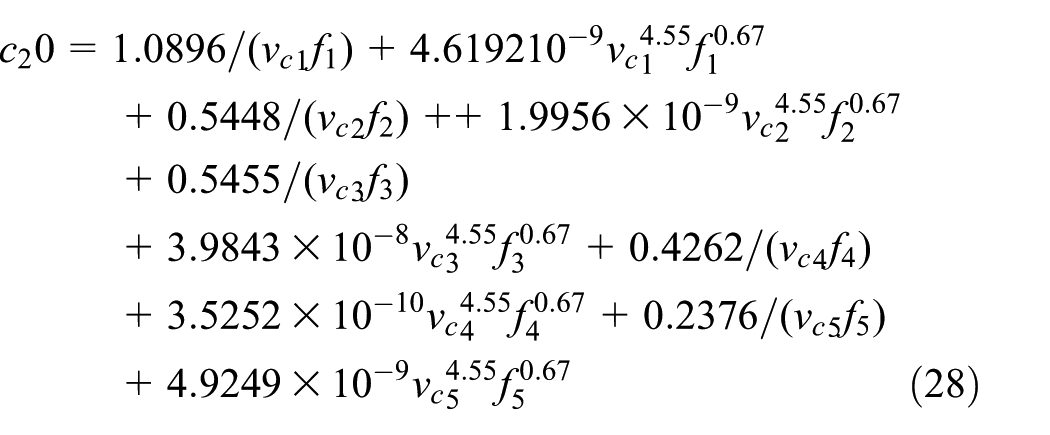
3. CNC screw production activities’ objective functions:
Workpiece pipe cutting to a certain length, transversal processing, internal hole processing, and the chamfering process
In the second operation, processing on the other side is done by transversal processing to a certain measure, longitudinal processing to a certain measure, nut channel processing to a certain measure, the chamfering process, thread cutting, and Groove milling for the key
The limitations for the tool have the form of each of the optimizations presented in Tables 9–11.
Limitation parameters for optimization of the sleeve joint production process.

Limitation parameters for optimization of the classical screw production process.

Parameters for equations used in optimization of the CNC screw production process.

After defining the experimentally developed objective cost function and limitations for each production process which will succumb to the optimization based on the algorithm (Step 4), GA toolbox in a MATLAB environment for optimization has been used. The defined optimization functions and limitations were entered in a suitable form for GA toolbox.
As already pointed out, in the literature there have been numerous examples of the GA application in optimization problems, but the number of related studies on the time complexity of these algorithms is relatively low. The GA performance is mostly measured by the number of fitness function evaluations while the algorithm operates. In this article, the number of fitness function evaluations is calculated as the product of population size and number of generations. However, for exponentially scaled problems, as in the problem observed in this article, the literature proposes that time complexity function should be of quadratic type. 68 In the MATLAB, if the population size is a vector of length greater than 1, the algorithm will create multiple subpopulations. Each entry of the vector specifies the size of a subpopulation. 69 Therefore, since the population size and used dataset grow, the problem size also grows, meaning that subsequent iterations take more time for the fitness evaluation. Having this in mind, for the observed variables and dataset, the time complexity may be labelled as O(n 2 ), similar to Ephzibah. 70 This means that polynomial time of degree is equal to 2 for this type of problems. MATLAB GA optimization parameters and their values: population size = 50, crossover = 0.5, mutation = 0.5, and number of generations = 100 are used.
If the population size is too small, for the algorithm it would be difficult to get the near-optimal solution, but on the other hand for large population size it would require a lot of calculation time. Based on the literature review, 39 population size is normally between 40 and 60; in this article, the authors have chosen the initial population size of 50 individuals, as a value just between the recommended values. If a too low crossover value is selected, for the algorithm it would be hard to search forward, but if the value is too high it may damage best individuals in the current population. The literature 18 suggests crossover value to be in between 0.3 and 0.9. Having this in mind, the authors have chosen crossover value just little lower than the value in between the proposed values, so that best individuals in the current population would not be damaged. Also, if the mutation value is considered, if it is too low it would be hard to introduce new individuals to the population, but if it is too high algorithm it would search randomly. It is recommended that this value be in between 0.01 and 0.2. 18 In this article, the authors have chosen the value of 0.05, in order not to have a large randomness in a population.
The number of generations is chosen based on the literature; 71 it proposes that the best number of generations should be determined as the desired number of function evaluations divided by the population size.
If greater number of generations of the GA is used, other near-optimal solutions can be obtained, but other better results would require more computational time. After calculations were performed, the obtained results for all equations of the experimentally developed objective cost functions in the sleeve production activities are presented in Figure 2, alongside the real costs obtained within ABC cost-sharing analyses.

Comparison of costs of experimental data and the costs obtained after optimization.
From Figure 2, it may be concluded that usage of parameters with the optimal values in the sleeve joint production process will reduce costs for all activities in group A of the ABC classification.
The optimal parameter values and costs, compared with experimental data for all the observed production process activities, are presented in Tables 12–14.
Extracted comparison of the optimization results with experimental data for sleeve joint production.

Extracted comparison of the optimization results with experimental data for the classical screw production process.

Extracted comparison of the optimization results with experimental data for the CNC screw production process.

The compared values’ optimal and experimental data for production process parameters show that GA gave optimal results for sleeve joint production activities’ parameters, which may reduce costs by 38.47% for group A from the ABC cost-sharing analyses. Other cost groups were not the subject of consideration for optimization because costs of these operations are not significant, and their optimization would be time-consuming, so it would not be effective.
Similar results have been obtained using GA for optimization of classical and CNC production process parameters. The optimal parameter values may reduce production costs by 63.22% in the classical and 47.32% in the CNC production processes. It may be concluded by comparing the optimal parameter values and experimental data that small changes in parameter values may greatly reduce costs in production line processes, especially in large series production.
Conclusion
The literature review showed that modern production processes present an interesting field for optimization methods’ application. Optimization gave good results for optimization of influential parameters. The motive for the use of modern optimization methods occurs out of necessity to solve complex problems with opposite goals and limitations, which cannot be solved by classical optimization methods.
In this article, the authors have presented the use of a model based on the ABC method to classify production line process costs based on an experimentally developed objective cost function and a GA optimization model to minimize production line process costs. A common application of the ABC method and GA is the first contribution of this article; the second contribution is the use of experimentally developed objective cost functions. The model has been used in three production lines, one with a larger number of production processes and two with a smaller number of production processes. A general experimentally developed objective cost function used within the optimizing is the result of the experiences in real production conditions of researchers at the Faculty of Engineering in Kragujevac.
It has been shown that the used model with experimentally developed objective cost functions gave good optimal results for all three production lines; it showed that the optimal parameter values may reduce production costs from 38% to 63%. It may be concluded that as a heuristic method which does not observe the objective function from only one point, but from different points in a defined search space, GA represents a reliable tool for determination of the optimal parameter values for production processes.
Unlike traditional optimization methods, with deterministic rules, GA uses probabilistic rules of parameter values’ selection from a search space allowing it to overcome the sets of defined nonlinear constraints. In this way, it overcomes being “trapped” in the sub-local search space of the objective function and finds a global optimal solution in a greater search space.
The used mathematical approach based on ABC classification, the experimentally developed objective cost function, and GA optimization provides near-optimal solutions, and it may be used for the selection of the parameter values in complex mechanical parts’ production, with a large number of constraints. The limitations of this model are related to the selected production line processes based on milling, turning, rolling, and drilling, that is, to the operations that are based on rotation and for which a defined global objective function may be used. Further research will be conducted in a direction that should include additional production processes and additional production parameters to be optimized. Finally, integration of the proposed model with intelligent production systems may lead to production costs’ and time reduction, and product quality improvement.
Footnotes
Academic Editor: Xichun Luo
Declaration of conflicting interests
The author(s) declared no potential conflicts of interest with respect to the research, authorship, and/or publication of this article.
Funding
The author(s) received no financial support for the research, authorship, and/or publication of this article.