
Abstract
Both stiffness and damping parameters of cabin suspension have important influences on the dynamic performance of cabin system for heavy truck. To theoretically study ride comfort of cabin system, the stiffness and damping parameter values of cabin suspension are often required. At present, there is no convenient method unless by bench test to accurately obtain all the stiffness and damping parameters; however, the cost of bench test is relatively high and inconvenient. In this article, according to the real cabin system of a heavy truck, a 3 degree-of-freedom cabin system linear model was presented and its vibration equations were built. By the tested cabin suspension excitations and seat acceleration response, based on curve fitting method, a stiffness and damping parameter identification mathematical model was established. With a practical example of cabin system, the stiffness and damping parameters were identified and validated by bench test. The results show that the built model and the proposed method are workable and lay a good foundation for the theoretical analysis and/or optimal design of cabin suspension to improve ride comfort.
Keywords
Introduction
Heavy truck is widely used in the field of transportation. 1 Its cabin suspension system, which influences driver’s health, is the important component of trucks. 2 Both the stiffness and damping parameters of cabin suspension have significance for the improvement of truck riding comfort. For example, the stiffness parameters of cabin suspension directly determine the modal frequencies of cabin vibration system. Prolonged exposure to occupational vibrations can lead to some diseases because of the unreasonable designs of cabin suspension.3,4
In recent years, a lot of research efforts on the modeling and design of the cabin suspension system for trucks have been made. Lemerle et al. 5 provided a simplified method to design suspended cabins for heavy-duty trucks. Temmerman et al.6,7 developed a linear mathematical model of conceptual cabin suspension system for a self-propelled agricultural machine and made operator comfort optimization. Caffaro et al. 8 analyzed the effects of a telehandler’s active suspended cab on whole body vibration level and operator comfort. Performance of earth-moving machinery cab with hydraulic mounts in low frequency was discussed by Sun and Zhang. 9 Evers et al. 10 studied active cabin suspension in commercial trucks. An active suspension system of a heavy machine cab was studied by Tora. 11 From these research efforts, it can be known that the stiffness and/or damping parameters of cabin suspension are obtained by bench test, in most cases.
To theoretically study ride comfort of cabin system, the stiffness and damping parameter values of cabin suspension are often required. Although they can be directly measured by bench test, the measurement method has some disadvantages. For example, if there is no special bench equipment for institutes of scientific research, it is often needed to do the bench test through truck manufacturers, other institutes, and so on. Mostly, the cost of bench test is very high; moreover, the test period is also relatively long. Therefore, it is often inconvenient for researchers to obtain the stiffness and/or damping parameters by bench test. In addition, in some cases, for the purpose of theory analysis of ride comfort, the equivalent stiffness and/or damping parameters are needed. Unfortunately, it is not easy to take the subsequent equivalent treatment of the parameters measured.
In some cases, system identification method is a good way to obtain parameters unknown.12,13 Using integral method, damping identification in frequency domain was studied by Guo et al. 14 An identification method for damping ratio in rotor systems was presented by Wang et al. 15 Do et al. 16 presented a new approach of friction model for tendon-sheath actuated surgical systems and made parameter identification. The identification of the manipulator stiffness model parameters in industrial environment was studied by Klimchik et al. 17 Thus, in order to obtain all the accurate stiffness and damping parameter values of the cabin system conveniently and fast, the parameters identification method is a better choice.
In this article, according to the real cabin system of a heavy truck, a 3-DOF (degree-of-freedom) cabin system model was presented. Combining the tested cabin suspension excitations and seat acceleration response, based on curve fitting of acceleration power spectral density, its stiffness and damping parameter identification mathematical model was established. With a practical example, the stiffness and damping parameter values were identified and validated by bench test.
Modeling of cabin system
Model assumptions
The real cabin system of heavy truck is a very complex system, and the cabin has 6 DOFs, which are three translational DOFs (lateral, longitudinal, and vertical) and three rotational DOFs (roll, pitch, and yaw). For the purpose of theory analysis of ride comfort, according to the structures of the cabin, the reasonable simplification of this system has to be done. A 3-DOF cabin system linear model was presented, as shown in Figure 1. Each suspension in the model is represented by a parallel arrangement of a spring and damper. The DOFs of the model are zc,

A 3-DOF cabin system linear model.
The model assumptions in detail are as follows:
Assumption 1: Because the driver’s seat is non-suspended (rigid), the seat and cabin are assumed to be one whole rigid body. Although both the seat and the cabin may twist in reality, their elastic deformations could be ignored for this simplified model.
Assumption 2: The cabin is assumed to have 3 DOFs.5,18 Although the cabin exists 6 DOFs, its actual motion is constrained by guiding mechanisms, and its lateral displacement, yaw displacement, and longitudinal displacement are all very small.
Assumption 3: Both suspension stiffness and damping of the cabin are considered to be constant. This article mainly focuses on ride comfort under stationary random excitations. Under the small amplitude vibration condition, the deformation of each air spring is in the limit of ±15.0 mm and there are no charging and discharging for each air spring. Although the characteristics of each spring stiffness is nonlinear, when each spring moves around the static position of the cabin, the deformation is in the linear interval of suspension stiffness characteristics.
Assumption 4: Because the seat cushion is very hard, the effect of its elastic deformation on the model is ignored.
Description of coordinate system and parameters symbols
The cabin coordinate system is established with its origin oc in the center of cabin system mass, defined as xc-axis for horizontal (parallel to truck driving direction), yc-axis for horizontal, and zc-axis for vertical upward, as shown in Figure 1. Note that the cabin system mass includes the mass of the driver, seat, and the cabin.
The symbols in the model are defined. In the key symbols, “K,”“C,” and “l” represent stiffness, damping, and distance, respectively; the subscript “c” represents cabin; the subscripts “r” and “f” represent rear and front, respectively; and the subscripts “R” and “L” represent right and left, respectively. In addition, mc is the cabin system mass; zcs represents the seat vertical displacement. Icx and Icy are the cabin system moment of inertia around the xc-axis and yc-axis, respectively; qi is the input of the ith suspension of the cabin, where, i = 1, 2, 3, 4; and rj is the distance between the installation position of the seat and origin oc in the jc-axis direction, where j = x, y.
Vibration equations
Vertical displacement of the cabin at the respective suspension installation position
According to the 3-DOF cabin system model as shown in Figure 1, by the displacement superposition principle, the vertical displacement of the cabin at the respective suspension installation position can be obtained.
The cabin vertical displacement at the installation position of its front-left suspension can be expressed as

The cabin vertical displacement at the installation position of its front-right suspension can be expressed as

The cabin vertical displacement at the installation position of its rear-left suspension can be expressed as

The cabin vertical displacement at the installation position of its rear-right suspension can be expressed as

The cabin vertical displacement at the installation position of the seat, namely, the seat vertical displacement, can be expressed as

Vibration equations of cabin system
According to the 3-DOF cabin system model as shown in Figure 1, using Newton’s second law, its vibration equations can be obtained.
The vertical vibration equation of the cabin can be expressed as

The roll vibration equation of the cab can be expressed as
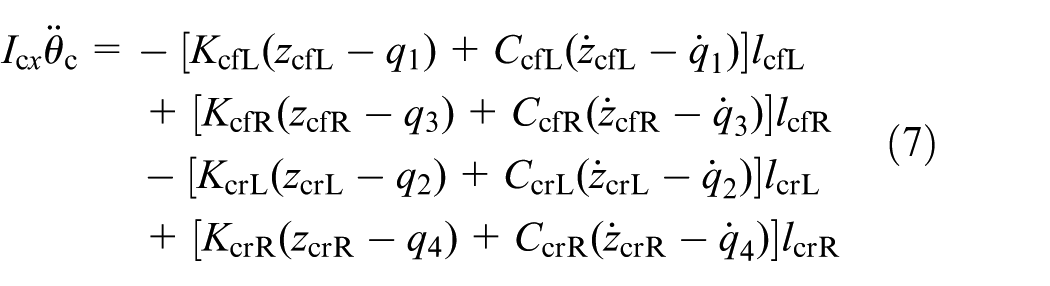
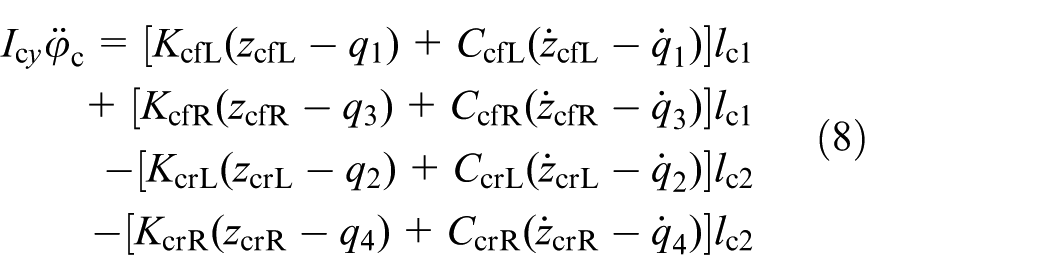
The pitching vibration equation of the cab can be expressed as
Stiffness and damping parameter identification
Stiffness and damping parameter identification mathematical model
For identification, by the simulation model of cabin system, using the tested q1–q4 as inputs, the simulation should be carried out.
Using curve fitting method, taking the minimum of quadratic error function

where KcfL, KcfR, KcrL, KcrR, CcfL, CcfR, CcrL, and CcrR are the variables to be identified.
In order to obtain the reasonable results of parameters identification, the relative vertical displacement of each suspension is limited by a proper range around a static position. Thus, the inequality constraints of parameters identification are as follows.
The inequality constraint of the relative vertical displacement of the front-left suspension of the cabin can be expressed as

where [zcfL-q1]upper and [zcfL-q1]lower are the given maximum value and minimum value of the relative vertical displacement of the front-left suspension of the cabin, respectively; (zcfL-q1)sim is the real-time simulation value of that, where the subscripts “upper” and “lower” represent the upper and lower boundary of the relative vertical displacement of the suspension, respectively, and the subscript “sim” represents real-time simulation. The subscripts of following formula are on behalf of the respective physical meaning.
The inequality constraint of the relative vertical displacement of the front-right suspension of the cabin can be expressed as

The inequality constraint of the relative vertical displacement of the rear-left suspension of the cabin can be expressed as

The inequality constraint of the relative vertical displacement of the rear-right suspension of the cabin can be expressed as

Experimental setup and data collection
For the purpose of providing accurate input signals and output signal for the simulation model to identify, the field measurement should be made. Taking the heavy truck to be analyzed as test object, four accelerometers should be installed on the frame at the respective installation position of cabin suspension, another four accelerometers should be installed at the four corners of the cabin, and an accelerometer should be installed on the seat pan. With the truck under the conditions of fully laden, the most common road and speed, and by the test equipment, the vertical vibration accelerations should be tested for a period of time.
The field tested signals of the heavy truck to be analyzed are acceleration signals; however, the simulation model needs displacement signals as inputs. Thus, the tested signals should be translated into the displacement excitations. In addition, the field tested signals are not stationary random signals at all; the noise signals need to be eliminated. Therefore, the tested signals should be processed as follows. First, through visual inspection of the time courses stationarity of the raw signals, the relatively stationary acceleration excitation signals of cabin suspension are extracted. Then, using the band-pass filter in special signal processing software Jbeam®, the pass-band is set as 0.5–40 Hz, and the acceleration excitation signals of cabin suspension required by the simulation model are obtained. By frequency-domain integral method with minimum cutoff of 0.5 Hz and maximum cutoff of 40 Hz, the displacement signals q1–q4 required by the simulation model are obtained through double integrating the acceleration signals, respectively. Simultaneously, the corresponding tested seat vertical acceleration signal and the accelerations at the four corners of the cabin should be extracted.
To sum up, according to the vibration equations of cabin system, using software MATLAB®, a simulation model can be established. In order to minimize the objective function J, this research adopted Genetic Algorithm in MATLAB® and then the specific program for parameters identification of cabin system was complied. By the simulation model of cabin system and the specific program, using the tested q1–q4 as inputs and the tested seat vertical acceleration response az as output, the stiffness and damping parameter values of cabin suspension can be obtained. In addition, to further verify the correctness of the parameters identified, the tested accelerations at the four corners of the cabin are used as the signals compared.
Example of stiffness and damping parameter identification
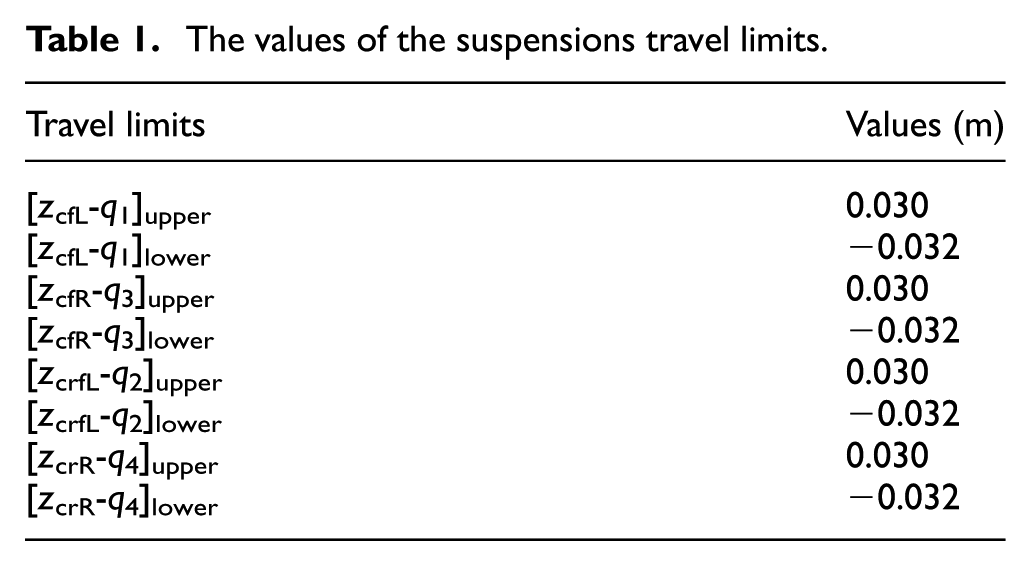
To demonstrate the effectiveness and correctness of the stiffness and damping parameter identification method, case study is carried out in this section. In this study, for a heavy truck with full-float cabin system, its drive type is 8 × 4, and its gross vehicle weight and load capacity are 45.0 and 65.0 ton, respectively, where the cabin suspension belongs to traditional passive suspension with air springs and hydraulic dampers. When the theory analysis of ride comfort for the cabin system is needed, all the stiffness and damping parameter values of the cabin suspension system should be accurately obtained. According to the enterprise standard provided, the suspensions travel limits are given in Table 1. The mechanical parameters have been obtained except the stiffness and damping parameters of cabin suspension as shown in Table 2.
The values of the suspensions travel limits.
The mechanical parameters known.

The collection and processing of cabin suspension excitations and seat response
Using the heavy truck to be analyzed as test object, according to the method mentioned in section “Experimental setup and data collection,” with the truck under fully laden, on the highway at 65, 75, and 85 km/h, the acceleration signals were tested, respectively. The sampling length was 100 s and the sampling frequency was 200 Hz. The raw data were processed. Owing to pace limitations, only the test results under the condition of 85 km/h are depicted in this section. The tested signals q1–q4 and the tested seat vertical acceleration response az with length of 40 s under the condition of 85 km/h are shown in Figure 2.
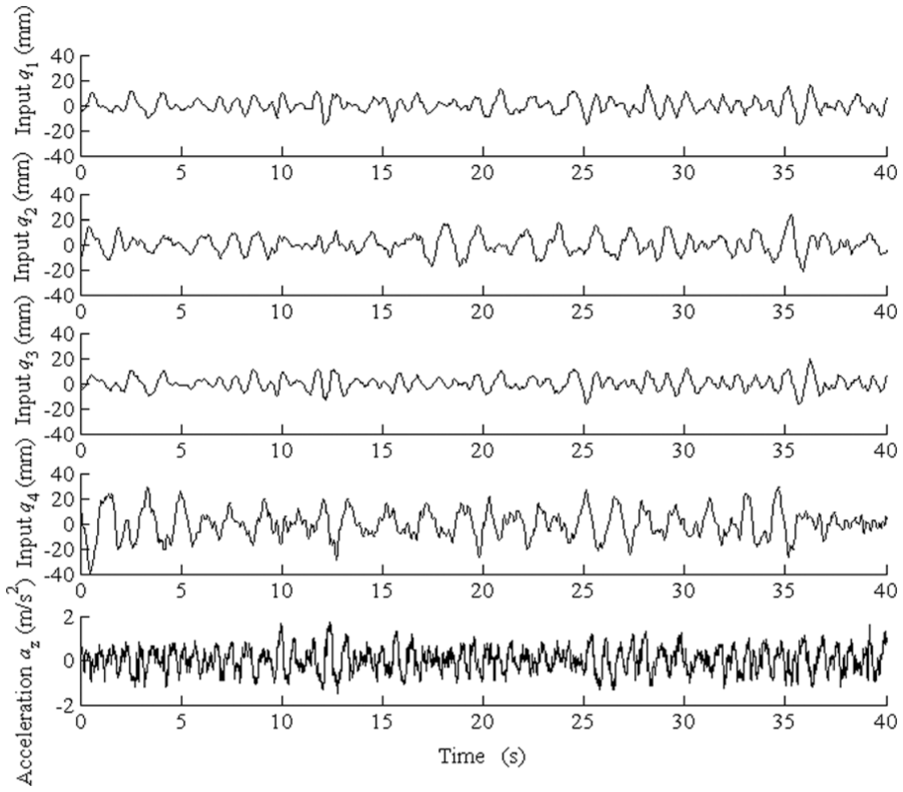
The tested signals q1–q4 and the tested seat vertical acceleration response az under the condition of 85 km/h.
Stiffness and damping parameter identification of cabin suspension
Identification results
According to the tested signals at 65, 75, and 85 km/h, by the simulation model, and the stiffness and damping parameter identification program, the parameter identification was done, respectively. The identification results are shown in Table 3.
Identification results of the stiffness and damping parameters.

From Table 3, it can be known that the discrepancies of the identification results at different speed conditions are very slight. In this study, the mean values of the parameters identified at different speed conditions are used as the final results identified.
Simulation verification of seat vertical acceleration
Owing to pace limitations, only the comparisons between the simulation results and the test results under the condition of 85 km/h are depicted in this section. Figure 3 presents a comparison of the seat vertical acceleration responses az between the tested and identified. Figure 4 presents a comparison of the seat vertical acceleration PSD (power spectral density) between the tested and identified.
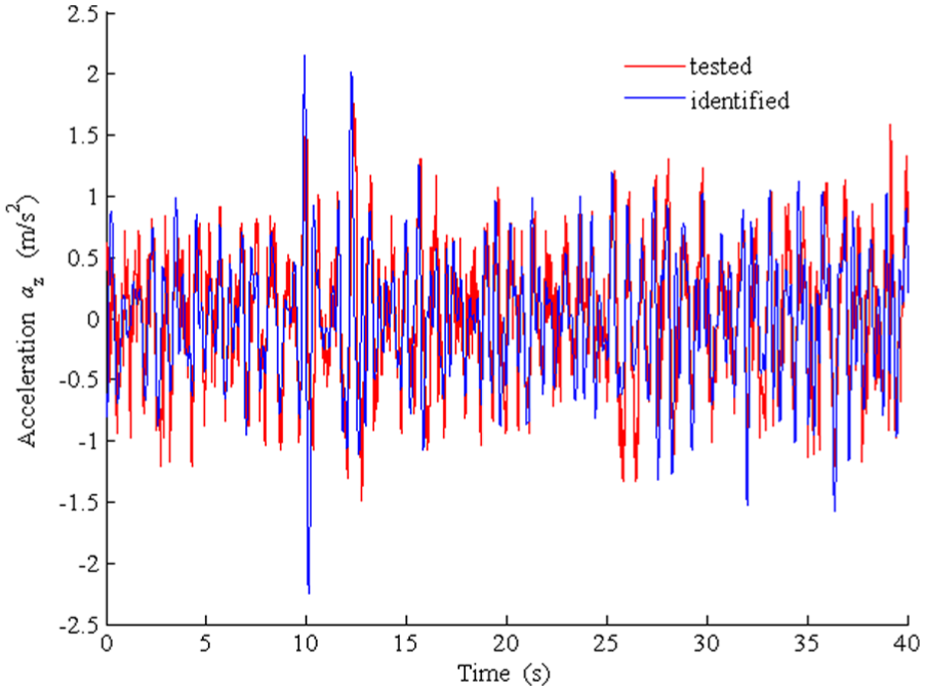
Comparison of the seat vertical acceleration response az between the tested and identified.

Comparison of the seat vertical acceleration PSD between the tested and identified.
From Figures 3 and 4, it can be known that both the identified az and PSD coincide well with the tested, respectively. Slight discrepancies exist, which may be mainly caused by the nonlinear characteristics of cabin suspension.
Simulation verification of cabin accelerations
In order to verify the correctness of the stiffness and damping parameters identified, by the simulation model with the parameters identified, the cabin accelerations at the respective suspension installation position were simulated. Then, the root mean square (RMS) accelerations are calculated, as shown in Table 4.
Comparisons of the cabin RMS accelerations at the respective suspension installation position.

From Table 4, it can be known that the relative deviations of the cabin RMS accelerations between the simulated and the tested are all less than 10.0%. The results show that the stiffness and damping parameters identified are acceptable.
Simulation verification of the suspensions travel limits
In order to further see the correctness of the stiffness and damping parameters identified, by the simulation model with the parameters identified, the maximum values of suspension deflections at different speed conditions were simulated and extracted, as shown in Table 5.
Maximum values of suspension deflections at different speed conditions.

From Table 5, it can be known that the maximum values of suspension deflections at different speed conditions are all less than the respective travel limits. The results further show that the stiffness and damping parameters identified are reasonable.
Test verification
In order to verify the effectiveness and correctness of the stiffness and damping parameter identification method presented and the cabin system model established, comparing them with the measured is needed.
Test verification of stiffness parameter values
Four air springs of the cabin suspension system were tested. The test was conducted by the test bench of spring, as shown in Figure 5(a). The user interface is shown in Figure 5(b).

Stiffness testing of spring: (a) the test bench and (b) the user interface.
The inflation pressure of each spring was set as 0.4 MPa, which was the same with that of each spring moving around the static position of the cabin. The equipment exerted displacement ±15.0 mm on springs at a constant loading speed of 5.0 mm/min, and the draft-pressure and displacement sensor measured elastic force and displacement. Using the analysis software to analyze the test data, the stiffness parameter values were obtained. The test results and comparisons are shown in Table 6.
Comparisons of the identified stiffness parameter values and the tested.

From Table 6, it can be known that the absolute deviations of the stiffness parameter values between the tested and the identified are 1303, 1988, 1717, and 2395 N/m, respectively; the relative deviations are 5.47%, 8.60%, 7.19%, and 10.40%, respectively. Moreover, the stiffness parameters identified are slightly larger than those tested, and the main reasons may be related to the nonlinear characteristics of cabin suspension system. In addition, the installation angle of each air spring contributes to the identification results. Actually, the stiffness parameters identified are equivalent stiffness of the cabin suspension system. According to the design requirements of air spring for the cabin suspension, around the static position of the cabin, the design error of each spring itself is smaller than ±16.0%. Thus, the identified results are acceptable. It proves that the parameter identification method presented and the cabin system model established are workable.
Test verification of damping parameter values
Four dampers of the cabin suspension system were tested. The test was conducted by the test bench of damper, as shown in Figure 6.

Performance test of damper.
The equipment exerted certain amplitude and frequency of sine wave exciter on dampers, and the draft-pressure and displacement sensor measured damping force and displacement. Using the analysis software to analyze the test data, the damping parameter values were also obtained. The test results and comparisons are shown in Table 7.
Comparisons of the identified damping parameter values and the tested.

From Table 7, it can be known that the absolute deviations of the damping parameter values between the tested and the identified are 127, 143, 151, and 128 N s/m, respectively; the relative deviations are 9.06%, 10.22%, 10.85%, and 9.10%, respectively. Moreover, the damping parameters identified are slightly larger than those tested, and the main reasons may be related to the dry friction damping of the guiding mechanisms of cabin suspension system. According to the design requirements of damper for the cabin suspension, the design error of each damper itself is smaller than ±15.0%. Thus, the identified values are acceptable. It further proves that the identification method presented and the cabin system model established are workable.
To sum up, through test verification of stiffness parameter values and that of damping parameter values, it can be known that the stiffness and damping parameter identification method presented and the cabin system model established are workable.
Conclusion
According to the real cabin system of a heavy truck, a 3-DOF cabin system linear model was presented. Based on curve fitting of acceleration power spectral density, its stiffness and damping parameter identification mathematical model was established. By the test verification of stiffness and damping parameters, the results show that the identification method is workable, and the linear model can be considered acceptable for representing the real cabin system to reflect the system dynamic responses. The cabin system model built and the stiffness and damping parameter identification method presented lay a good foundation for analysis and/or optimal design of cabin suspension to improve ride comfort.
Footnotes
Academic Editor: Francesco Massi
Declaration of conflicting interests
The author(s) declared no potential conflicts of interest with respect to the research, authorship, and/or publication of this article.
Funding
The author(s) disclosed receipt of the following financial support for the research, authorship, and/or publication of this article: This work is supported by the National Natural Science Foundation of China (51575325), the Nature Science Foundation of Shandong (ZR2013EEM007), and Key R&D projects in Shandong Province (2015GGX105006).