
Abstract
Aesthetic quality acceptance for road marking works has been relied on subjective visual examination. Due to a lack of quantitative operation procedures, acceptance outcome can be biased and results in great quality variation. To improve aesthetic quality acceptance procedure of road marking, we develop an innovative road marking quality assessment mechanism, utilizing machine vision technologies. Using edge smoothness as a quantitative aesthetic indicator, the proposed prototype system first receives digital images of finished road marking surface and has the images processed and analyzed to capture the geometric characteristics of the marking. The geometric characteristics are then evaluated to determine the quality level of the finished work. System is demonstrated through two real cases to show how it works. In the end, a test comparing the assessment results between the proposed system and expert inspection is conducted to enhance the accountability of the proposed mechanism.
Introduction
Road markings have important functions in providing informative guidance for vehicle drivers and at the same time enhance safety. Road marking has different types which include not only pavement and curb marking but also object markers, channelizing devices, colored pavements, delineators, barricades, as well as islands.
Several different materials have been used for road marking, and they vary in cost, durability, retro-reflectivity, surface suitability, and drying time. Main materials include paint, thermoplastics, epoxy, and tapes. Cement-based paint has been the original material for most road marking for many years, while recently thermoplastic product emerges as the main material since it provides a nice balance in durability, visibility, contour definition, retro-reflectiveness, and cost. Although the road marking material has stepped up, the craftsmanship has not improved at the same pace. Due to a lack of standard operation procedures for quality acceptance, the quality inspection of finished road marking has always been relied on subjective visual examination, which results in great quality variation in road marking works.
When road marking works are completed, there is a need to ensure the finished marking comply with the specified certification requirements in skid resistance, color, and retro-reflectivity. However, the craftsmanship requirements to deliver works with aesthetic appearance are not specified. According to Texas DOT’s “Standard Specifications for Construction and Maintenance of Highways, Streets, and Bridges,” construction of road marking has to follow the following guidelines (ITEM 666 REFLECTORIZED PAVEMENT MARKINGS):
Apply markings
That meet the requirements of Tex-828-B (test method);
Using widths and colors shown on the plans;
At locations shown on the plans;
In proper alignment with the guides without deviating from the alignment more than 1 in. per 200 ft of roadway or more than 2 in. maximum;
Without abrupt deviations;
Free of blisters and with no more than 5% by area of holes or voids;
With uniform cross section and thickness;
With clean and reasonably square ends;
That are reflectorized;
Using personnel skilled and experienced with installation of pavement markings.
Among these guidelines, “without abrupt deviations,”“free of blisters and with no more than 5% by area of holes or voids,”“with uniform cross section and thickness,” and “with clean and reasonably square ends” are related to paint finishing aesthetic quality. However, these guidelines are described in qualitative manner only and not easy to measure. Whether the finished work is complied with these guidelines or not is subject to inspector’s own judgment. Without more precise and effective operational procedures for aesthetic quality assessment, the following problems can raise:
Misjudgment due to personal prejudice;
Safety concerns for excessive stays on the jobsite;
Omission or indiscipline due to excessive workloads;
Improper manipulation.
To improve aesthetic quality acceptance procedure of road marking by diagnosing rough and uneven edges, this research develops an innovative road marking quality assessment mechanism, utilizing machine vision technology. Using edge smoothness as the aesthetic quality indicator, the mechanism receives digital images of finished road marking surface and has the images processed and analyzed to capture the geometric characteristics of the marking. A scoring system is developed based on the geometric characteristics so that a reliable quality indicator can be derived to assist in road marking acceptance process.
Machine vision technology is the use of optical non-contact sensing to acquire and interpret images automatically, by obtaining information and/or control machines or processes. Machine vision has been successfully applied to several industrial inspection problems, allowing faster and more accurate quality control. The manufacturing industry uses machine vision in detecting defects and controlling and calibrating its manufacturing process, which results in better products quality with lower manufacturing and inspection cost. Semiconductor manufacturing is one of the major industries that use machine vision optimally and profoundly. Machine vision–based inspection systems were applied in various stages of integrated circuit (IC) manufacturing for many years.1,2
In construction industry, machine vision was also applied widely in several fields. In construction automation, machine vision has been an important part integrated in automated pavement crack sealing,3,4 bridge inspection, 5 concrete surface grinding, 6 and sewer pipe and tunnel inspection. 7 Other researchers used machine vision technologies for automated construction progress monitoring.8,9 Machine vision and related video technologies are also gaining increasing popularity in intelligent transportation system (ITS) applications. For example, Rabie et al. 10 used a Mobile Active-Vision Traffic Surveillance System for incident detection and management. In geotechnical engineering, Suaw et al. 11 used machine vision for debris-flow monitoring.
Automated aesthetic assessment
Automated techniques for road marking inspection include automation in either data collection or data analysis through the process of road marking quality control. For data collection, laser systems mounted on vehicles dedicated for collecting retro-reflectivity have been developed in the United States and France.12,13 Some handheld instruments also exist for measuring luminance and color.14,15 For data analysis, methods utilizing machine vision for analyzing deterioration of road marking have been reported in Australia. 16 However, there has not been a fully automated system capable of capturing and analyzing all road marking characteristics for a complete assessment. 17 This article proposed a data analysis method discussing a new aspect in edge smoothness of road marking for the purpose of aesthetic assessment. This is an area that previous researchers have not probed thoroughly.
Judging road marking quality
To use machine vision for aesthetic road marking assessment, a mechanism to differentiate between a good marking and a bad one must first be determined. Figure 1 shows the comparison between a good marking and a bad one. It appears that edge smoothness is the main difference. The picture shows that the good marking with aesthetic appearance has smooth edges, while the bad one has rough and uneven edges. It can be concluded that the larger the edge deviates from a straight line, the poorer the quality, even when the marking might have met the certification requirements in skid resistance, color, and retro-reflectivity. This article hence uses edge smoothness as the aesthetic quality indicator for whether the marking should be acceptable or not after all other basic quality requirements are met. Edge smoothness can be regarded as the final quality assessment criterion of the road marking acceptance procedure.
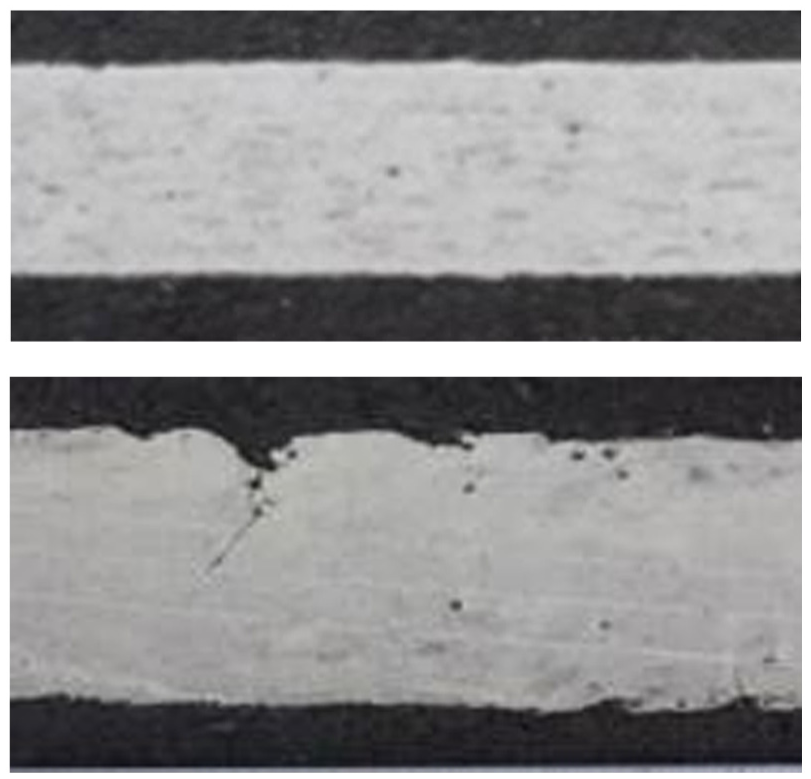
Road markings: good versus bad.
Assessment procedure
The steps to automated road marking aesthetic assessment using machine vision are described as follows.
Capture road marking image
This research team uses an entry-level 35-mm Canon 450D SLR with 50-mm standard lens (f1.8 aperture) to capture road marking images. The camera is mounted on a tripod to minimize image blurring. Shooting distance between the lens and the marking is 120 cm, and the image size is set at 2256 × 1504 (S). We use automatic shooting mode to always obtain images with accurate exposure (EV ± 0).
Prepare image through preprocessing
For prototyping purpose, the team makes use of two commercial image processing software packages (Photoshop® and Inspector®) to prepare the captured images for further analysis. Distortion calibration, gray-scale image transform, image enhancement, and noise reduction are the procedures required for this preparation. The procedures are described as follows:
Calibrate image distortion. Distortion is the effect when a straight line running near one of the edges bows inward (pincushion) or outward (barrel). All current camera lenses have some level of distortion, especially super-zooms. To allow accurate image presentation, the captured image undergoes a distortion correction process from Photoshop® to restore the image to a true horizontal and vertical alignment.
Gray-scale image transform. Color images are transformed into gray scale using Photoshop® because latter analysis requires only gray-scale images.
Image enhancement and noise reduction. Image processing techniques, such as median filtering, contrasting, brightness, and edge sharpening by Inspector®, are applied to enhance the quality of interested points and to remove noise.
Perform edge detection procedure
Edge detection is the mathematical procedure to identify object boundaries within the image. The proposed system accommodates Canny edge detection, which was first introduced by John Canny. In Canny’s algorithm, object edge is determined by an optimal function described by the sum of four exponential terms, 18 and Canny’s method always yields very good results.
Calculate edge deviation
When the edge is perfect, it should resemble a straight line. This research uses linear regression to determine this line from the edge pixel points. Suppose there are n pixel points {(xi, yi), i = 1, …, n} along the edge, and their mean is

Using the least squares approach, slope m and intercept c of the line equation can be solved as
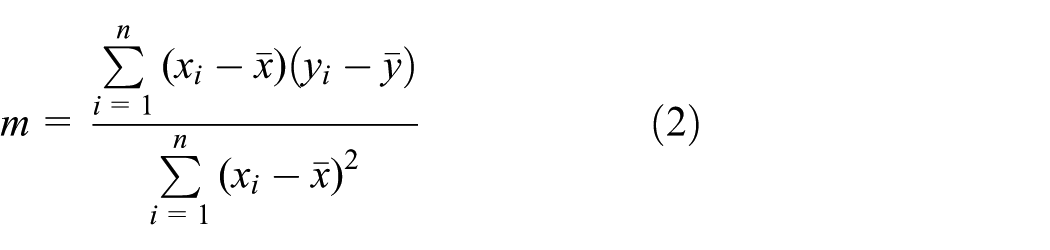

Therefore, deviation of each pixel point (xi, yi) can be calculated as

The average edge deviation in pixel is

Evaluate quality score
To determine if a road marking work complies with the aesthetic standards, its average edge deviation is analyzed. The error tolerance of the deviation is set at 1 mm which equals to 1% of the standard marking width 10 cm (100 mm). That is, when the average edge deviation is larger than 1 mm, the work should be assessed unqualified and requires rework. With the set resolution (2256 × 1504) and the actual dimensions of the captured picture (395 mm × 263 mm), the average deviation can be converted into actual deviation in millimeters with a calibration parameter of 263/1504 (0.175), in which 263 is the captured picture height in millimeters and 1504 is the set resolution of the camera. The quality score (Q) can thus be evaluated as the following

When the deviation is exactly at 1 mm, the marking is assessed with a score of 60, which is regarded as the passing threshold for aesthetic assessment.
System demonstration
The analysis methods have been implemented in a personal computer platform using MATLAB. With the image of finished road marking and its dimension as original inputs, the system prompts users to identify the assessment area of the work. Next, a quality score is given, and the edge detection results and the regression line are shown.
In order to show the applicability of the system, the two cases previously described in Figure 1 are used as test beds. The upper edge and lower edge in each case is evaluated individually, and their average represents the final score. The evaluation results are presented in Table 1, which shows that good marking has a final score of 77.229, and the bad marking is evaluated at 11.642. The bad marking apparently fails the test and should be reworked to improve its aesthetic quality.
Aesthetic assessment: good versus bad.

Figures 2 and 3 show a platform operation session with MATLAB.
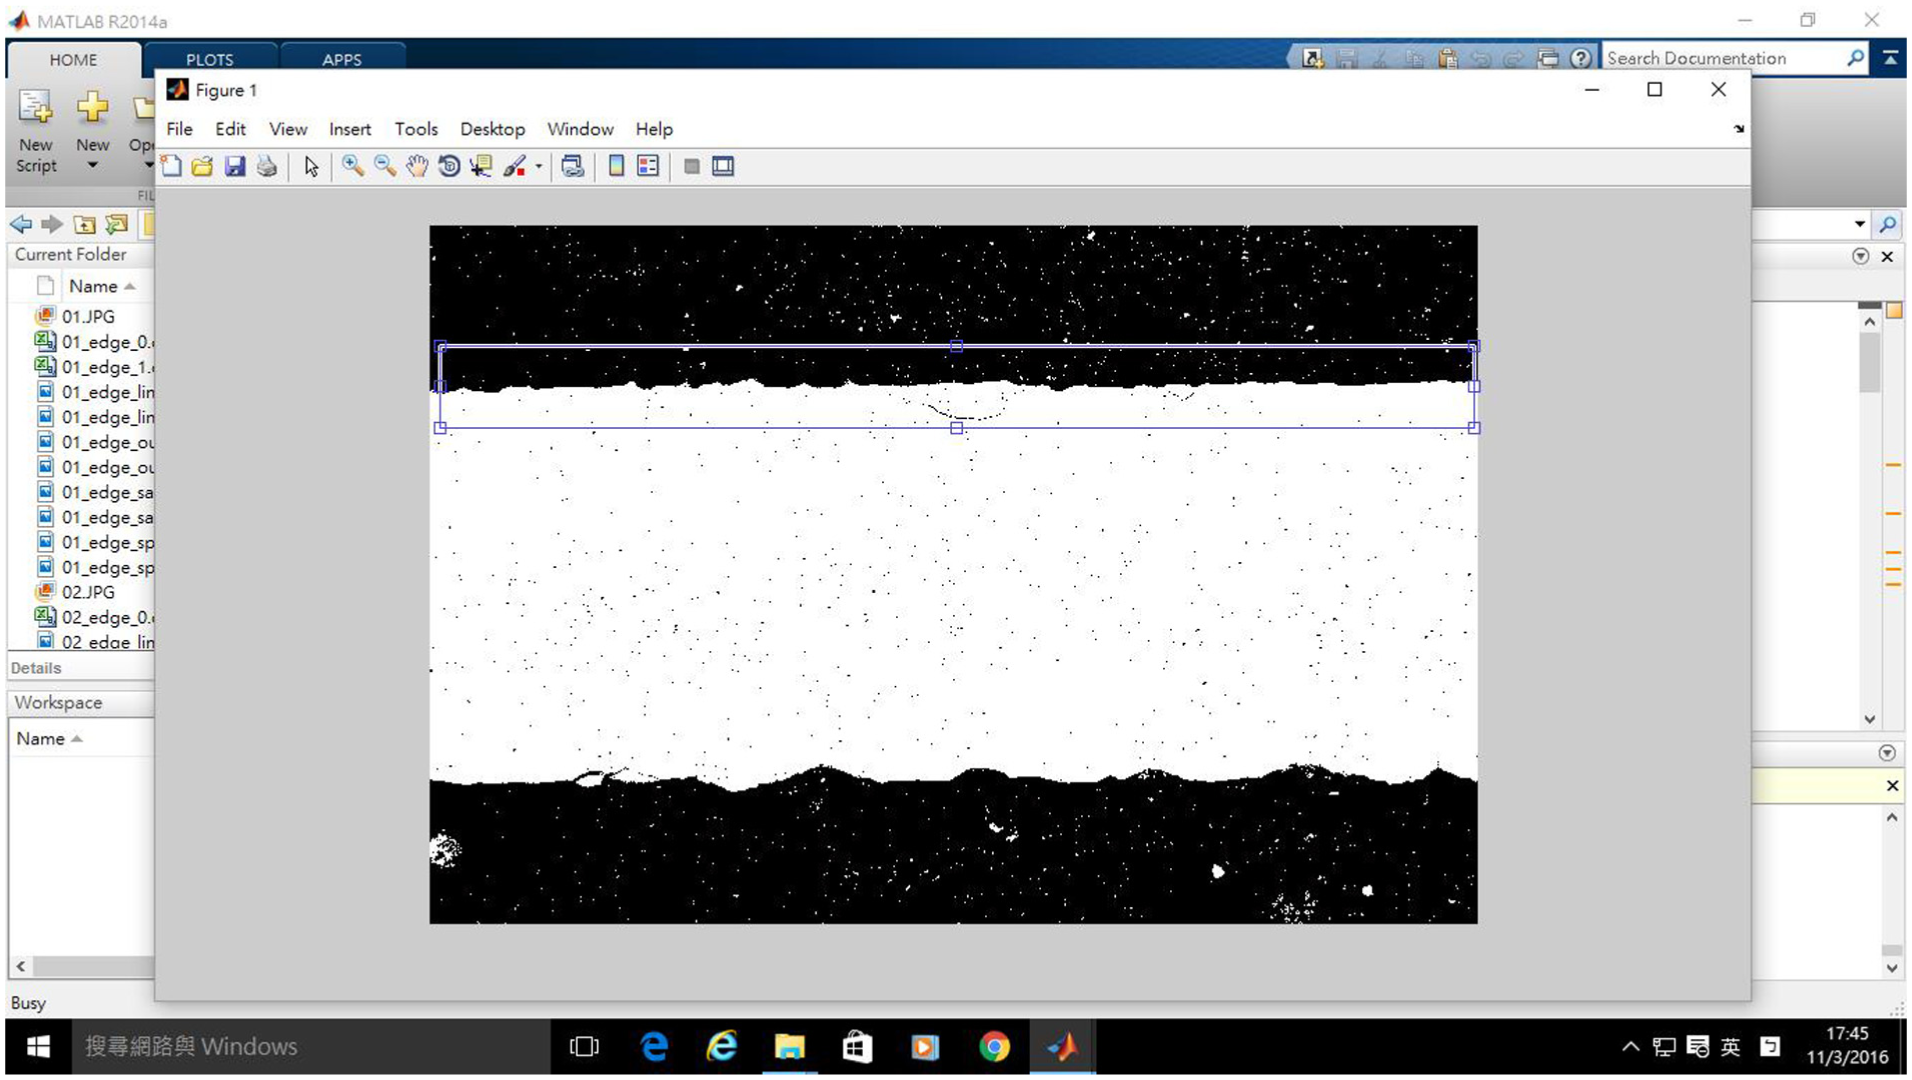
MATLAB platform operation session—identify area for assessment.

MATLAB platform operation session—edge detection and its final score.
System verification
To verify the accountability of the proposed system, the research team has conducted a test to compare computer assessment against expert assessment. The research team collected images of 30 road markings and these images were processed and analyzed by the proposed system to obtain computer scores. For comparison purpose, we organized an expert panel of five experienced professionals, including two jobsite managers, two foremen, and one architect to perform expert witness inspection. Experts were requested to mark their aesthetic assessment from very poor (0) to very good (10) on a fuzzy-scaled expert assessment sheet of all 30 works, as one shown in Figure 4. The 5-scale sheet is equally divided into 20 levels to allow in-between assessment, with each level separated by 0.5 point. Experts were also advised that passing threshold is “fair,” which exemplifies the basic acceptable level from witness inspection. The results are presented in Table 2. The computer and expert assessment were then compared and analyzed with a correlation test. The statistic results showed a significant correlation between the two groups with a coefficient of determination (r2) of 0.82, suggesting that our computer scoring method can be used to predict expert assessment.

Expert assessment sheet.
Aesthetic assessment results.

Pass: numbers in black; fail: numbers in red.
To further compare the outcomes between experts and computer, we model the road marking assessment as a binary classification problem and see how well the computer performs against the experts. The experts’ majority opinions are deemed as the trusted external judgment, and the computer is to predict the judgment. There are four possible predicted conditions:
True positive: when experts assessed pass and computer assessed pass;
True negative: when experts assessed fail and computer assessed fail;
False positive: when experts assessed pass but computer assessed fail;
False negative: when experts assessed fail but computer assessed pass.
The confusion matrix of the prediction is shown in Table 3.
Confusion matrix (pass threshold = 60).
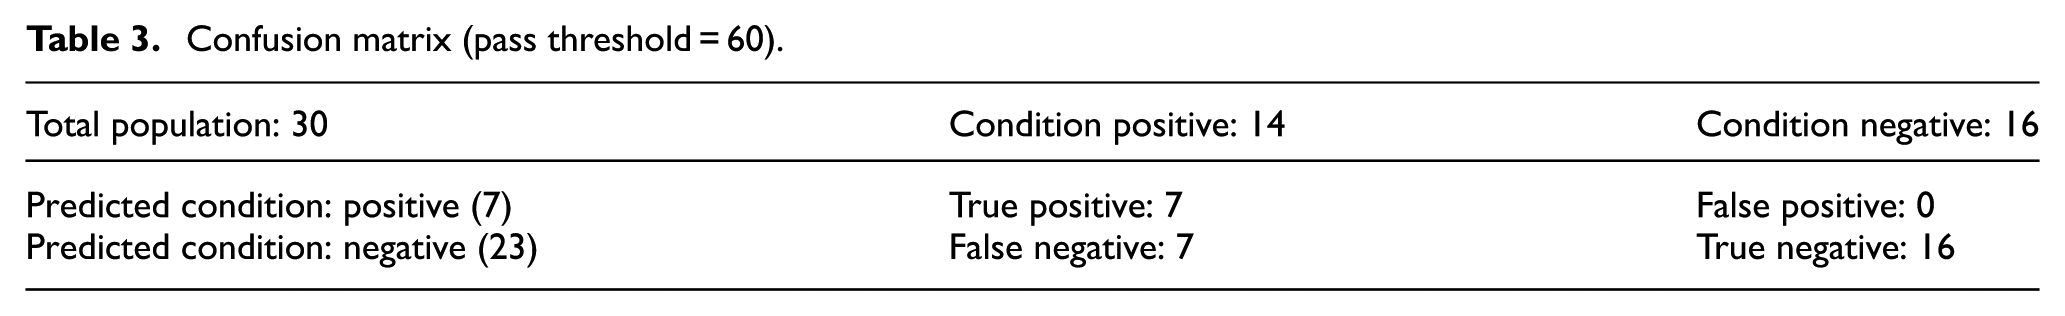
Prediction performance of the computer can be determined by the following three indicators:
Accuracy = (Tp + Tn)/Population = (7 + 16)/30 = 76.67%;
Precision = Tp/(Tp + Fp) = 7/7 = 100.00%;
Recall = Tp/(Tp + Fn) = 7/(7 + 7) = 50.00%.
The computer’s prediction accuracy is an acceptable 76.67% and reaches 100% precision rating, meaning the computer can precisely identify good markings. However, the computer’s recall is mere 50%. In total, 7 out of 14 good markings are assessed as bad ones. Moreover, we examine the seven cases that the computer did not successfully identify as good markings, and find out that these markings were about marginally acceptable quality, and were rated from 42 to 58 points by the computer. We also find that experts did not reach consensus on five of these seven cases. That is, although at least one expert assessed these cases as “fail” like the computer did, the majority opinion was still “pass.” This finding has shown the difficult and unreliable nature of witness assessment, especially when quality level is at margin.
More from the analysis, we can conclude that the pass threshold of 60 for computer was too harsh compared to experts’ opinions. Therefore, we lower the pass threshold to 50, and run the binary classification again, as the new confusion matrix shown in Table 4.
Confusion matrix (pass threshold = 50).

The three performance indicators then become the following:
Accuracy = (Tp + Tn)/Population = (12 + 14)/30 = 86.67%;
Precision = Tp/(Tp + Fp) = 12/(12 + 2) = 85.71%;
Recall = Tp/(Tp + Fn) = 12/(12 + 2) = 85.71%.
After threshold adjustment, the prediction accuracy has increased to 86.87%, but the precision is down to 85.71%, due to two false positives that were previously assessed fail. Recall increases tremendously to 85.71%. The total performance is better after this adjustment. This adjustment is considered beneficial and it makes the system more accountable.
Conclusion
This article presents a machine vision–based quality assessment tool for road marking, particularly in the aspect of edge smoothness. The tool makes use of various image processing technologies for image enhancement, noise reduction, and edge detection. The authors successfully developed a quantitative mechanism for measuring road marking aesthetic level using average edge deviation. The system has been tested with real cases and appears to deliver reasonable and accountable results. We believe that application of the proposed mechanism can effectively reduce improper manipulation of road marking acceptance procedures and prompt jobsite management to focus on promoting fine workmanship of road marking.
Currently, the prototype system has been completed with commercial software packages (Photoshop® and Inspector®) for image enhancement and noise reduction. The offering capabilities of these packages provide adequate preprocessing flexibility. However, if a commercialized version of our system is to be carried out, required image enhancement and noise reduction capabilities as well as a dedicated edge detector should be integrated to the proposed curve-fitting algorithm and scoring mechanism to ensure seamless automation. The curve-fitting algorithm has delivered fast and reliable supports for calculating average edge deviation, but some other robust methods such as the Hough transform can also be attempted to improve the edge detecting efficiency in the future.
Through the examination of the divergences between expert decision and the computer, we have disclosed the fact that even an expert may have trouble making up his mind when the quality level is at margin if he is not provided with better measurement tool. The computer scoring system described in this article might just be the perfect tool to improve his decision-making when aesthetic aspect of road marking is at hand.
Footnotes
Academic Editor: Stephen D Prior
Declaration of conflicting interests
The author(s) declared no potential conflicts of interest with respect to the research, authorship, and/or publication of this article.
Funding
The author(s) disclosed receipt of the following financial support for the research, authorship, and/or publication of this article: The research team wants to thank Ministry of Science and Technology (Taiwan) for its generous financial funding to this research project; (NSC 101-2221-E-214-069-).