
Abstract
Wave–seabed interaction has become a big concern of coastal researchers and engineers in the past decades as it may largely contribute to the seabed instability and failure of marine foundations. A series of laboratory experiments are carried out in a wave flume to study the wave-driven pore-water pressure in a sandy seabed and the attenuation of wave height. Waves propagating over a sandy seabed lead to oscillatory excess pore-water pressures within the porous seabed. Amplitude of pore-water pressure within the seabed decreases toward the bottom. A phase lag of pore-water pressure is clearly observed, and it contributes to net upward pressure related to seabed instability. Height of the incident wave is reduced as part of wave energy is dissipated by bottom friction, and a maximum attenuation of the incident wave height is up to 7.23% in the experiments. The influences of wave period and height of the incident wave on pore-water pressure and wave attenuation are also analyzed and discussed.
Introduction
The problem of wave–seabed interaction has attracted more and more attentions of coastal researchers and engineers, as it plays an important role in the estimations of seabed stability and foundation design of offshore structures. Most marine sediment is a coupled three-phase system, consisting of air bubble, pore fluid water, and inter-contacting soil particle. When ocean waves propagate over marine sediment, it normally causes simultaneous pore-water pressure and seepage flow in the seabed. A quick accumulation of pore-water pressure can significantly reduce the effective stress in soil and cause seafloor instability problem. In return, wave energy loss may be induced by the porous medium, leading to wave height attenuation.
Much effort has been made by many investigators to study the wave–seabed interaction in the past decades. Jeng 1 reported numerous theoretical studies about wave–seabed interaction. On the basis of the three-dimensional (3D) consolidation theory of Biot, 2 Yamamoto et al. 3 developed a semi-analytical solution for wave-induced seabed response in a seabed of infinite thickness. Later, Hsu and Jeng 4 obtained a close-form analytical solution for wave-induced seabed response in a seabed of finite thickness. In addition to theoretical studies, many experimental studies have also been carried out. For example, Tsui and Helfrich 5 measured pore-water pressures in a permeable model layer by water flume experiments with various wave parameters. Sassa and Sekiguchi 6 studied wave-driven liquefaction of beds of sand in a centrifuge, and they concluded that liquefaction of the sand layer was caused by the build-up of residual pore pressures. Chang et al. 7 carried out a series of two-dimensional (2D) wave tank experiments to investigate the relationship among waves, the pressure on seabed surface, and the dynamic stresses within the seabed. Cheng et al. 8 studied the relationship between the distribution of pore pressure and bed profile change under breaking waves. In their experiments, the net upward pore pressures were found to enhance the sand transport by reducing the effective weight of the sediment. The experiments of Liu et al. 9 indicated that the sand layers that were liquefied experienced a process from loss to recovery and enhancement. Liu et al. 10 carried out one-dimensional (1D) cylinder experiment to study wave-driven oscillatory pore pressures in a sandy seabed, and their experimental results confirm the existence of “sharp corner” which has appeared in theoretical analysis in pore pressure distribution. Wang et al. 11 investigated the standing wave-driven pore pressure by newly developed rectangular flume and found that oscillatory pore pressures can also be caused by the deviatoric stress.
When an ocean wave propagates on a porous seabed, not only wave induces pore-water pressure within the seabed but also wave characteristics correspondently transform due to the effect of the permeable seabed. Numerous theoretical studies have been carried out to characterize the wave damping over a porous layer.12–15 Experimental investigations have been also conducted by many coastal geotechnical engineers. Savage and Fairchild 16 investigated the wave energy loss caused by bottom friction and percolation, indicating that loss of energy increases to a maximum rate during formation of the ripples in terms of bottom friction. Corvaro et al. 17 carried out experimental investigation of wave damping due to the permeable seabed and showed that wave parameters (wave height and wave nonlinearity), the Ursell parameter, and geometric properties (length and thickness) have important impacts on the attenuation of the incident wave height.
Although many efforts have been made in the previous studies, the problem of wave–seabed interaction is not completely understood due to the complicated mechanics of seabed response under ocean waves. Sandy seabed is frequently encountered in the design of coastal and offshore engineering, and its dynamics response to ocean waves is always a big concern. Moreover, in most previous experimental studies, either wave-driven pore-water pressure within the seabed or attenuation of water waves was reported. Few experiments were carried out to investigate both the aspects. This study is to experimentally investigate the mechanics of wave-driven pore pressure and the phenomenon of attenuation of water waves, and the influences of wave parameters (wave period and wave height) on wave-driven pore pressure and wave damping in a sandy seabed will also be studied.
Experimental model
This study is primarily based on a series of laboratory experiments. The details about experimental set-up, experimental conditions, and procedure are given in this section.
Experimental set-up
A series of experiments are carried out in a wave flume (48 m long, 0.5 m wide, and 1 m high) for the investigation of wave–seabed interaction in a sandy bed. A hydraulic piston-type wave-maker is located at the upstream end and a porous plastic type sloped wave absorber at the downstream end to reduce/avoid wave reflection. As illustrated in Figure 1, sand is placed into a cavity box of 3 m long, 0.5 m wide, and 0.4 m deep which is located 16 m away from the wave-maker. The pressure transducers for measuring pore-water pressure are installed in the middle of the sand box at four depths (z = 4, 7, 17, 28 cm, in which z is the vertical distance downwards from the mud-line). Wave gauges for recording water elevation are placed at the upstream and downstream edges of the sand box and the middle of the sand box. Pore-water pressure and water elevation are measured, respectively, by pore pressure sensors and wave gauges whose accuracy can meet 0.5% during the experiments and the device locations are indicated in Figure 1.

Experimental sketches: (a) flume for wave–seabed interaction and (b) device layout in a sandy seabed.
The sandy sediment is used for the laboratory experiments and its properties are listed in Table 1. Fluid loading from still water is constantly imposed on a sandy seabed for 3 days until the subsidence of the mud-line is ignorable, that is, variation of void ratio is negligible. Then, the laboratory experiments are carried out for data collection.
Properties of sandy sediment.
Experimental conditions and procedure
The experimental conditions are summarized in Table 2 and water depth (d) is kept at 0.3 m for all cases. According to the diagram of “the range of suitability of various wave theories” proposed by LéMehauté, wave conditions of this study mainly fall in three wave theory zones (Figure 2).18–20 In the figure, H is the wave height, T is the wave period, d is the water depth, and g is the gravitational acceleration. The experimental procedure is as follows:
Wave flume and cavity box are first emptied and cleaned before the pore-water pressure transducers are soaked to get rid of air bubbles and installed at specific locations.
Wave flume is filled with clean water before sediment particles are poured into the water gently by hands, rubbed by fingers to avoid air bubbles and lumps.
Still water is maintained at a given depth (0.3 m) for 3 days.
Wave-maker is switched on to generate the desired waves.
Pore-water pressure and water elevation are sampled continuously (the sampling interval for the water elevation and pressure are 0.03 s and 0.02 s, respectively).
Experimental conditions.


Results and discussion
The interactions between the incident waves and a sandy bed are studied in terms of pore-water pressure, phase lag, and wave damping. Also, the experimental results have been compared with an analytical solution by Hsu and Jeng. 4
Wave–seabed interactions
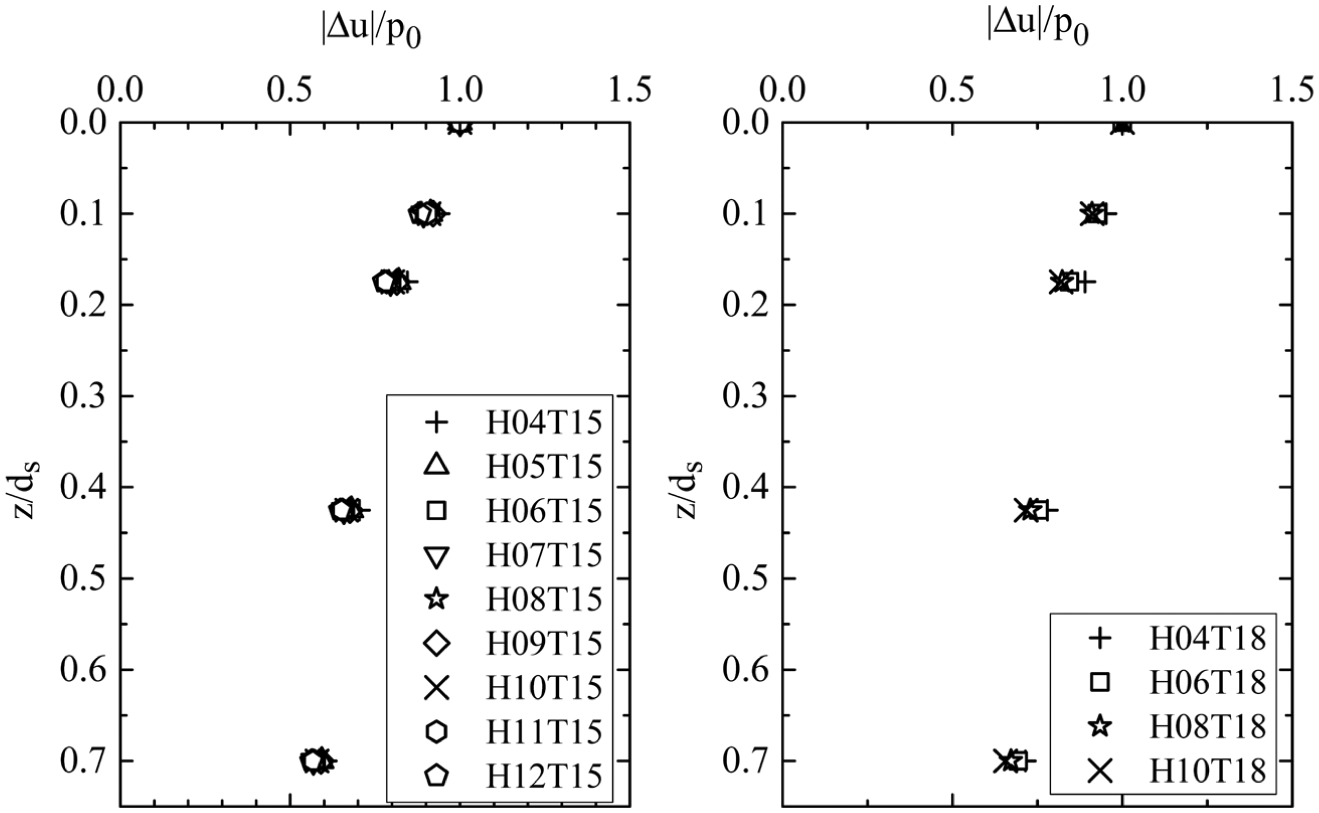
As shown in Figure 3, it can be seen that the wave-driven pore-water pressure (Δu) is periodically oscillatory, and the residual pore-water pressure is negligible in a sandy seabed. Such phenomena happened in all experimental tests, which is ascribed to the fact that the grain size of sediment used in this study is too large (d50 = 0.147 mm) to cause residual pore-water pressure. The pore-water pressure induced by the previous wave loading is fully dissipated before the next wave reaches. Figure 4 presents typical profiles of wave (η) and pore-water pressure within a period. It can be found that the amplitude of pore-water pressure (|Δu|) decreases toward the seabed bottom. The vertical distribution of amplitude of pore-water pressure in the seabed is shown in Figure 5. In the figure, the amplitudes of pore-water pressure (|Δu|) are normalized by that of dynamic wave pressure at the seabed surface (p0) and depths (z) are normalized by the thickness of seabed (ds).

Wave-driven pore-water pressure at different depths in case no. 1.
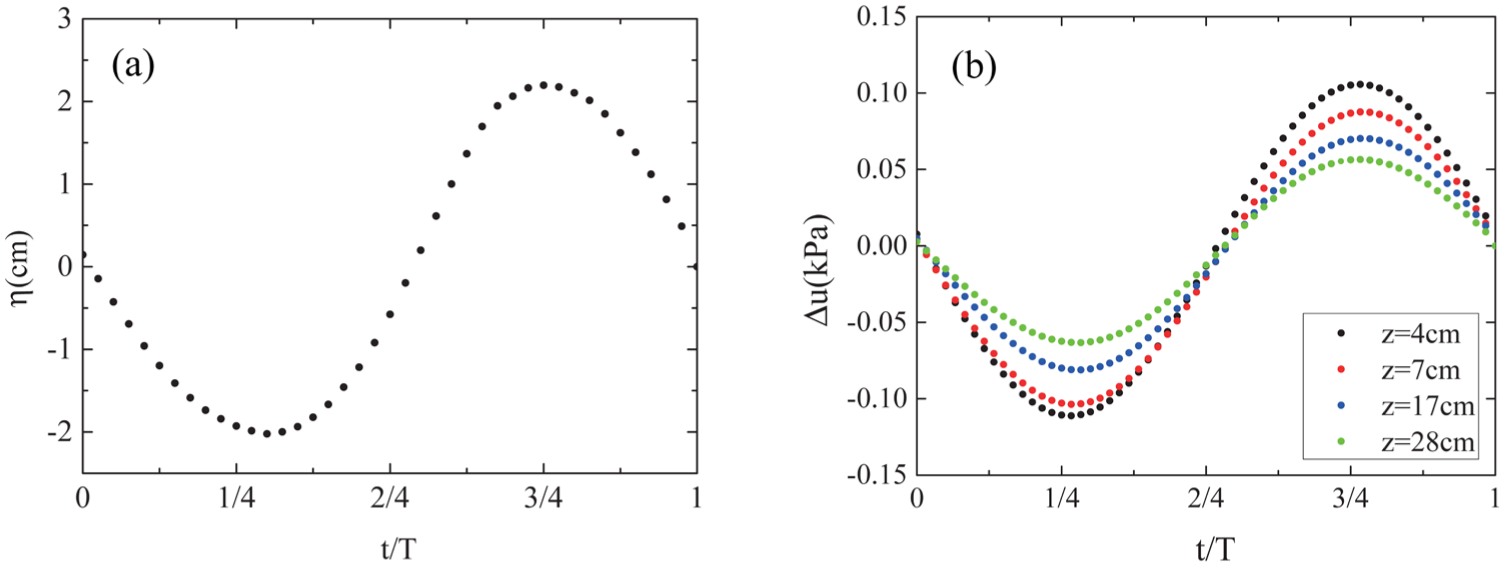
Typical profiles within a period: (a) water elevation and (b) pore-water pressure.

Vertical distribution of amplitude of wave-driven pore-water pressure.
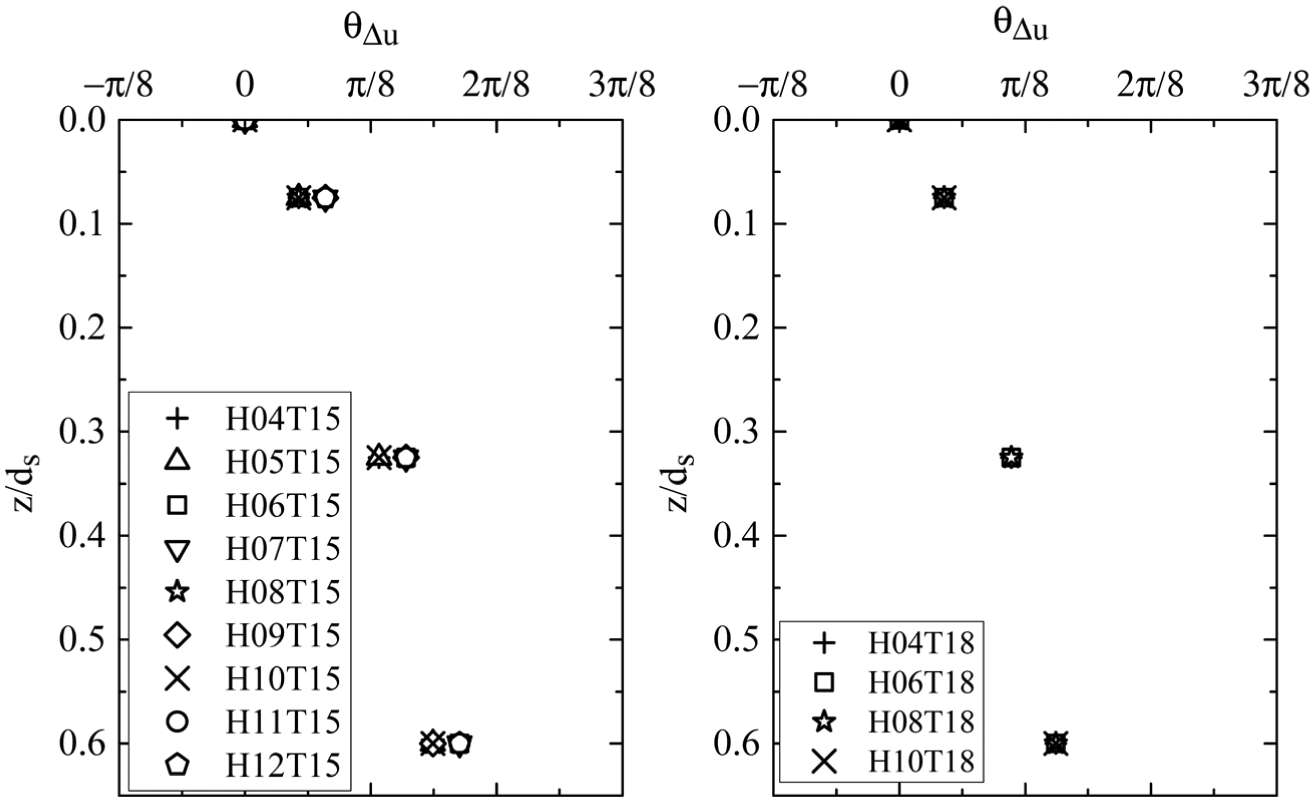
According to Okusa, 21 the phase lag observed in the experiments is mainly due to the effects of permeability and hydraulic gradient. This section will further investigate the phase lag of pore-water pressure in vertical direction. The phase lag between the same characteristic nodes of pore-water pressure at different depth within the seabed is calculated by θΔu = 2π(t2 − t1)/T (in which θΔu is the phase lag of pore-water pressure, T is the wave period, and t1 and t2 are the occurrence time of characteristic nodes of pore-water pressure recorded by P1 and P2–P4, respectively). The characteristic nodes include the maximum (tcrest), minimum (ttrough), and zero-down-crossing (tz − d − c) points. Figure 6 shows that the phase lag of pore-water pressure increases as wave pressure propagates downwards the seabed bottom. However, at the deeper seabed (z = 17–28 cm), the phase lag of pore pressure changes slightly as depth increases, with a maximum phase lag less than 2π/8 for all experiments. Part of the stresses will be shifted to soil particles through the frictional effect between soil particles and pore water, and propagate into deeper soil in the form of pressure waves as the depth increases. As the stresses transferred by soil particles are faster, the phase lag is reduced below certain depth. 7

Phase lag of pore-water pressure within seabed.
When ocean waves propagate over a seabed, wave energy loss could be caused by bottom friction and percolation. According to Savage and Fairchild, 16 it was assumed that no loss would be caused by percolation when the median diameter (d50) of sand is less than 0.216 mm. Thus, the wave damping observed in this study (d50 = 0.147 mm) is induced mainly by the bottom friction of the sandy layer. For the evaluation of bottom friction loss, it is desired to eliminate the side friction loss from the total loss. According to Keulegan, 22 mean loss for two sides can be estimated as follows

where B is the width of flume, L is the wave length, and d is the water depth.
The wave height Hs1 is recorded by the wave gauge s1 installed in the middle section of the seabed, where the pore-water pressures are also measured and the downstream wave height Hs2 (the heights have been adjusted to eliminate effects of side friction) is recorded by the wave gauge s2. Wave height attenuation takes place due to wave–seabed interactions. The wave damping caused by the bottom friction is evaluated by the difference ΔH between the wave height Hs1 and the downstream wave height Hs2, divided by the wave height Hs1, as suggested by Corvaro et al. 17 Wave damping for all cases is listed in Table 3, showing that a maximum value of the attenuation of the incident wave height is up to 7.23% in the case no. 7. On the basis of the theory developed by Putnam and Johnson, an expression for the average rate of energy dissipation by bottom friction per unit area is given as follows23,24

where Kf is obtained from the results of an experiment conducted by Bagnold and is equal to 0.08, ρ is the density of water, H is the wave height, T is the wave period, and the parameter F is calculated as follows

Wave damping by the permeable seabed.

The theoretical results (Hts2) from Putnam and Johnson’s equation are also listed in Table 3. As can be seen, the theoretical heights do not agree well with the observed heights when the initial wave height is small.
Comparison with analytical solution
An analytical solution for wave-induced soil response is developed by Hsu and Jeng 4 for a seabed of finite thickness. Based on a 3D consolidation theory of Biot, the governing equations describing the phenomenon of wave-induced soil response, |Δu|/p0, is given as follows

where v is Poisson’s ratio of the seabed, and the other parameters are defined as follows


where kx is the soil permeability in horizontal direction, kz is the soil permeability in vertical direction, n is the soil porosity, e is the soil void ratio, G is the soil shear modulus, β is the compressibility of pore fluid, Kw is the bulk modulus of elasticity of water which may be taken as 2 × 10⁹ N/m2, Sr is the degree of saturation, and Pwo is the absolute pore-water pressure. The expressions of six resulting coefficients, C1–C6, can be found in Hsu and Jeng. 4
The following parameters are adopted in the analytical solution: soil permeability (kx = kz) = 1.8 × 10⁻⁴ m/s, shear modulus (G) = 1.27 × 10⁷ N/m2, Poisson’s ratio (v) = 0.3, porosity (n) = 0.43, and the degree of saturation (Sr) = 0.975. As shown in Figure 7, the experimental results are overall in good agreements with the analytical solution although the pore pressure obtained from analytical solution is slightly larger than that of experimental results. One possible explanation is that the bed ripples (see Figure 8) generated by the continuous wave loading cause the seabed depth to be slightly different from the initial depth.

Comparison of the amplitude of pore-water pressure (|Δu|/p0) between experimental results and analytical data. 4

Bed ripples observed in experiment.
Effects of wave period
Waver period (T) is one of the factors affecting the wave–seabed interactions. For instance, Figure 9 shows the pore-water pressure recorded by P4 (z = 28 cm) within a wave period for three cases (no. 2, no. 7, and no. 15), indicating that the amplitude of pore-water pressure increases with an increasing wave period. As shown in Figure 10, the amplitude of pore-water pressure, |Δu|/p0, generally increases as the wave period increases at the same seabed depth. However, the increase in |Δu|/p0 becomes smaller when the wave period increases in the shallow layer of the seabed (z = 4, 7 cm) in the cases of wave height being 8 cm.

Wave-driven pore-water pressure within a period for different wave period.

Influences of wave period on the amplitude of pore-water pressure.
Due to the existence of phase lag, the wave pressure imposed on the seabed surface (p0) could be smaller than the pore-water pressure within seabed at some time, that is, a net upward pressure (pnet) may act on the sand layer, resulting in the seabed instability. In order to illustrate this phenomenon clearly, values of pnet are listed in Table 4 for different wave period. As suggested by Tsui and Helfrich, 5 the impact of pnet on the seabed can be reflected by the ratio of the effective weight of the soil to the net pressure (pwt/pnet). Because the p0 is not measured in these experiments, pore pressure recorded by P1 (z = 4 cm) is adopted as an approximate substitution of p0. As given in Table 4, the value of pwt/pnet increases as the relative depth increases, and it decreases with an increasing wave period. This explains the field observation of the seabed failure around marine structures in the severe storms with long period waves.
Net upward pressure within seabed under wave action.

Effects of wave height
The impacts of wave height on wave–seabed interactions are also investigated. As shown in Figure 11, as the wave height is enlarged, the variation of amplitude of pore-water pressure is negligible, and the individual value of |Δu|/p0 did not vary from the average value by more than 5.5%. Figure 12 shows the relations between wave height and phase lag of pore-water pressure within seabed. It is found that the phase lag within seabed does not change much when wave height varies, and the individual value of θΔu did not vary from the average value by more than 8%. In other words, wave height has a less impact on the distribution of pore-water pressure and phase lag. These observations agree well with the results of Chang et al. 7 The experimental results demonstrate a fluid-dominated mechanism for attenuation of pore-water pressure, because the pore pressure waves propagate into the seabed only via pore water. It is in consistent with the conclusion of Tisato and Quintal. 25
Influences of wave height on amplitude of pore-water pressure.
Influences of wave height on phase lag of pore-water pressure within seabed.
It can be clearly seen from Figure 13 that wave damping increases with an increasing nonlinearity parameter (ε = Hs1/d) but only up to a value of ε = 0.2. A further increase in ε leads to a smaller wave damping. The best-fit curve of the experimental data from this study can be given as ΔH/Hs1 = −2.6789ε2 + 0.9456ε − 0.01779, with a coefficient of determination being 0.7902.

Dependence of wave dissipation on the nonlinearity parameter (ε = Hs1/d).
Conclusion
In this study, a series of laboratory experiments were carried out for the investigation of interactions between waves and a sandy seabed, and the distribution of wave-driven pore-water pressures and the phenomenon of wave damping were measured and analyzed. Based on the experimental results, the following conclusions can be drawn. (1) Amplitude of the wave-driven pore-water pressure within the seabed decreases toward the seabed bottom, and it increases with an increasing wave period. (2) A phase lag of pore-water pressure can be clearly identified, and it becomes larger in a deeper seabed. The phase lag contributes to net upward pressure on the sandy layer, which may lead to seabed instability especially with long period waves. The design of offshore structures built on the sandy seabed should take the net upward pressure into consideration. (3) Due to the bottom friction of the sandy seabed, the attenuation of wave height is obviously observed, and a maximum value of the attenuation of incident wave height is up to 7.23% in the laboratory tests. The construction cost of offshore structures can be reduced by taking advantage of wave damping caused by the sandy seabed. (4) Specifically, wave damping increases with an increasing nonlinearity parameter but only up to a value of ε = 0.2, and a further increase in ε leads to a smaller wave damping.
Footnotes
Academic Editor: Hongwei Wu
Declaration of conflicting interests
The author(s) declared no potential conflicts of interest with respect to the research, authorship, and/or publication of this article.
Funding
The author(s) disclosed receipt of the following financial support for the research, authorship, and/or publication of this article: This research work is financially supported by the National Science Fund for Distinguished Young Scholars of China (51425901), the Fundamental Research Funds for the Central University of China (2013B31614), the 111 Project (B12032), and the marine renewable energy research project of State Oceanic Administration (GHME2013GC03, GHME2015GC01).